Fig. 4.1
ARFI values in kidneys are deeply affected by many elements. One of them is the anatomical architecture. In fact they are lower in the renal sinus (a) where the vascular elements are predominant and where the SW meet more interfaces and higher in the cortex (b) where anisotropy plays a major role

Fig. 4.2
The most important element which influences the SWV in the kidneys is anisotropy. In fact the SWV is lower when the US beam is parallel to the pyramids (a) because the SW travel perpendicularly to the Henle loops, thus meeting many interfaces. The SWV is higher when the US beam is perpendicular (b) to the pyramids because the SW are parallel to the Henle loops


Fig. 4.3
According to many reports, SW is high in the first stages of CKD (a) and gradually decreases (b, c) probably because of the progressive degeneration of the parenchyma

Fig. 4.4
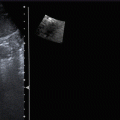
Posttraumatic cyst communicating with calices and characterized by low SWV. Pure fluids are characterized by XXX values


Fig. 4.5
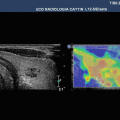
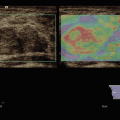
Angiomyolipoma is a lesion composed by smooth muscles, fat elements, and vessels. CEUS can depict the architecture of the large and convoluted vessels (a), while ARFI can show the low values characteristic of fat (b)

Fig. 4.6
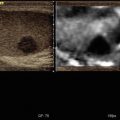
Oncocytomas are highly vascularized too, with a central scar (a) which can be misunderstood for necrosis. ARFI can help in the differential diagnosis because the SWV are lower (b)

Fig. 4.7
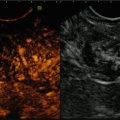
Clear cell renal cell carcinomas are characterized by a highly vascular pattern (a) which can be easily depicted by CEUS; in many cases they exhibit an ARFI pattern characterized by high SWV (b)

Fig. 4.8
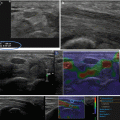
(a) The evaluation of a complex cyst is very difficult because the dimensions of the ROI are fixed, and it must be completely included in the lesion in order to obtain correct measurements. In this example the ROI is placed in the solid portion of a cystic papillary RCC and the SWV are far different (b) from the values obtained in clear cell renal cell carcinomas and in oncocytomas
4.6 Image Gallery
References
1.
2.
3.
4.
5.
Syversveen T, Midtvedt K, Berstad AE, et al. Tissue elasticity estimated by acoustic radiation force impulse quantification depends on the applied transducer force: an experimental study in kidney transplant patients. Eur Radiol. 2012;22:2130–7.CrossRefPubMed
Related posts:
Stay updated, free articles. Join our Telegram channel

Full access? Get Clinical Tree


