CHAPTER 18 Kidneys
CLINICAL CONSIDERATIONS
Laboratory Assessment of Renal Function
Estimated Creatinine Clearance and Glomerular Filtration Rate
Estimated creatinine clearance may be calculated using serum creatinine with adjustments made for sex, age, and body weight. Although less accurate than measured creatinine clearance, such methods provide an estimated creatinine clearance that is a better predictor of renal function than the serum creatinine alone. Several formulas are available for this calculation, and calculators and on-line sites are available to simplify the calculations. One of the most commonly used (and least complicated) equations is shown in Box 18-1.
RENAL ANATOMY
Renal Parenchyma
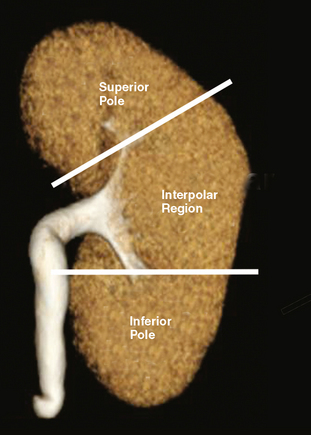
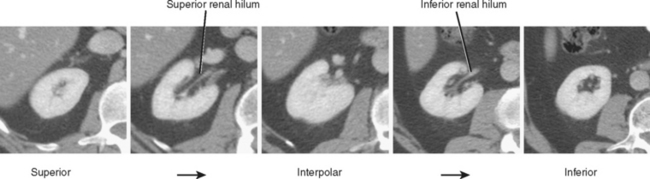
The kidneys can be divided into three main regions from cranial to caudal. Each end of the kidney is commonly called a pole. The portion of the kidney between the poles is called the interpolar region and contains the renal hilum (Fig. 18-1).
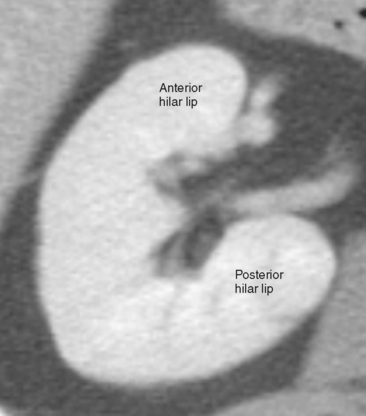
On axial sections, the polar regions of the kidney typically form a closed circle or “donut” shape, with the “hole” formed by renal sinus fat. The anteromedial aspect of the interpolar region is interrupted by the renal hilum to make a C shape. In this region, the anterior and posterior hilar lip is identified (Fig. 18-2). In most kidneys, the renal hilum faces more anteromedial in the upper half of the kidney and more directly medial in the lower half.
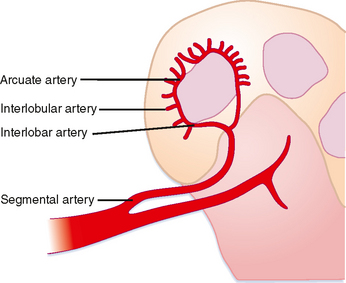
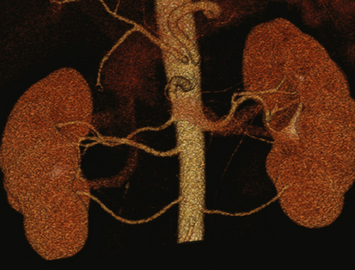
The solid renal parenchyma consists of the peripheral renal cortex and more central renal medulla. The nephrons within the cortex comprise some of the most highly perfused parenchymal tissue in the body. More tenuous vascular supply to the renal medulla makes it more susceptible to ischemia. Each segmental branch of the renal artery divides into multiple interlobar arteries that course along the periphery of the medullary pyramids and causes small interlobular branches (Fig. 18-3). Because the interlobular arteries form an arch overlying the pyramid, they are called the arcuate arteries. These terminal branches have no collateral circulation.
Renal Collecting System
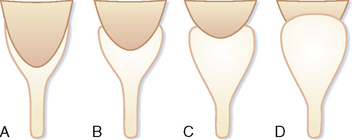
Urine that is concentrated in the renal papilla is subsequently excreted into a lumen lined with transitional epithelium. The small portion of the lumen surrounding the papilla is called the calyx. The shape of the calyx is formed by the impression of the renal papilla. Increasing pressure within the lumen initially distends the fornices (acutely angled portions of the calyx along the sides of the papillae), whereas the central portion of the papillary impression is preserved. Chronic obstruction, however, results in damage to the papilla, evident in the “clubbed” calyx of papillary necrosis (Fig. 18-4).
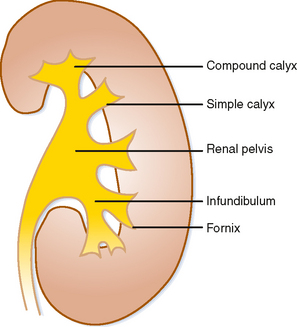
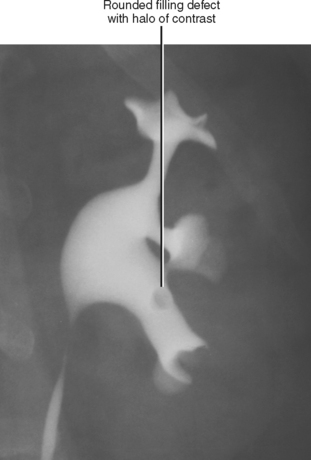
A simple calyx receives urine from a single papilla; a compound calyx receives urine from multiple papillae (Fig. 18-5). Urine from the calyces flows to the renal sinus via tributaries called infundibula. Occasionally, a papilla will communicate directly with an infundibulum or the renal pelvis and is considered to be an aberrant papilla. Unlike other filling defects within the renal collecting system (e.g., tumor, stone, clot), an aberrant papilla usually has a small fornix around it, seen as a halo on conventional urography (Fig. 18-6). However, sometimes ureteroscopy is required to confirm the diagnosis in patients with hematuria.
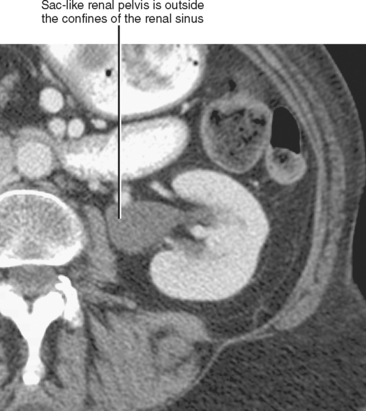
If the renal pelvis is entirely within the confines of the renal sinus, it is considered intrarenal. If the renal pelvis extends out of the renal sinus, it is considered to be an extrarenal pelvis (Fig. 18-7). Because an extrarenal pelvis is not confined by the renal parenchyma, there is a tendency for it to expand. Although this dilatation of the renal pelvis may occasionally mimic hydronephrosis, delicate and sharply defined calyces and thin infundibula can be used to differentiate an extrarenal pelvis from obstruction.
Congenital Variants of Renal Anatomy
Abnormalities of Number
Supernumerary kidney describes the presence of more than two kidneys, each surrounded by its own renal capsule. In some cases, two separate kidneys drain into a bifid renal pelvis, ultimately drained by a common ureter. In other cases, each renal unit has its own ureter. Supernumerary kidneys are quite rare and have been associated with aortic coarctation, vaginal atresia, and urethral duplications.
Abnormalities of Lobation
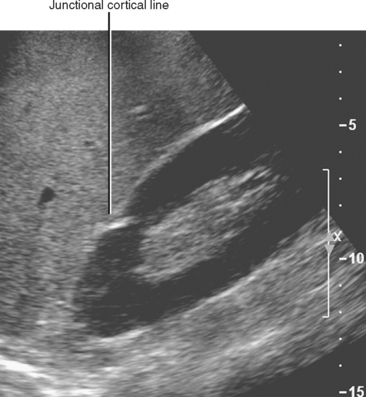
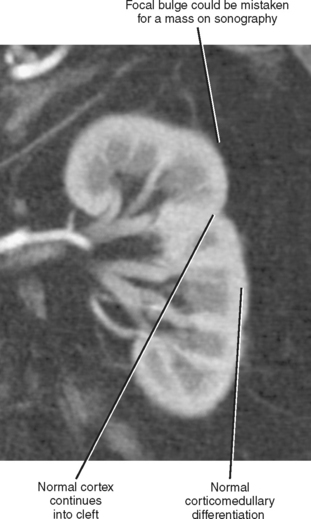
As the lobules of metanephric blastema coalesce to form each kidney, they do not always result in a smooth, uniform band of cortex. A junctional cortical line is a common septum of capsule typically seen on ultrasound as an echogenic line at the site of fusion between the superior pole and middle third of the kidney (Fig. 18-8). When multiple clefts in the renal cortex are present throughout the kidney, it is described as fetal lobulation. Fetal lobulation is best differentiated from renal scars during the corticomedullary phase of enhancement on computed tomography (CT) or magnetic resonance imaging (MRI) because cortex can be followed into the indentation that occurs between calyces (Fig. 18-9). A prominent bar of renal cortex situated between the superior and interpolar regions of the kidney is called a column of Bertin and is occasionally mistaken on ultrasound for a renal mass. Normal parenchymal enhancement on CT or MRI allows definitive characterization.
Renal Ectopia
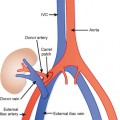
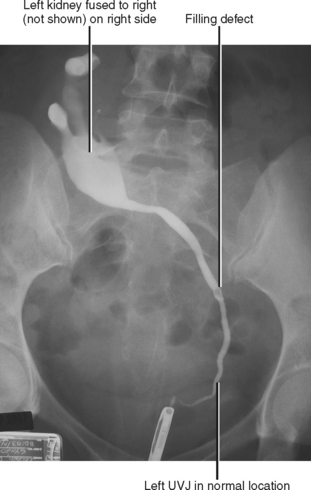
The upper pelvis is the most common ectopic location for the kidney; most cases are also associated with abnormalities of rotation. Extraaortic origin of the renal arteries and accessory renal arteries are common. When both kidneys are on the same side crossed ectopia is present, because the ureter from one kidney must cross the midline to insert into the bladder (Fig. 18-10). Crossed ectopia can be either fused or unfused. When fused, the condition is described as crossed fused ectopia. The fused kidneys can have a variety of orientations, including side by side, in-line, or perpendicular. Thoracic kidneys are the least common form of renal ectopia.
Abnormalities of Fusion
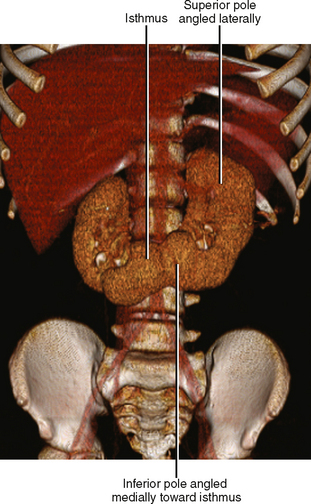
Horseshoe kidneys result from midline fusion of the kidneys, typically at the level of the origin of the inferior mesenteric artery. The isthmus connecting the kidneys is variable, ranging from normal renal cortex to a thin fibrous band. Blood supply is variable and often includes extraaortic and multiple vessel origins. The axes of the renal moeities are abnormal with the inferior “poles” angled medially. Prominent extrarenal pelves are typically positioned anteriorly (Fig. 18-11). Pancake kidney describes a more severe fusion anomaly with a single, flat kidney positioned low in the pelvis with an anterior collecting system drained by either one or two ureters.
Preprocedure Anatomic Considerations
Evaluation of the Living Renal Donor
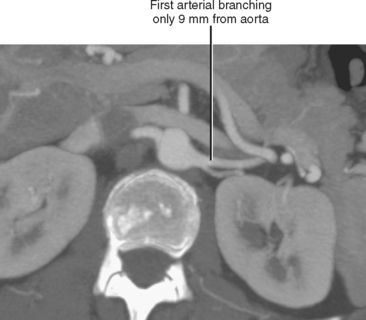
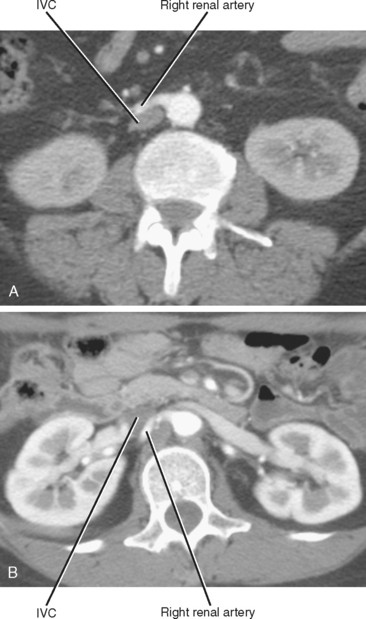
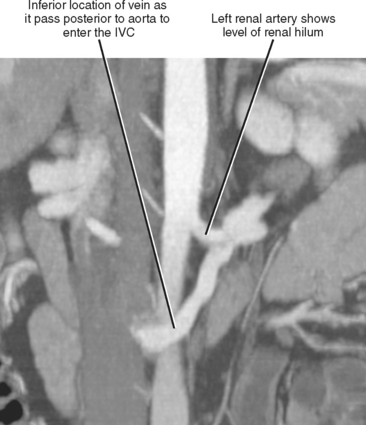
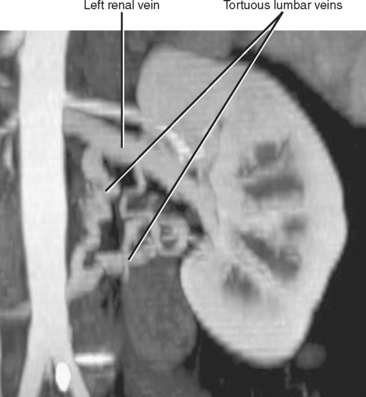
Imaging must provide detailed images of the renal parenchyma and a survey of arterial, venous, and ureteral anatomy. Table 18-1 provides a quick guide itemizing key imaging findings in the potential renal donor.
Table 18-1 Imaging the Living Renal Donor
| Inspected Areas | Comments |
|---|---|
| Stones | Always include unenhanced computed tomographic images to look for renal stones. |
| Renal arteries | |
| Leftrenal vein | |
| Right renal vein | Note number of veins by inspecting inferior vena cava along entire length of kidney. |
| Ureters | Look for duplication, large extrarenal pelvis. |
Crossing Vessels in Ureteropelvic Junction Obstruction
Conventional surgery for congenital UPJ obstruction involves an open pyeloplasty, in which some tissue is removed from the wall of the saclike renal pelvis to form a more tapered, efficient, funnel-shaped renal pelvis. Some forms of congenital UPJ obstruction are now treated with transureteroscopic endopyelotomy in which an incision is made from within the ureter using a ureteroscope. Because the fascia of the retroperitoneum prevents significant extravasation, the incision usually heals to form a larger lumen. If, however, a vessel crosses the UPJ at the level of obstruction, a blind incision made from the inside of the ureteral lumen can result in severe hemorrhage. Made aware of such a vessel, the urologist may choose to perform an alternate procedure to avoid hemorrhagic complications.
Recent advances in MDCT and MRI permit cross-sectional vascular studies to replace conventional angiography before UPJ repair (Fig. 18-18). Box 18-2 provides some tips regarding crossing vessels in UPJ obstruction.
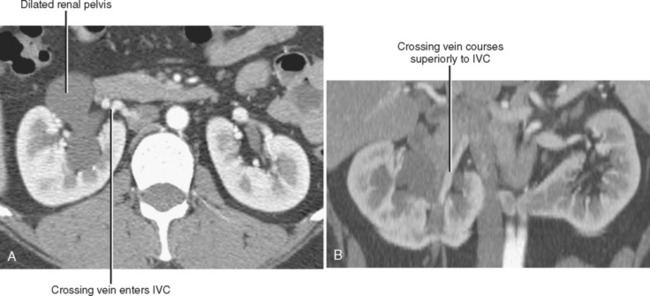
BOX 18-2 Crossing Vessels in Ureteropelvic Junction Obstruction
NORMAL IMAGING APPEARANCE OF THE KIDNEYS
Ultrasound Appearance of the Kidneys
Ultrasound permits real-time optimization of imaging relative to the axis of each kidney. In most cases, the kidneys are situated with the inferior poles slightly more lateral and anterior than the superior poles. Each kidney should always be evaluated in long axis (coronal, sagittal, or both, depending on sonographic window) and axial to the kidney.
The cortex of a normal kidney is usually less echogenic than the adjacent normal liver. When the renal cortex is more echogenic than the adjacent liver, there is a high correlation with renal disease, although sensitivity is relatively low, according to Platt and colleagues (Fig. 18-19). When echogenicity of the renal cortex equals that of the liver, renal function is abnormal in approximately 38% of cases. In clinical practice, it is probably best to categorize the renal cortex as hypoechoic, isoechoic, or hyperechoic compared with normal liver, and then state a correlative risk for associated renal parenchymal disease (Table 18-2).
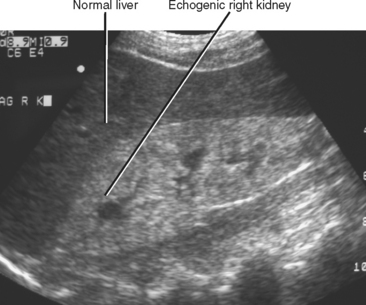
Table 18-2 Association between Renal Cortical Echogenicity and Renal Parenchymal Disease
| Echogenicity of Renal Cortex * | Prevalence of Renal Disease |
|---|---|
| Hypoechoic | Low |
| Isoechoic | Moderate |
| Hyperechoic | High |
* Echogenicity as compared with liver.
Renal size can be measured in several ways. Calculation of the estimated renal volume is considered by some to be the most accurate assessment of renal size available with ultrasound, although renal length alone is more commonly reported. Most radiologists consider 10 to 12 cm to be an approximate reference range for renal length in adults, allowing for an additional 1 cm in either direction for patients at the extremes of height. Size disparity greater than 1.5 cm between kidneys should raise suspicion that one kidney is abnormal.
Computed Tomographic Appearance of the Kidneys
The presence or absence of intravenous contrast media, as well as the phase of contrast enhancement, are key factors that determine the appearance of the renal parenchyma on CT (Table 18-3).
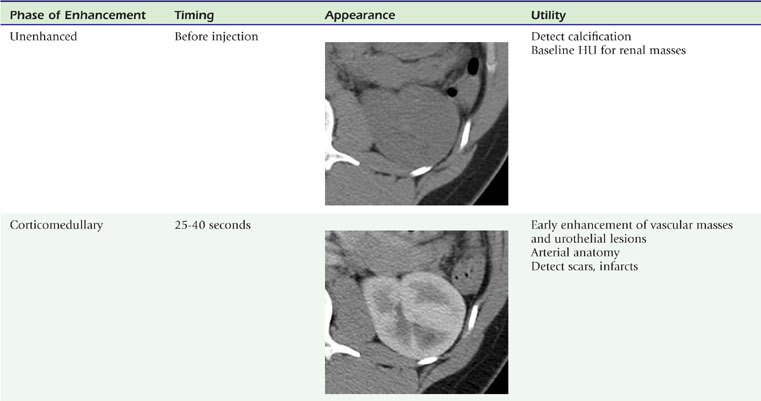
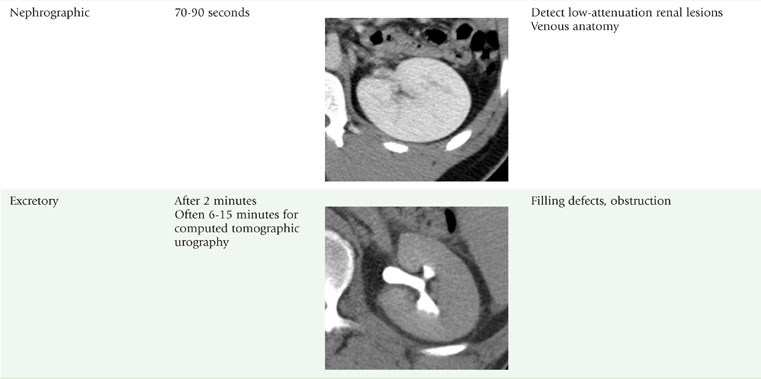
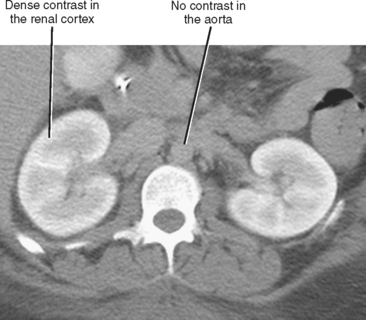
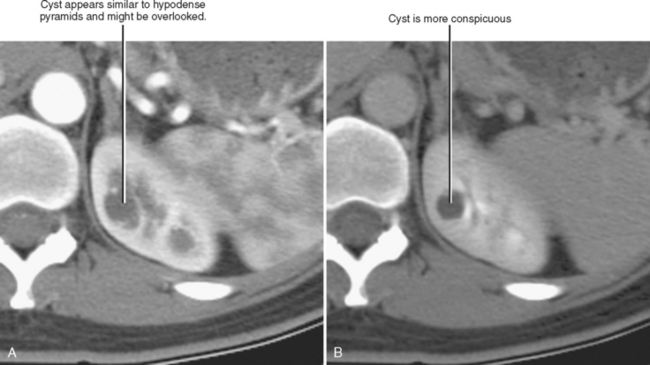
The corticomedullary phase is prolonged in the presence of ureteral or venous obstruction and can persist for days in cases of acute tubular necrosis (ATN; Fig. 18-20). The vascularity of some tumors may be most apparent during this phase (Fig. 18-21). However, small, low-attenuation lesions in the medulla are often obscured during this phase. The uniform high attenuation of the nephrographic phase provides an optimal background for detecting small, low-attenuation lesions in the renal parenchyma (Fig. 18-22).
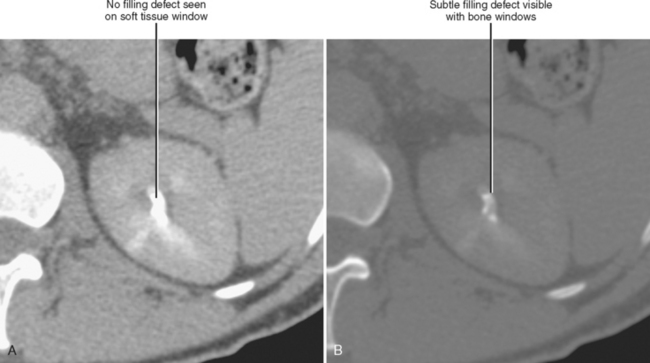
The visible contrast seen in the excretory phase has been concentrated many-fold. In fact, evaluation of the renal collecting system during the excretory phase often requires window and level settings approaching those used for evaluating the osseous structures (Fig. 18-23). Some centers use diuretics or fluid bolus, or both, during CT urography to dilute the excreted contrast to improve assessment of the urothelium.
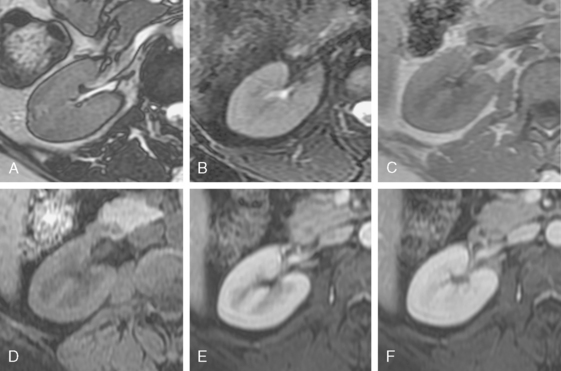
Magnetic Resonance Imaging
The renal cortex and medulla both have high signal intensity on T2-weighted images resulting in poor corticomedullary differentiation. However, T1-weighted images provide good corticomedullary differentiation. Calcifications and renal calculi are notoriously poorly demonstrated with MRI. The phases of nephrogram development and contrast excretion parallel those seen on contrast-enhanced CT with one notable exception (Fig. 18-24). Unlike the excretory phase of enhanced CT, signal intensity within the renal collecting systems is reduced on T1- and T2-weighted MR images once excreted gadolinium-based contrast media becomes sufficiently concentrated. This phenomenon is due to T2-shortening and susceptibility (T2*) effects caused by concentrated gadolinium, and can potentially obscure filling defects and urothelial lesions.
IMAGING EVALUATION FOR RENAL FAILURE
Types and Causes of Renal Failure
The causes of renal failure can be categorized as prerenal, renal, and postrenal (Table 18-4).
Table 18-4 Causes of Renal Failure
| Category | Disease Process |
|---|---|
| Prerenal | Congestive heart failure, dehydration, diuretic use, burns, sepsis, hemorrhage, cirrhosis, diabetic ketoacidosis, renal artery stenosis* |
| Renal | Diabetes, hypertension, acute tubular necrosis,* chronic glomerulonephritis, autosomal dominant polycystic kidney disease,* multiple myeloma, interstitial nephritis, urate nephropathy, acute cortical necrosis, rhabdomyolysis |
| Postrenal | Ureteral obstruction,* bladder outlet obstruction,* neurogenic bladder* |
Ultrasound Evaluation for Renal Failure
Ultrasound is usually used in the initial evaluation of the patient with newly diagnosed renal failure. Even when there is another plausible explanation for decreased renal function (e.g., known prerenal causes), ultrasound offers the opportunity to rapidly and noninvasively identify a potentially correctible cause of renal failure. Table 18-5 summarizes a checklist approach to the ultrasound examination.
Table 18-5 Checklist Approach to Ultrasound for Renal Failure
| Ultrasound Finding | Comments |
|---|---|
| Hydronephrosis | |
| Kidney size | |
| Cortical echogenicity | Increased echogenicity has high association with parenchymal disease |
| Resistive index (RI) | Acute tubular necrosis usually results in an increased RI, whereas prerenal causes usually do not have an increased RI; postrenal causes often increase the RI, but hydronephrosis should be present in those cases |
| Bladder distension | If present, suspect neurogenic bladder or outlet obstruction |
Increased Echogenicity
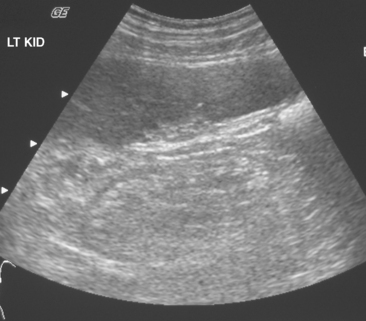
Increased cortical echogenicity is associated with many forms of chronic renal parenchymal disease and indicates a renal cause for renal failure. When abnormal echogenicity is detected, it is important to note whether it is unilateral or bilateral. Chronic glomerulonephritis usually causes bilateral increased renal echogenicity with smooth atrophy, whereas renal artery stenosis usually causes a similar but unilateral appearance (Fig. 18-25). Bilateral echogenic kidneys with renal hypertrophy can be seen associated with human immunodeficiency virus disease (see Fig. 18-19). The presence of contour irregularity usually indicates scarring, suggesting prior infection, reflux, or infarction. An acute change in renal cortical echogenicity is occasionally seen with pyelonehritis.
Hydronephrosis
Hydronephrosis is important to detect, because obstructive uropathy is often reversible if identified early. It is important to note, however, that the appearance of hydronephrosis does not necessarily indicate urinary obstruction (see Hydronephrosis and Its Mimics section later in this chapter).
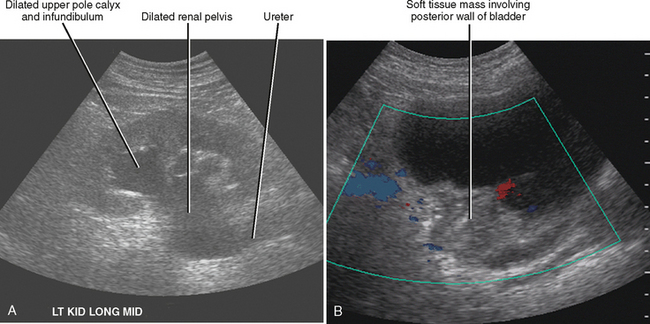
For most people, obstruction of a single ureter does not induce renal failure. Obstruction can cause renal failure if it is bilateral (Box 18-3) or if there is preexisting disease in the unobstructed kidney. Ultrasound can often identify the cause in cases of bilateral obstruction (Fig. 18-26). In cases of unilateral obstruction with acute renal failure, sonographic evaluation may show evidence of chronic renal parenchymal disease in the unobstructed kidney.
Magnetic Resonance Evaluation for Renal Failure
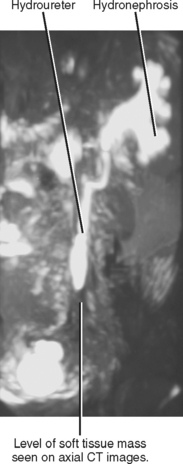
Unenhanced MRI can also be used to diagnose obstruction and identify the source (Fig. 18-27). MR angiography can be useful for the diagnosis of renal vascular abnormalities. Use of MR contrast agents in renal failure poses a lower risk than iodinated contrast material for exacerbating renal failure, but there is evidence that gadolinium-based MR contrast media pose some risk for systemic complications (nephrogenic systemic fibrosis) and should be used with caution in patients with severe or acute renal insufficiency. Static-fluid (T2-weighted) MR urography and phase-contrast MR angiography are useful techniques that do not require intravenous contrast material.
Nuclear Scintigraphy for Renal Failure
Renal scintigraphy can be performed with a variety of agents to provide assessment of either function or structure of the kidneys. Advantages of scintigraphy include accurate quantitative measurement of function and parenchymal mass without the risks for nephrotoxicity associated with iodinated contrast media or nephrogenic systemic fibrosis associated with gadolinium contrast agents.
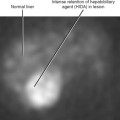
Technetium 99m dimercaptosuccinic acid (DMSA) and glucoheptonate (GHA) are both used for evaluation of renal parenchyma. Despite different methods of accumulation, each is sequestered by the renal cortex, providing an opportunity to quantify the volume of renal parenchymal tissue in each kidney. The most common indication for cortical scintigraphy is to evaluate kidneys that have been injured by vesicoureteral reflux, chronic obstruction, or severe or repeated urinary infections. Poorly functioning kidneys with little residual parenchymal volume may be removed because preservation offers opportunities for future complications (infection, hypertension) without contributing significantly to renal function. The presence of significant renal parenchyma may justify surgical repair to maximize the functional contribution of that kidney.
DIFFUSE ABNORMALITIES OF THE KIDNEY
Size and Contour of Diffuse Renal Disease
Bilateral Small Smooth Kidneys
The bilateral small smooth kidney pattern describes most of what is often diagnosed on sonography as “medical renal disease,” although the authors prefer the term renal parenchymal disease. These are chronic processes that lead to a loss of renal cortex gradually and uniformly. Small renal shadows may be seen on radiographs, and reniform shape is preserved on cross-sectional imaging. On ultrasound, the renal cortex is usually echogenic in this setting. Medullary cystic disease is encountered only rarely, and in addition to the echogenic atrophic cortex, the medullary pyramids are particularly hypoechoic. Table 18-6 lists the most common causes of bilateral smooth renal atrophy.
Table 18-6 Causes of Bilateral Small Smooth Kidneys
| Cause | Comments |
|---|---|
| Chronic glomerulonephritis | May have cortical nephrocalcinosis |
| Hypertensive nephrosclerosis | Longstanding hypertension |
| Bilateral renal artery stenosis | Often severe aortic disease or fibromuscular dysplasia |
| Analgesics | Papillary necrosis deforms calyces |
| Medullary cystic disease |
Unilateral Small Smooth Kidney
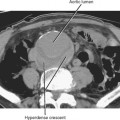
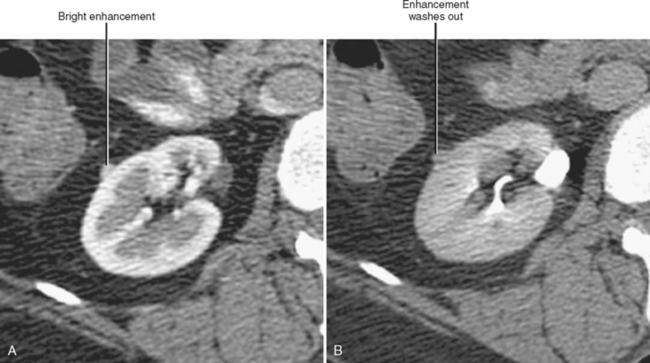
Global insult to one kidney may result in unilateral atrophy that is uniform and smooth. Table 18-7 lists causes of unilateral smooth renal atrophy. The most common cause is renal artery stenosis (see Fig. 18-25). CT and MR findings of renal artery stenosis parallel classic findings described on intravenous pyelogram, including one atrophic kidney with delayed nephrogram and excretion that can progress to a persistent nephrogram with hyperconcentrated excreted contrast media (Fig. 18-28). When the fine, weblike complex of ureteral arteries is recruited to contribute to collateral circulation, enlarged vessels are seen surrounding the proximal ureter, causing the classic “ureteral notching” seen on intravenous urogram (IVU).
Table 18-7 Causes of Unilateral Small Smooth Kidney
| Cause | Comments |
|---|---|
| Renal artery stenosis | Related posts:Stay updated, free articles. Join our Telegram channel
Full access? Get Clinical Tree
 Get Clinical Tree app for offline access

|