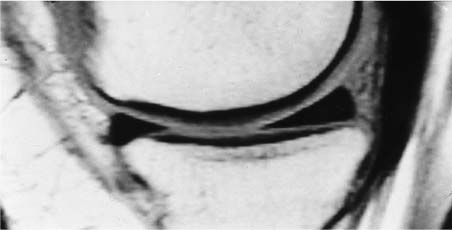
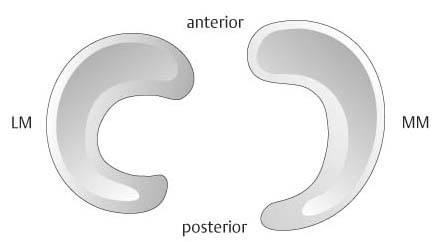
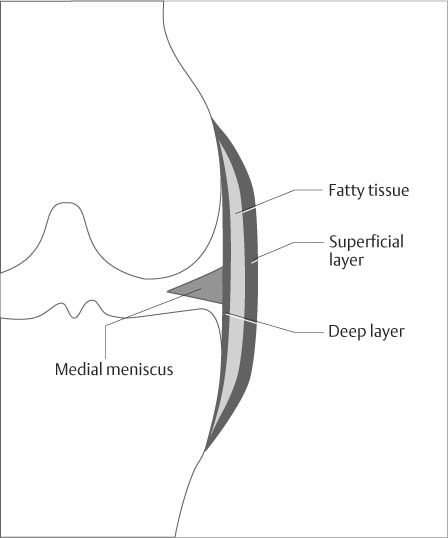
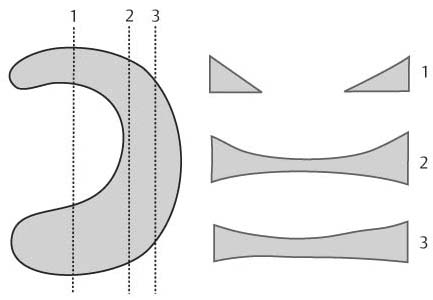
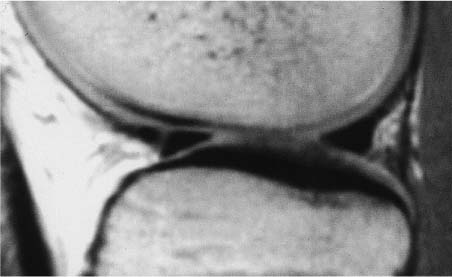
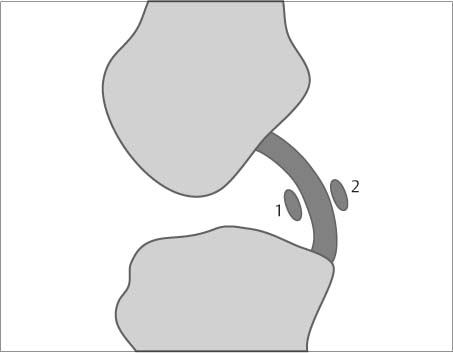
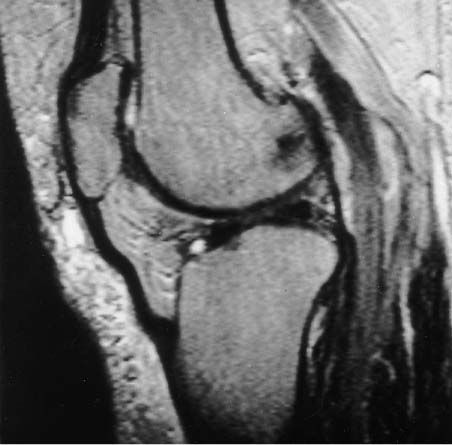
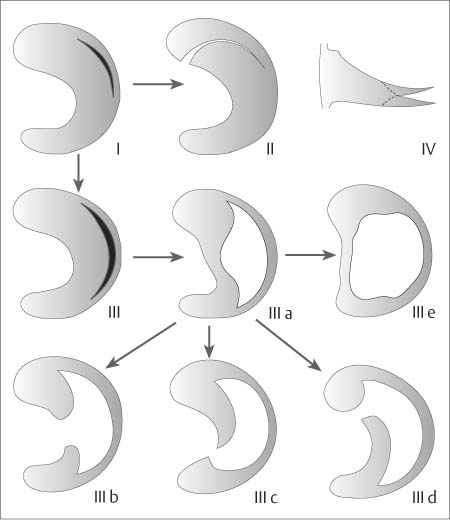
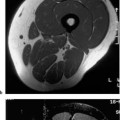
7 Knee The knee joint is one of the weight-bearing joints of the human body. The joint-moving levers of the tibia and femur are longer than for any other joint. Furthermore, complex and extensive movements are possible, involving numerous active and passive mechanisms. It is therefore not surprising that the knee is frequently affected by traumatic and degenerative conditions. Controlled investigations have revealed that the value of clinical examinations was overrated in the past (68), in particular, for the detection of meniscal tears. MRI has been found to be an informative and safe imaging method for the joints, especially for the knee. Today, MRI of the knee is the second most frequently performed MRI after spinal and cerebral MRI. It is often performed to support or reject the indication for arthroscopy. If applied in a meaningful way, it should reduce the number of diagnostic arthroscopies and, at the same time, pave the way for a targeted, therapy-oriented arthroscopy. The patient is examined supine in the foot first position. The knee is lightly flexed and the leg minimally externally rotated. As for all MRI examinations, the patient should be comfortable and in a position that he or she can maintain without motion for an extended period of time. Even small bumps or a hard surface can cause pain within minutes, invariably leading to undesirable movements by the patient. To avoid vibrations or movements when examining the extremities, small sandbags have been used with success. All manufacturers offer a high-resolution cylindrical coil for the knee. For very obese patients, it may be necessary to use a surface coil, such as the ring coil or the flexible rectangular coil. The joint space should be in the center of the coil. Often, the patella is incorrectly placed in the center, causing an undesirable loss of signal from the distal structures of the knee that are already outside the optimal field of the receiver coil. Points of tenderness or palpable lesions can be marked by taping a vitamin E capsule to the skin. Injuries and diseases of the knee usually involve several anatomic structures. The examination strategy should follow both a standard protocol that addresses most clinical questions and specific protocols used selectively for any specific question. The numerous recommendations that have been made are only partially based on empirical data and therefore should not be considered binding. Most authors recommend coronal and sagittal T1- weighted and T2-weighted SE sequences. For the sagittal sections, the leg should be externally rotated 15 to 20 degrees to encompass the anterior cruciate ligament in its entire length and along the axis of its course. As a double echo sequence, the T2-weighted pulse sequence can also generate proton density images. In one investigation, discrete meniscal tears that were undetectable on T1-weighted and T2-weighted images could be depicted only on the proton density weighted images (23). When interpreting the proton density images it must be kept in mind that they are susceptible to the magic angle effect and that not every increase in signal intensity corresponds to a pathologic lesion. Fast (turbo) SE sequences have no intrinsic disadvantage in comparison to conventional SE sequences as long as it is taken into consideration that they display fat at a higher signal intensity. All things considered, the fast SE technique is superior (120). However, when using sequences with long echo trains and short TEs, as used to image to image the menisci, loss of accuracy due to blurring effects is of concern. As result, short TE FSE sequences for the echo train length should probably not exceed four. Especially for acute injuries, the fat saturated T2-weighted SE and STIR sequences are superior since they visualize the edematous zones in the bone marrow and soft tissue at high contrast. The section thickness should not exceed 3 – 4 mm for SE sequences. The sequential sections should encompass the entire knee, including the peripheral meniscal regions. For the evaluation of the hyaline articular cartilage, numerous pulse sequences have been recommended. Fat saturated 3-D-GRE techniques give a high contrast between hyaline articular cartilage, intra-articular fluid and fatty tissue. Recht and co-workers (88) achieved the best results with a spoiled GRASS sequence with a TE of 10 msec and a flip angle of 60 degrees. Menisci of the human knee. These are crescentic fibrocartilage laminae (Fig. 7.1) that largely compensate for the incongruity between femoral and tibial articular surfaces and protect against points of excessive pressure by distributing the weight uniformly over a wider area. The standing adult transmits 40 – 60% of the weight through the menisci, reducinging compression of the articular cartilage. The menisci are 3 – 5 mm in height peripherally, decreasing to 0.5 mm at the inner free border. Both menisci have an anterior horn and a posterior horn, as well as a pars intermedia constituting the central two-thirds of the meniscus. Seen from above, the lateral meniscus exhibits a largely round configuration. It is attached anteriorly and posteriorly to the anterior and posterior tibial intercondylar area, respectively, and is only loosely fixed to the joint capsule elsewhere. The tendon of the popliteus passes freely through the joint capsule. The posterior horn of the lateral meniscus is unattached where it is passed by the popliteal tendon. The posterior horn of the lateral meniscus can send two ligaments to the medial femoral condyle, which pass posteriorly (posterior meniscofemoral ligament of Wrisberg) or anteriorly (anterior meniscofemoral ligament of Humphrey) to the posterior ligament. Either ligament is found in about 30 – 40% of cases and both together in about 10%. The medial meniscus has a slightly larger radius and is ovoid or comma-shaped (Fig. 7.2). Its width is larger in the region of the posterior horn than in the pars intermedia or anterior horn. The anterior horn is fixed to the anterior intercondylar area of the tibia (Fig. 7.3). The pars intermedia is attached to the deep layers of the medial collateral ligament. The anterior horns of both menisci are connected by the meniscofemoral ligament, which forms several components in about 10% of cases. The menisci consist of fibrocartilage with a large proportion of collagenous fibers containing individual cartilage cells. The stronger collagenous fibers are predominantly peripherally and longitudinally oriented. They are crossed by thinner, radially oriented fibers. In adulthood, the menisci are poorly vascularized. The capillary loops of the vascularized peripheral zone provide nourishment for the inner avascular meniscal regions. Anterior cruciate ligament. Its role is the prevention of anterior subluxation of the tibia. It arises from the posterior aspect of the inner surface of lateral femoral condyle and inserts in the anterior intercondylar area, anterolaterally to the anterior intercondylar eminence (Fig. 7.3). It is about 35 mm long and about 11 mm thick (57). The anterior ligament consists of three components: the anteromedial, intermediate, and posterolateral bundles. With the knee in extension, the entire ligament is uniformly taut; in flexion, the anteromedial bundle remains taut with the remaining bundles relaxed. Posterior cruciate ligament. This arises from the inner surface of the medial femoral condyle and inserts at the posterior aspect of the tibia in the posterior intercondylar area. It is considerably stronger than the anterior cruciate ligament. It is about 38 mm long and about 13 mm thick. When the knee is extended, the posterior cruciate ligament is relaxed and exhibits a superoposterior convexity (〉boomerang’ configuration). In flexion, the posterior cruciate ligament is taut and exhibits a straight course. The anterior (Wrisberg) and posterior (Humphrey) meniscofemoral ligaments respectively pass in front and behind the posterior cruciate ligament. Fig. 7.1 Sagittal proton density weighted SE image with visualization of the medial meniscus. Anterior and posterior horns of the meniscus are delineated as signal void triangles. Fig. 7.2 Surface view of lateral (LM) and medial meniscus (MM). Fig. 7.3 Schematic drawing of the attachment of the menisci and cruciate ligaments to the tibial plateau. Medial collateral ligament. This is especially important for the stability of the knee joint. It constitutes a superficial and deep layer (Fig. 7.4). It arises from the medial femoral epicondyle and extends to the medial surface of the tibia, about 7.5 – 10 cm distal to the joint space. The deep layer is firmly attached to the pars intermedia of the medial meniscus. Deep and superficial layers are separated by fatty tissue and a bursa. Lateral collateral ligament. This extends obliquely from the lateral femoral epicondyle posteroinferiorly to the fibular head. The popliteal tendon passes between the lateral meniscus and lateral collateral ligament and inserts at the distal femur laterally. Extensor mechanism. This comprises the quadriceps muscle and tendon, the patella and the patellar tendon. The quadriceps tendon inserts into the upper pole of the patella. Some fibers continue over the patella and insert as the patellar tendon at the tibial tuberosity. The majority of the fibers of the patellar tendon originate from the rectus femoris. The fibrocartilage of the menisci contains only a small proportion of free protons and, consequently, is displayed as signal void, regardless of the pulse sequences selected. It should be kept in mind that the somewhat higher signal intensity seen on GRE images should not inevitably be attributed to a pathologic process. T1-weighted and proton density-weighted sequences can show artificially increased signal intensities because of the magnetic angle phenomenon (40). Globular and linear meniscal increases in signal intensity can be caused by mucoid degeneration or a tear. The differentiation and prosposed classifications will be discussed later. Coronal and sagittal sections display the menisci as having a ‘bow tie’ configuration on the peripheral sections and as signal void triangles on the more central sections (Fig. 7.5). Fig. 7.4 Structure of the medial collateral ligament of the knee. Familiarity with a few anatomic peculiarities is required to avoid misidentifying them as pathologic findings. The transverse ligament connects the anterior horns of both menisci. It is located posterior to Hoffa’s fat pad and anterior to the joint capsule. In 22 – 38% of the sagittal sections, a high signal line (Fig. 7.6) is seen where the transverse ligament joins the anterior horn of the lateral meniscus (48, 129). This high signal line should not be misinterpreted as a tear in the anterior horn of the lateral meniscus. Review of sequential sagittal sections allows the distinction since the transverse ligament is identified passing medially to its insertion on the medial meniscus. Likewise, the anterior meniscofemoral ligament can mimic a tear where it inserts at the posterior horn of the lateral meniscus (118). In particular, it may be mistaken for a ‘bucket handle’ tear with a fragment dislodged into the intercondylar space (Fig. 7.7). Fig. 7.5 Schematic drawing showing the sagittal MR visualization of the meniscus in relationship to the sagittal plane. Fig. 7.6 High signal zone at the junction of the transverse ligament with the anterior horn of the lateral meniscus. Fig. 7.7 Sagittal topography of the anterior (1) and posterior (2) meniscofemoral ligaments relative to the posterior cruciate ligaments visualized in cross section. The tendon sheath of the popliteus tendon is seen as a vertically or slightly obliquely oriented zone of high signal intensity, posteriorly bordering the posterior horn of the lateral meniscus. Unfamiliarity with this situation can lead to the misinterpretation of a vertical tear of the posterior horn of the lateral meniscus or a meniscocapsular separation. Finally, it should be remembered that the pars intermedia of the lateral meniscus is not attached to the lateral collateral ligament to avoid interpreting a signal void zone between the lateral meniscus and ligament as a meniscocapsular separation. The sagittal sections delineate the anterior cruciate ligament in its entire length as long as the knee is 15 – 20 degrees externally rotated. Paracoronal sections angled on the basis of the course of the ligament identified on the sagittal sections are often a useful addition since they can demonstrate the femoral origin of the ligament. The anterior cruciate ligament is depicted as signal-void band, which can exhibit signal intensity, especially in the tibial region because of fatty tissue interposed between individual fiber fascicles. The magic angle phenomenon can also be responsible for higher signal intensities. The posterior cruciate ligament has a homogeneously low signal intensity and is easily identified on sagittal sections. It displays a superoposterior convexity. The medial collateral ligament is seen in its entirety on the midcoronal sections. It exhibits a low signal intensity on all pulse sequences, distinguishing a superficial and deep ligamentous layer. The superficial layer extends from the medial femoral epicondyle to the inner aspect of the tibial metaphysis, 7.5 – 10 cm distal to the joint space. The deep layer of the medial collateral ligament represents an enforcement of the joint capsule and is separated anteriorly from the superficial layer. It is clearly shorter than the superficial layer and extends from the distal aspect of the medial femoral epicondyle to the proximal tibia. It sends fibrous connections to the medial collateral ligament. The deep layer of the medial collateral ligament is not discernible in normal cases. Fatty tissue is usually deposited between superficial and deep layers of the medial collateral ligament. MRI shows the normal patellar tendon as a straight structure that exhibits a signal void on all sequences (24). Its average AP diameter is 5 mm. With advancing age and increased body weight the patellar tendon may develop an undulating appearance. This has been found to be the case in 71% of asymptomatic patients (Fig. 7.8). Fig. 7.8 Marked undulation of the patellar tendon in an asymptomatic female patient without any history of trauma to the knee. Schweitzer and co-workers (102) found discrete, V-shaped foci of increased signal intensity in the patellar tendon, located in the proximal end of the tendon in 82% of the cases and in the distal end in 32%. These foci show no further signal increase on the T2-weighted image in comparison with the proton density-weighted images. It is undetermined whether these high signal foci reflect a clinically undetectable tendon degeneration or the complex internal structure of the patellar tendon. A variety of pulse sequences have been recommended for visualizing the hyaline articular cartilage (69, 92, 116). Exact anatomic correlations have revealed that fat-suppressed T1-weighted 3-D-GRE sequences can determine cartilage thickness and volume reliably and reproducibly (31, 33, 34). Using this technique in patients, loss of cartilage and surface alterations can be reliably detected (108). In contrast, heavily T2-weighted TSE sequences are better able to diagnose structural changes in the hyaline cartilage. Furthermore, magnetization transfer contrast (MTC) and MTC subtraction have been shown to be useful for depicting superficial cartilage defects and intracartilaginous lesions (123). The hyaline articular cartilage has an intermediate signal intensity on the T1-weighted SE images. The basal calcified cartilage layers cannot be distinguished from the subchondral bone. On the T2-weighted images, the hyaline articular cartilage has low signal intensity. The display of the image contrast is variable on the GRE sequences and depends on the examination parameters. Intermediate flip angles (20 – 40 degrees) are usually recommended for visualization of the hyaline articular cartilage. In the presence of a joint effusion, heavily T2-weighted sequences create an ‘arthrographic effect,’ which can be used diagnostically to demonstrate superficial lesions of the articular cartilage. The amount of joint fluid within the knee is variable and can increase after physiologic stress or athletic activities. A joint effusion should be diagnosed only when visible fluid accumulation in the suprapatellar recess or posterior to the cruciate ligaments (posterior recess) exceeds 10 mm in width on sagittal MR images (42). Acute traumatic changes of the menisci result from forced rotation applied to the flexed knee, with resultant longitudinal (bucket handle) or transverse (radial) tears (Fig. 7.9). Longitudinal tears follow the dominating longitudinal arrangement of the peripheral fibers. Transverse and small tears (fibrillations) occur more frequently centrally or at the inner free edge since here the transverse fibers dominate. Degenerative changes of the meniscus cause loss of elasticity of the collagenous fibers, predisposing them to tears when subjected to trauma. Characteristically, these tears are horizontal or oblique and arise from the inferior meniscal surface. Fig. 7.9 Schematic drawing of types of meniscal tears (after Jäger and Wirth): I: Small longitudinal tear II: Vertical tear III: Large longitudinal tear and large longitudinal tear with partial (IIIa) and total (IIIe) displacement of the medial fragment (bucket-handle tear) IIIb-IIId: Complex tears with displaced fragments IV: Horizontal tear at the superior and inferior surface (fish-mouth tear) Fish-mouth tears are usually degenerative in nature and only detectable arthroscopically by probing the meniscal surface. Individual tears can be the beginning of other types of tears (arrows).
Introduction
Examination Technique
 Patient Positioning and Coil Selection
 Sequences
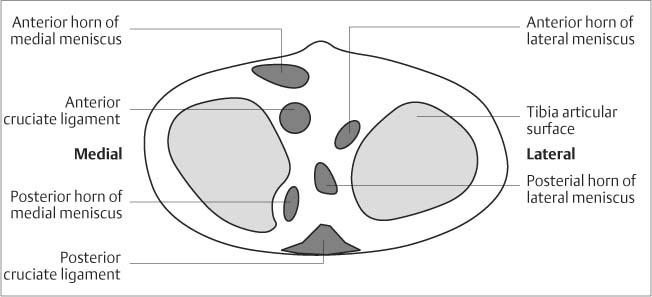
Anatomy
 General Anatomy
 Specific MR Anatomy
Meniscal Lesions
 Degenerative Changes and Tears
Grade | MRI | Histology |
0 | Triangular signal void, possible increased signal | Normal meniscus |
I | One or several punctate or globular increased signals not extending to the articular surface | Mucinous degeneration, magic angle artifact |
II | Linear increased signal not extending to the articular surface | Extensive mucinous degeneration or intrameniscal tear |
III | Linear increased signal extending to one or both articular surfaces | Tear |
IV | Several areas of increased signal as well as deformity and fragmentation | Complex Tear |
Several studies comparing the increased signal intensity within the menisci with the pathologic specimen (112) have revealed a correlation between signal pattern and histologic findings (Fig. 7.10). Classification of the meniscal signal pattern is based on the findings seen on the T1-weighted and proton density weighted sequences (Tab. 7.1)
In children and adolescents, the central meniscal regions are markedly more vascularized than in adults. Increased signal intensities in these age groups do not have the same meaning as in adults.
Serial examinations have shown that grade II lesions remain stable in the majority of cases and rarely progress to tears or regress (29).
From the visualization of the meniscal tears in the sagittal and coronal planes, the extent and configuration of the tear can be deduced. The pattern of the tear should be described as accurately as possible since this information might be relevant to the therapeutic approach (Tab. 7.2). Very thin transverse sections depict the extent of the tears well (Fig. 7.11). However, ultra-thin sections are not generally required for diagnostic evaluation of the menisci.
Bucket-handle tears result from a vertical or oblique tear that extends along the entire length of the meniscus. The medial segment becomes displaced into the intercondylar space. This medial fragment can be identified in the region of the intercondylar space on contiguous coronal sections.
Vertical tears | Horizontal tears | Complex tears |
Vertical tear | Horizontal cleft | Combination of variable tears (Figs. 7.16 and 7.18) |
Peripheral tear | Radial tear | Rounded fragments |
Capsulomeniscal separation | Oblique tear (Figs. 7.14 and 7.15) |
|
Bucket handle tear | Parrot beak tear (Fig. 7.17) |
|
Bucket-handle tears (Fig. 7.12) can display the following signs on MRI:
• double posterior cruciate ligament sign (Fig. 7.13),
• flipped meniscus sign,
• detection of a fragment in the intercondylar space (130, 132)
The ‘double posterior cruciate ligament’ sign refers to the visualization of the medially displaced meniscus segment as a low signal band parallel to and under the posterior cruciate ligament on the sagittal sections. The flipped meniscal sign describes the visualization of the fragment immediately posterior to the anterior horn, resulting in an apparent magnification of the anterior horn. Bucket-handle tears involve the medial meniscus considerably more frequently than the lateral meniscus. Of course, small fragments of a bucket-handle tear are more difficult to identify than larger fragments.
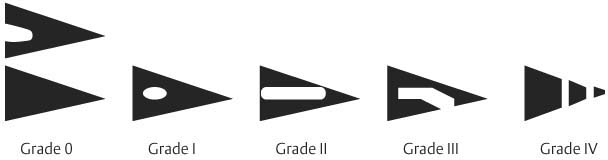
Fig. 7.10 Classification of signal alterations in the meniscus (modified after 72).
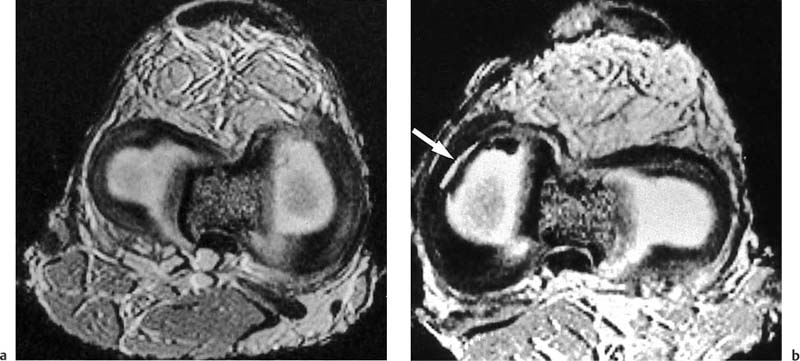
Fig. 7.11 a, b Axial visualization of the meniscus of an anatomic specimen using GRE sequence (TR = 30 msec, TE = 9 msec, flip angle 25 degrees, section thickness 0.7 mm, resolution 0.5 mm). a Normal finding. b Athrotomically created longitudinal tear (arrow).
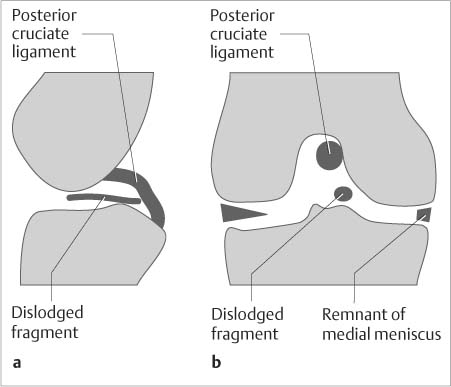
Fig. 7.12 a, b Schematic drawings of the MRI findings of the bucket-handle tear of the medial meniscus. a Sagittal plane. b Coronal plane.
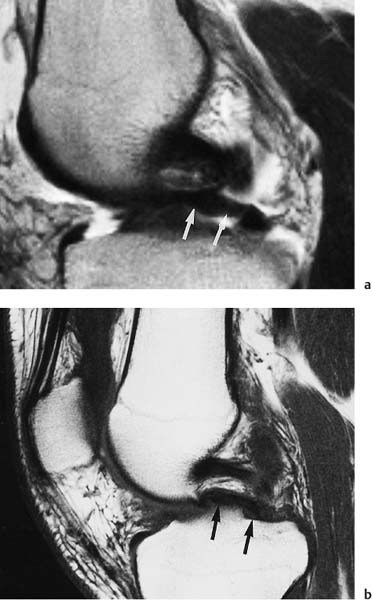
Fig. 7.13 a, b Sagittal T1-weighted and T2-weighted SE sequence, showing the ‘double posterior cruciate ligament sign’ of a bucket-handle tear of the medial meniscus. A band-like structure is seen parallel to and beneath the course of the posterior cruciate ligaments (arrow) corresponding to the medially displaced bucket-handle fragment of the meniscus.
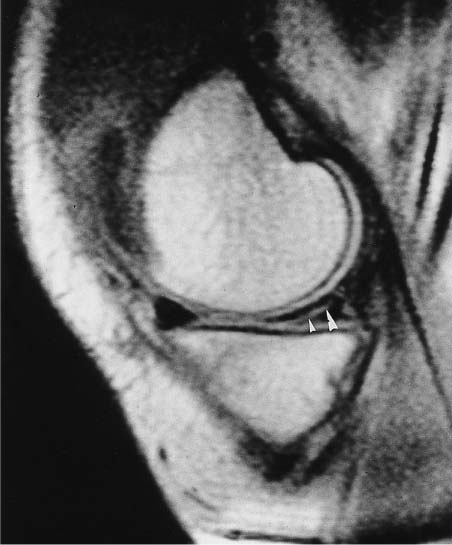
Fig. 7.14 Oblique tear in the posterior horn of the medial meniscus. Sagittal T1-weighted SE sequence. Examination performed with an 0.2 Tesla MR system. The obliquely oriented linear zone of increased signal intensity (arrowhead) extends to the undersurface of the meniscus.
Peripheral vertical tears can be sutured since this region of the meniscus is vascularized (‘red zone’), while this approach has little success if applied to the inner avascular (‘white’) zone.
Normally, no fluid is detectable between the medial meniscus and the joint capsule. In cases of meniscal capsular separation, the meniscus itself is unremarkably visualized, though fluid is seen between meniscus and joint capsule.
Aside from direct evidence of a tear as linear increase in signal intensity with extension to the meniscal surface, the interpretation of the MRI examination must also consider morphologic changes without associated signal alterations, such as shortening and rounding of the triangular cross section or failed visualization in the normal anatomic position. On sagittal sections, the normal posterior horn of the medial meniscus is clearly larger than the anterior horn. Loss of this difference suggests a bucket-handle tear. The coronal sections show the body of both menisci to be about equal in size. A high diagnostic accuracy can be achieved by using signal alterations of Type III as well as the morphologic changes mentioned previously as criteria for diagnosing meniscal tears (Tab. 7.3). The accuracy increases with confirmation of the tear on a second plane and its visualization on more than one section of the same imaging plane.
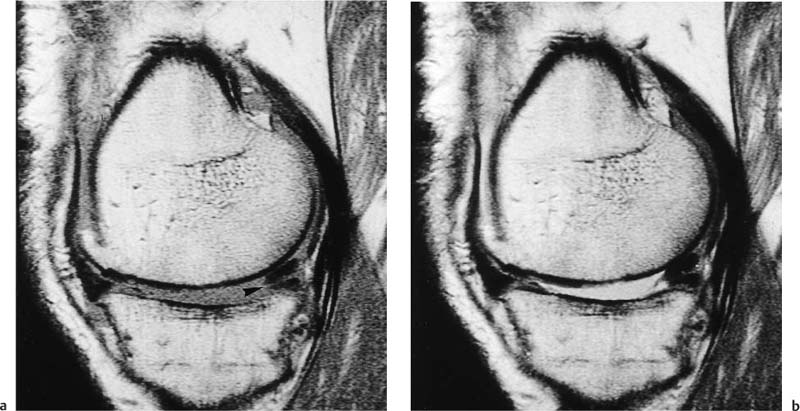
Fig. 7.15 a, b Posterior horn of the medial meniscus with horizontal tear (arrowhead) and shortening. a Sagittal T1-weighted SE image. b Sagittal T2-weighted SE image.
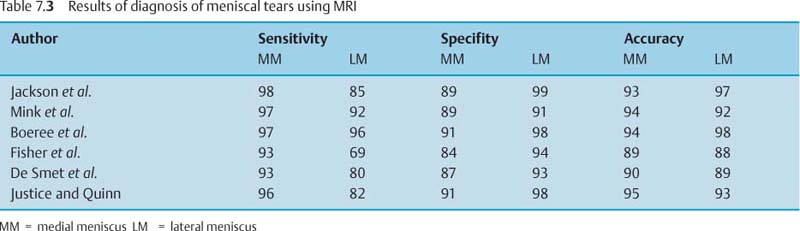
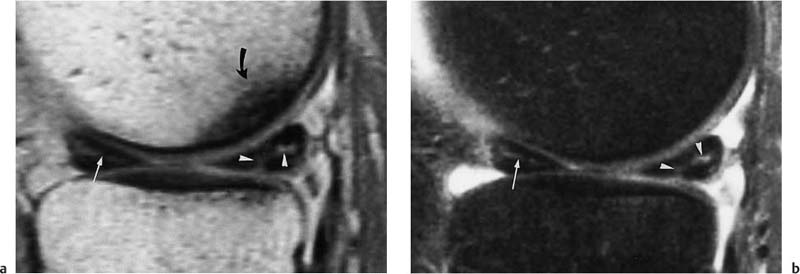
Fig. 7.16 a, b Grade III lesion of the posterior horn of the medial meniscus and grade II lesion of the anterior horn. a Sagittal T1-weighted SE sequence. b Sagittal T2-weighted SE sequence with fat saturation. Branching increased signal intensity with extension to the surface in the posterior horn of the medial meniscus (arrow-heads). Linear increase in signal intensity with extension to the surface in the anterior horn (arrow). Subchondral decrease in signal intensity in medial femoral condyle due to osteoarthritis.
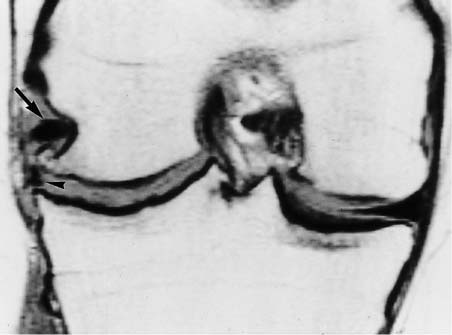
Fig. 7.17 Osteoarthritis of the lateral femorotibial compartment with tear near the base of the lateral meniscus (arrow-head) and displaced fragment in the superior recess (arrow).
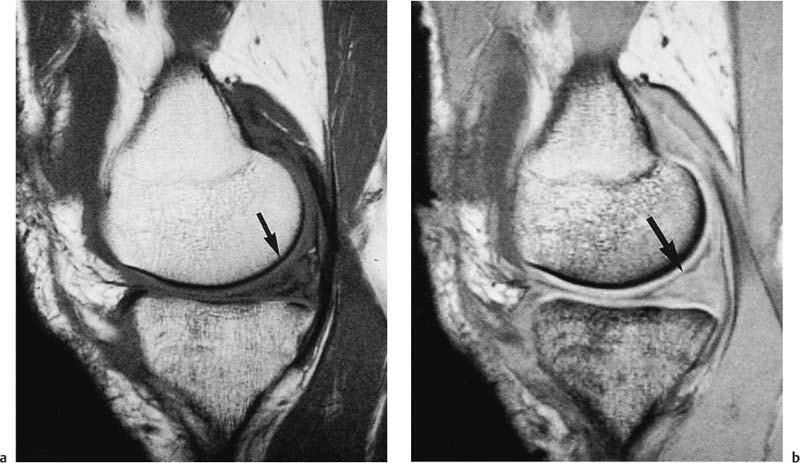
Fig. 7.18 a, b Complex tear of the medial meniscus following severe trauma to the knee. a Sagittal T1-weighted SE sequence. b Sagittal 2-D FLASH sequence. Fragmentation and complete destruction with hemorrhage of the posterior horn of the medial meniscus (arrow).
Conventionally, arthroscopy is used as the standard reference for assessing the precision of MRI, but arthroscopy is an imperfect ‘gold standard’ with its stated accuracy of 70 – 98%. In particular, tears of the peripheral meniscus and tears under the surface of the posterior horn of the medial meniscus can escape detection (86). Tolin and Sapega (113) point out that the complete arthroscopy of the posterior horn of the medial meniscus should include a posterior portal in addition to the arthroscopic standard anterior portal.
Possible semantic differences between the descriptive terminology of MRI and arthroscopy may also add to the discrepancies between the technologies. For instance, a free edge abnormality may be described as fraying by the arthroscopist and as small tear by the radiologist (55).
Other causes of false positive MRI interpretations are:
• Vacuum phenomenon,
• Magic angle phenomenon in the lateral meniscus,
• Anatomic variants.
For tears of the lateral meniscus, false negative interpretations outnumber false positive ones, while errors of interpretation are evenly divided between false negatives and false positives for the medial meniscus.
To improve the results of MRI even further, several refinements and improvements of the examination technique have been recommended, such as the intravenous (124, 131) and intra-articular (4) application of paramagnetic contrast medium or three-dimensional reconstruction of 2-D MR data (30). In particular, axial 3-D GRASS T2*-weighted images showed a high sensitivity in the diagnosis of radial meniscal tears (5, 70). Radial MRI imaging (87) was found to be statistically equal to sagittal spin-echo imaging in the evaluation of meniscal abnormalities.
 Postsurgical Changes
Meniscal operations include meniscal suture, partial re-section and meniscectomy. In general, solely peripheral tears are sutured since healing with ingrowth of granulation tissue can be expected in this location. Long-term grade III signal changes can persist, following conservative therapy and meniscal suture, even in asymptomatic patients. Only if additional changes suspicious for a tear are identified on follow-up examination, a recurrent tear should be considered. Signal changes in terms of a grade III tear are indistinguishable from a healing process with granulation and scar tissue and a renewed tear. New complaints also raise the possibility of a fresh tear at a different site.
Following partial resection of the meniscus, anarea of central increase in signal intensity without extenion to the surface (type II signal) might be noted at the re-section margin. Following surgery it will appear as type III signal change extending to the meniscal surface. However, it should not be interpreted as a new tear since it represents meniscal degeneration that was present preoperatively.
Frequently, the MR image only reveals a discrete deformity along the meniscal margin following partial resection (Fig. 7.19). Without knowledge of any previous surgery, these postsurgical findings are easily overlooked. Intra-articular administration of contrast medium can be useful in diagnosing a new meniscal tear after partial resection or meniscal suture (4). Whether indirect MR arthrography is clinically useful in diagnosing recurrent tears remains to be investigated further.
Following total meniscectomy, the meniscus is no longer visualized at its typical location. Cartilaginous calcifications or the vacuum phenomenon, whether as part of pre-existing osteoarthritis or a gradually progressing post-operative osteoarthritis, can be visualized as signal void and as such might be mistaken for meniscal remnants or post-operatively developing free intraarticular bodies. The post-operative development of osteoarthritis is characterized by progression of osteoarthritic signs, such as cartilaginous lesions, osteophytes, subchondral cysts, and sclerosis.
As with all surgical interventions, open meniscectomies have corresponding skin changes and can have susceptibility artifacts caused by metallic and osseous chips left behind.
 Discoid and Ring Meniscus
Discoid menisci are morphologic variants caused by the persistence of central portions of the meniscal disks after the fetal period. Complete and incomplete forms as well as a rare ring form can be distinguished. The prevalence is about 3% for the lateral meniscus and 0.1 – 0.3% for the medial meniscus.
A discoid meniscus may lead to a loud snapping sound heard with flexion or extension of the knee. Otherwise, the discoid meniscus is asymptomatic. Discoid menisci, however, are susceptible to premature degeneration and tears and become symptomatic at that point.
MRI generally can diagnose a discoid meniscus unequivocally, when the characteristic deviations from the normal morphologic findings are displayed. A height differential of 2 mm is evident also between discoid menisci and normal menisci of the same knee (106).
 Meniscal Cysts and Parameniscal Cysts
Parameniscal cysts are fluid accumulations in the region of the meniscal capsular interface. They are generally associated with horizontal or complex meniscal tears (Fig. 7.20). In contrast, meniscal ganglion cysts are not necessarily associated with a damaged meniscus. Medial meniscal cysts are frequently eccentric, because of the meniscal attachment along the medial collateral ligaments, and larger than lateral cysts. This means that they are not at the immediate level of the underlying tear. Meniscal cysts have a high recurrence rate following resection. MRI shows meniscal cysts and ganglion cysts with fluid-equivalent signal intensities. Parameniscal cysts often display a stalk toward the meniscus. Meniscal ganglion cysts, in contrast, are not connected with the articular cavity.
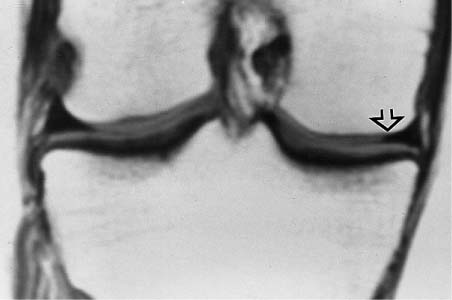
Fig. 7.19 S/P partial resection of the medial meniscus. Coronal T1-weighted SE image. The medial meniscus border is blunted (arrow).
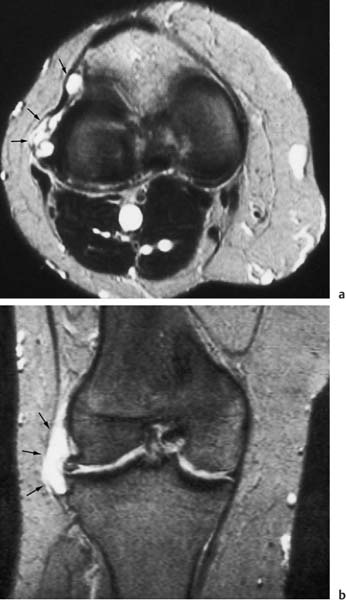
Fig. 7.20 a, b Parameniscal cysts, arising from a markedly deformed and hyperintense lateral meniscus and protruding in a lobular fashion beneath the collateral ligament and the patellar retinaculum. High signal intensity of the parameniscal cyst (arrow) on a axial and b coronal T2-weighted SE images.
Injuries of the Cruciate Ligaments
Anterior cruciate ligament. Tears of the anterior cruciate ligament (ACL) are frequently accompanied by tears of the medial collateral ligament and injuries to the joint capsule. Isolated tears of the ACL are rare. The accuracy of clinical diagnosis is stated to be relatively high (sensitivity: 75 – 95%, specificity 95 – 100%). Lee and Yao (68) reported a sensitivity of 87% and a specificity of 89% for clinical tests. In acute injuries, the clinical examination can be markedly compromised (51).
MRI can diagnose tears of the ACL by applying direct and indirect criteria. The constellation of findings depends on the nature of the tear, whether it is acute or chronic, partial or complete (Fig. 7.21).
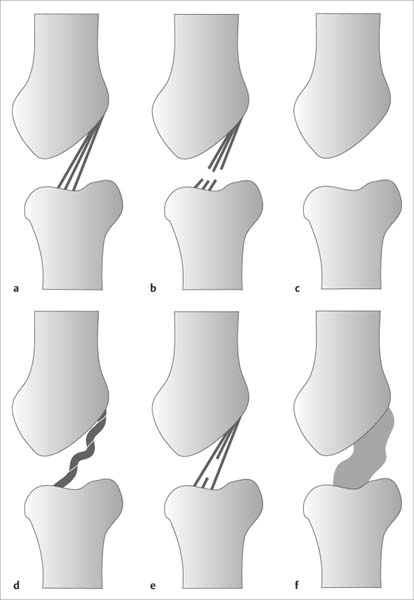
Fig. 7.21 a–f Schematic drawing of abnormalities of the anterior cruciate ligament. a Normal. b Gap in the ligament. c Absent delineation in expected anatomic position. d Tortuous course with focally increased signal intensity. e Focally increased signal intensity. f Thickening and diffuse increase in signal intensity.
The direct signs of a tear of the ACL are discontinuity or absence of the ligament in its anatomic position in the lateral intercondylar space (Fig. 7.22 and 7.23), wavy or irregular contour of the ligament, and displacement of the tibial and femoral ligamentous components. Frequently, the tibial remnant of the ligament assumes an almost horizontal position. In acute injuries, the T2- weighted image shows a diffuse or focal increase in signal intensity within and around the ligament, as well as an indistinct outline and thickening of the ligament (Fig. 7.24) (119). The direct signs of the tear have a stated sensitivity of 93% and specificity of 97% (3, 68, 91, 94, 126). Fat saturated T2-weighted and STIR sequences show these changes with an exquisite contrast. As manifestation of an associated capsular injury, increased signal intensity might be observed in the soft tissues posterior to the articular cavity.
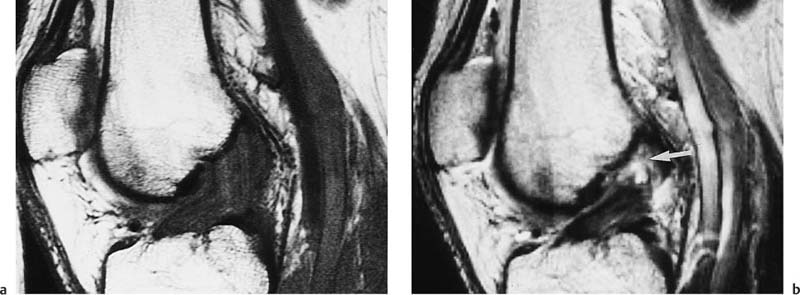
Fig. 7.22 a, b Anterior cruciate ligament tear in a 49-year-old female patient. a Sagittal T1-weighted SE sequence. b Sagittal T2-weighted SE sequence.
Tear of the anterior cruciate ligament close to the femoral attachment. The tibial remnant has assumed a flattened course. In particular, a definite increase in signal intensity (arrow) is seen in the tear adjacent to the femur on the T2-weighted image. The T1-weighted image shows a low signal structure throughout the intercondylar space and posterior joint capsule, barely discernible from ligamentous remnants.
The indirect signs of a tear of the ACL include the increased angulation or buckling of the posterior cruciate ligament (Figs. 7.25–7.27) and the ‘uncovered lateral meniscus’ sign due to the posterior displacement of the lateral meniscus relative to the posterior cortical margin of the tibial plateau. These changes reflect anterior instability and essentially are based on the anterior displacement of the tibial plateau compared with the femoral condyles (114). A distance of more than 5 mm between the vertical lines drawn tangentially to the posterior cortical margins of the lateral femoral condyle and tibial plateau suggests a complete tear of the ACL (Figs. 7.28 and 7.29).
In acute injuries of the ACL, subchondral bone bruises are frequently observed in the mid portion of the lateral femoral condyle and in the posterolateral portion of the tibial plateau (Fig. 7.30) (56 a, 20 a). They are caused by transient subluxation and impaction of the medial portion of the lateral femoral condyle on the posterolateral tibial plateau. Aside from subchondral bone bruises, osteochondral and chondral compression fractures can occur in the lateral femoral condyle. Subchondral bone bruises are exquisitely displayed on fat saturated T2-weighted SE images and on STIR images (98). Occasionally, a focal bone bruise can also be detected next to the attachment of the anterior cruciate ligament (Tab. 7.4).
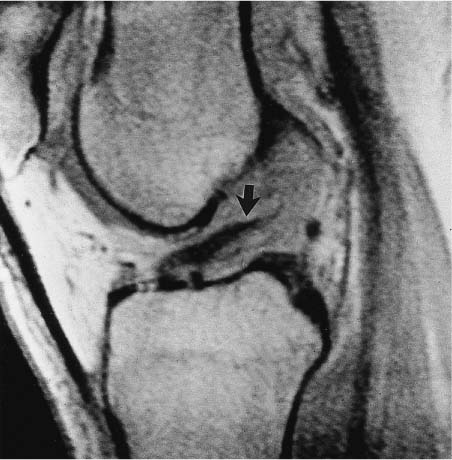
Fig. 7.23 Anterior cruciate ligament tear. Sagittal T1- weighted SE sequence obtained with a 0.2 Tesla MRI system dedicated for imaging extremities. The tibial remnant of the anterior cruciate ligament is displaced inferiorly (arrow). Relatively low signal intensity next to the femoral attachment of ligaments in the posterior aspects of the joint capsule of the knee.
With tears of the ACL, the patellar tendon may exhibit focal areas of increased signal intensity, more frequently localized in its tibial than patellar aspect.
In the majority of cases, direct signs can establish the diagnosis of a tear of the anterior cruciate ligament.
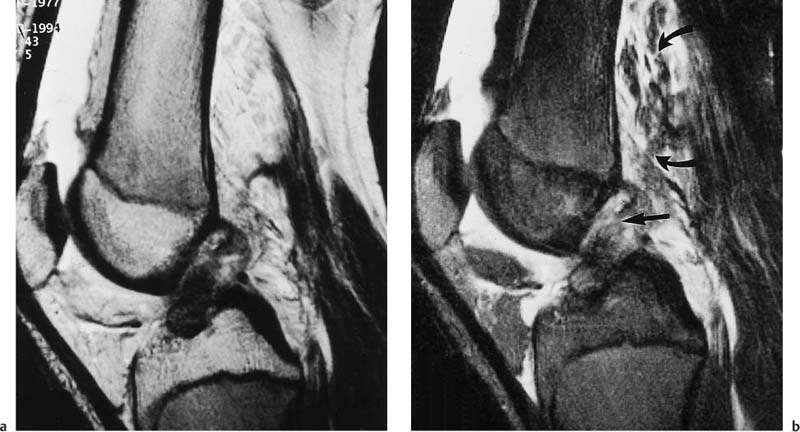
Fig. 7.24 a, b Severe knee trauma in a 17-year-old patient with complex internal derangement of the knee. a T2-weighted TSE sequence. b T2-weighted TSE sequence with fat saturation. Extensive effusion in the knee joint and suprapatellar recess. Fluid accumulation in the soft tissues posterior to the popliteal fossa and the distal femora (curved arrows) as evidence of a capsular lesion. Acute tear of the anterior cruciate ligament with swelling, irregular outline, and heterogeneous signal. In particular, the femoral aspect of the ligament shows a definite increase in signal intensity and a gap in the ligamentous structures (arrow). The heterogeneity of the signal distribution in the anterior cruciate ligaments is most conspicuous on the fat saturated image.
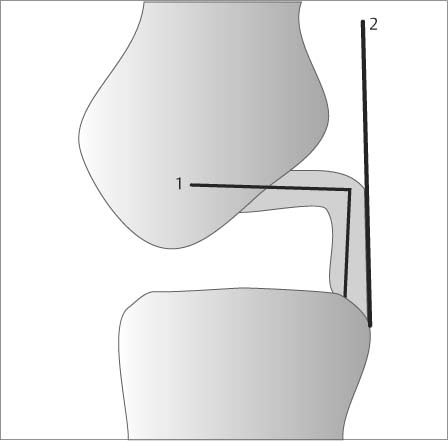
Fig. 7.25 Changes in the posterior cruciate ligament as indirect sign of a tear of the anterior cruciate ligament.
1 = Reduced angle of the posterior cruciate ligament (normal: about 123 degrees; with a tear of the anterior cruciate ligament: about 106 degrees).
2 = The posterior cruciate ligament line does not transect the distal femur (within the distal 5 cm).
Indirect signs are rarely taken as exclusive evidence of a torn anterior cruciate ligament, but are valuable confirmation of the diagnosis and increase the level of confidence. Robertson and co-workers (98) analyzed a total of 22 different MRI signs of tear of the anterior cruciate ligament and gave the following signs the highest predictive value (in decreasing order):
• Disruption of the anterior cruciate ligament,
• Disruption of individual fascicles,
• Bone bruise in the posterolateral tibial plateau,
• Buckled posterior cruciate ligament,
• Failure of the posterior cruciate ligament line to intersect the distal femur within 5 mm
Aside from sagittal sections with external rotation of the leg, oblique coronal sections parallel to the ACL are helpful, in particular if other findings are inconclusive and a partial tear is suspected (Fig. 7.32) (49). Close to the femoral origin of the ACL, a partial volume effect can cause false positive or false negative findings on the sagittal sections, requiring further evaluation with oblique coronal sections. Axial sections may also be useful in the evaluation of the ACL particularly at its insertion into the lateral femoral condyle. Here it is normally well seen on axial sections and its absence (the so-called ‘empty notch sign’) is suggestive of an ACL tear.
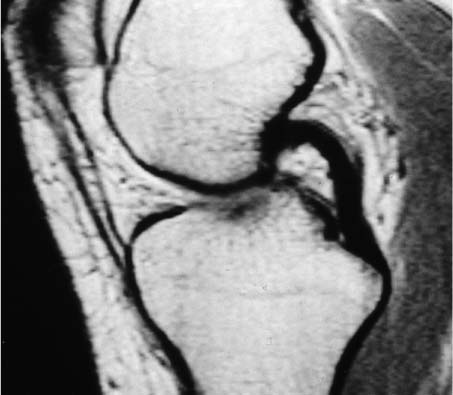
Fig. 7.26 Rupture of the anterior cruciate ligament. Moderately increased angulation of the posterior cruciate ligament.
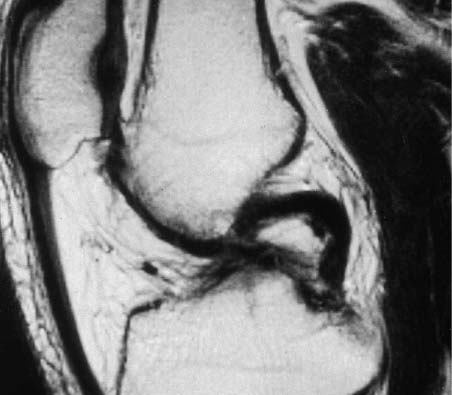
Fig. 7.27 Rupture of the anterior cruciate ligament. Marked angulation of the posterior cruciate ligament.
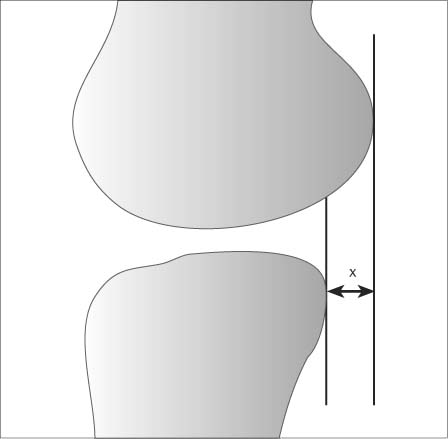
Fig. 7.28 Interior displacement of the tibial plateau as indirect sign of a rupture of the anterior cruciate ligament (x < 5 mm favors a tear).
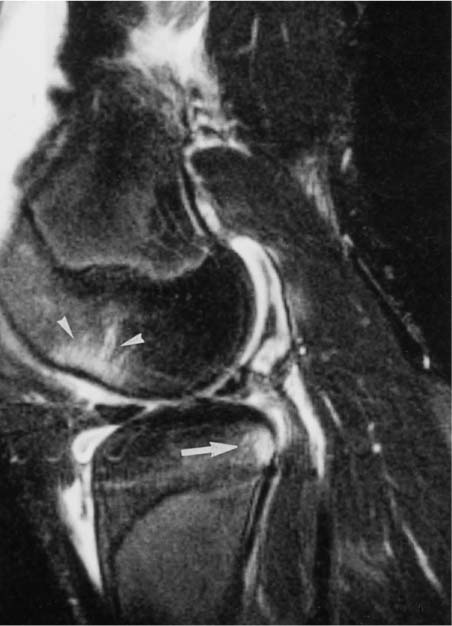
Fig. 7.30 Patient with a tear of the anterior cruciate ligament. Sagittal T2-weighted SE sequence with fat saturation. The section through the lateral femoral condyle shows bone bruises in the medial aspect of the femoral condyle (arrowhead), as well as in the dorsal aspect of the tibial plateau (arrow), considered an indirect sign of a tear of the anterior cruciate ligament.
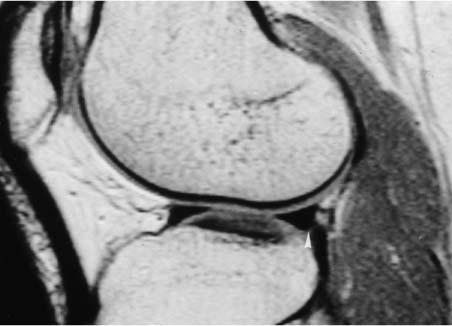
Fig. 7.29 Tear of the anterior cruciate ligament. Posterior displacement of the posterior horn of the lateral meniscus (arrow-head).
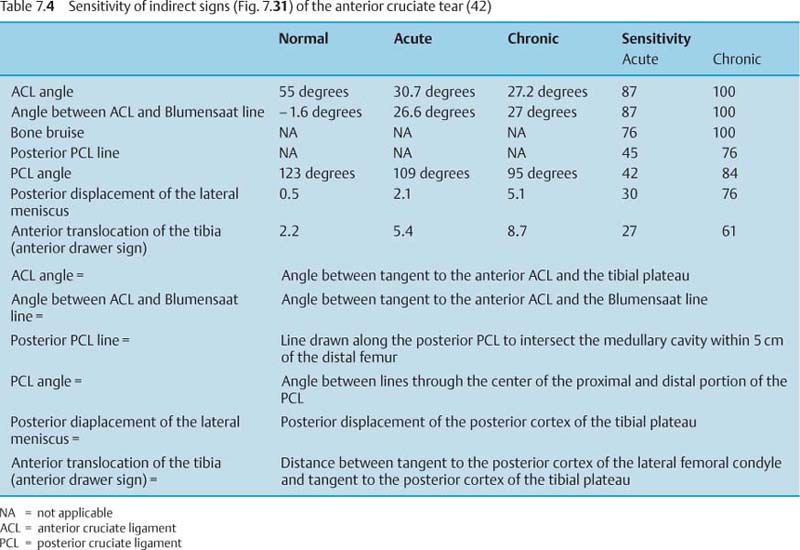
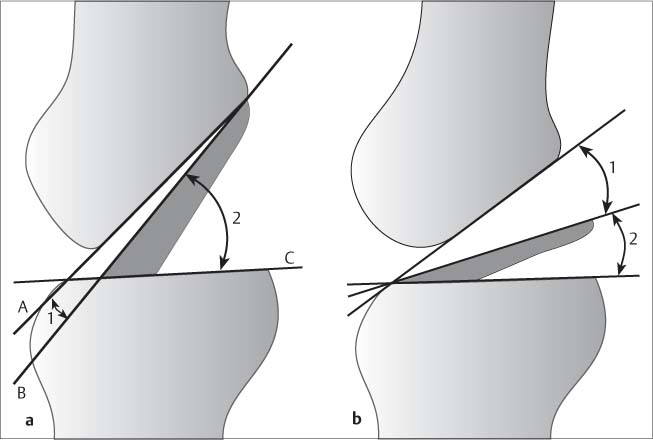
Fig. 7.31 a, b Indirect signs of a tear of the anterior cruciate ligament. a
A = Tangent to the Blumensaat line
B = Tangent to the anterior contour of the anterior cruciate ligament
C = Tangent to the contour of the tibial plateau
1 = Angle between anterior cruciate ligament and Blumensaat line
2 = Anterior cruciate ligament
b Tear of the anterior cruciate ligament
1 = The angle between the anterior cruciate ligament and the Blumensaat line normally measures about 1.6 degrees; with an anterior ligament tear it is positive and measures > 26 degrees.
2 = The anterior cruciate ligament angle, which normally measures about 55 degrees, is markedly reduced to about 30 degrees.
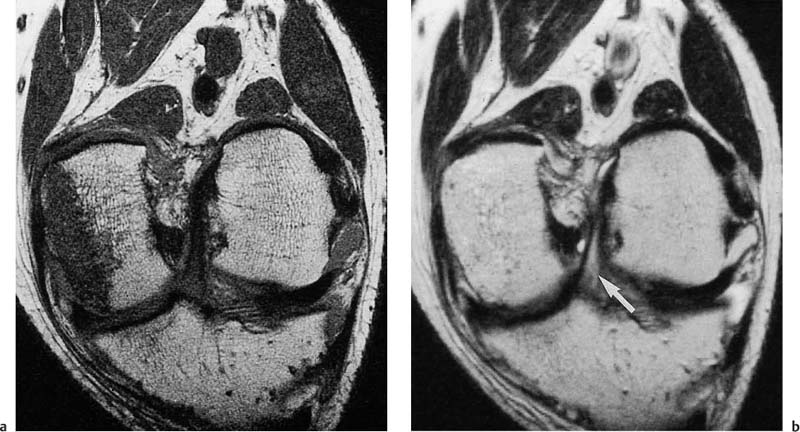
Fig. 7.32 a, b Partial tear of the anterior cruciate ligament. Oblique coronal sections parallel to the course of the anterior cruciate ligament. a T1-weighted SE sequence. b T2-weighted SE sequence.
The T1-weighted image shows an extensive bone contusion with decreased signal intensity in the region of the medial femoral condyle. This bone marrow contusion is not seen on the T2-weighted image. Increased signal intensity, especially in the tibial aspect of the anterior cruciate ligament, is best appreciated on the T2-weighted sequence (arrow). The continuity of the ligament is preserved.
Detecting a partial tear of the ACL is clinically relevant since partial tears can progress to a complete tear and predispose to subsequent knee instability. These severe sequelae can be avoided through early surgical intervention (101).
On MRI, partial tears of the ACL are characterized by the following findings (117):
• Increased intrasubstance signal intensity with definable intact ligamentous fibers in continuity between femoral and tibial attachments,
• Bowing and undulating contour of the otherwise intact anterior cruciate ligament,
• Nonvisualization of the anterior cruciate ligament on the T1-weighted image with concomitant discernible intact fibers seen on either STIR or GRE image,
Related posts:

Stay updated, free articles. Join our Telegram channel

Full access? Get Clinical Tree


