Fig. 1.
Arcturus XT software for microdissection. (a) The Arcturus XT instrument operates via a series of software tool panes and option buttons. Each step of the microdissection process can be accessed from the main software screen. Mouse bony ear tissue is shown at ×2 magnification in the live image, and an overview of the tissue slide is shown below. The overview image allows the operator to navigate across the slide and/or tissue section. (b) Properly melted spots have a dark outer ring and a clear center, indicating that the polymer has melted and is in direct contact with the slide. Inadequate power and/or duration settings create spots with a hazy appearance, lacking a distinct black ring (live image shown as ×60 magnification). The spot size can be measured to match the microdissection area to the cell size.
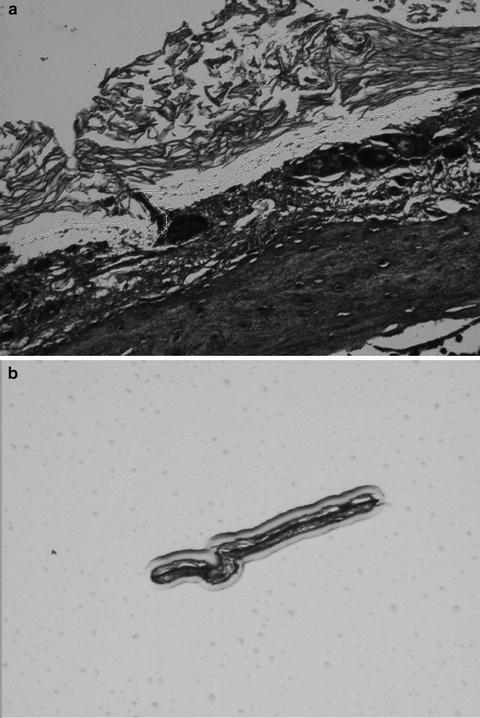
Fig. 2.
Arcturus XT Infrared Laser Capture Microdissection (LCM) process. (a) A section of mouse inner ear tissue is mounted and stained on a glass slide and viewed under high magnification (×40) to locate the ciliated epithelium. The ciliated epithelium is identified visually and designated for microdissection using software annotation tools at ×2, ×10, ×40, or ×60 magnification. The infrared laser locally expands a thermoplastic polymer that captures the cell(s) only in the vicinity of the laser pulse. (b) Microdissection occurs when the film is lifted from the tissue section, shearing the selected cells from the tissue section. The presence of stained material inside the margins of the melted polymer indicates effective microdissection (×10).
Ultraviolet lasers in both the Arcturus XT ™ and the mmi CellCut Plus® instrument photovolatilize cells and/or the mounting medium, typically a polyethylene napthalate (PEN) membrane. In UV cutting mode, a microdissection cap is placed on the surface of the tissue, encompassing the area of photovolatilization, and the infrared laser melts the thermolabile polymer in several defined areas around the edge of the cut area, thus holding the cut area of tissue/membrane in place. The mmi CellCut Plus® instrument uses an adhesive membrane mounted on the lid of a collection tube to secure the microdissected cells/membrane during microdissection. Following microdissection, extraction buffer may be applied directly to the polymer film for solubilizing the cells, allowing the collection of nucleic acids or protein for downstream analysis.
Tissue preservation methods should be taken into consideration when planning LCM and downstream analyses. Although LCM is compatible with frozen, fixed, or paraffin-embedded specimens, tissue preservation methods vary greatly in their ability to preserve nucleic acids, proteins, and posttranslational modifications of proteins (22–24). Pre-analytical variability originating from tissue procurement and preservation may cause significant variability and bias in downstream molecular analysis. Depending on the ex vivo delay time in tissue processing, and the manner of tissue handling, nucleic acids, proteins, and phosphoproteins will be elevated or suppressed in a manner that does not represent the molecule at the time of excision. Consequently, molecular profiling requires stabilization, or preservation, of the molecules of interest immediately post tissue procurement. Proteins can be extracted with variable yield from formalin fixed tissue (25). The yield depends on the time, chemistry of formalin fixation, and the tissue geometry and density. Formalin penetrates tissue at a variable rate, reported to be within the range of millimeter per hour (26–28). During this time, the portion of the living tissue deeper than several millimeters would be expected to undergo significant fluctuations with regard to phosphoprotein analytes. The preferred specimen for protein and RNA analysis is frozen tissue because formaldehyde becomes hydrated in aqueous solutions, forming methylene glycol (26, 28). Methylene glycol readily penetrates tissue, yet it is the small percentage of carbonyl formaldehyde that covalently cross-links proteins and nucleic acids, resulting in tissue fixation (26, 28). Formalin cross-linking, the formation of methylene bridges between amide groups of protein, blocks analyte epitopes thereby decreasing the yield of proteins extracted from the tissue.
Desirable aspects of tissue preservation are (a) preservation of nucleic acids, proteins and protein post-translational modifications such as phosphorylation state, (b) maintenance of nuclear size and morphology, (c) functional at room temperature, (d) one-step system, and (e) compatible with standard paraffin embedding and processing. We have developed a fixative for protein and phosphoprotein preservation that meets these criteria (Fig. 3) (22, 23, 29).
This chapter presents microdissection of frozen tissue sections for proteomic analysis as an illustration of the operation of the Arcturus XT ™ in both capture and cutting modes, and microdissection of formalin-fixed paraffin-embedded (FFPE) tissue section on an mmi CellCut Plus® instrument for RNA analysis via NanoString technology (30).
2 Materials
Tissue for microdissection is usually prepared as a cryosection, or a paraffin-embedded section, on a glass or PEN (polyethylene napthalate) membrane, or PET (polyethylene terephthalate) slide. The tissue section is stained for histomorphologic identification of cells. The stained section is used immediately for LCM, or stored in a desiccator, depending on the tissue and molecular analysis type.
2.1 Preparation of Tissue Sections for Arcturus XT Infrared Capture Mode
1.
Uncharged, pre-cleaned glass microscope slides, 25 × 75 mm.
2.
Optimal cutting temperature cryopreservation solution (Tissue-Tek® O.C.T.™) (Sakura Finetek) for embedding frozen tissue sections.
3.
Cryomolds.
4.
Specimen for protein analysis: frozen tissue or ethanol-fixed tissue sections cut at 2–15 μm (thickness of 5–8 μm is optimal for capture methods) (see Note 2).
5.
Dry ice; Inhalation and contact hazard. Use with appropriate ventilation and personal protective equipment.
2.2 Preparation of Frozen Tissue Sections for UV Cutting Mode (Protein Analysis)
1.
PEN membrane or PEN frame slides, 25 × 75 mm.
2.
Optimal cutting temperature cryopreservation solution (Tissue-Tek® O.C.T.™) (Sakura Finetek) for embedding frozen tissue sections.
3.
Cryomolds.
4.
Specimen for protein analysis: frozen tissue or ethanol-fixed tissue (cut sections at 2–200 μm, see Note 2).
5.
Dry ice.
2.3 Preparation of FFPE Tissue Sections for UV Cutting Mode (NanoString Analysis)
1.
Automated microtome.
2.
PET PALM® metal framed membrane slide (polyethylene terephthalate) (P.A.L.M. Microlaser Technologies).
3.
RNAse-AWAY™ (Molecular BioProducts).
4.
RNAse-free water (Hydro Picopure® 2UV Plus).
5.
FFPE tissue paraffin block for RNA analysis.
6.
Ice pan with solid ice (kept at −20°C).
7.
Water bath with RNAse-free water at +43°C.
8.
8% 3-aminopropyltriethoxysilane (APES) (Sigma) in dry acetone.
2.4 Hematoxylin and Eosin Staining for Frozen/FFPE Sections for Protein Analysis
1.
Mayer’s Hematoxylin Solution (Sigma). Inhalation and contact hazard; wear gloves when handling.
2.
Eosin Y Solution, alcoholic (Sigma). Highly flammable; store away from heat, sparks, and open flames. Contact hazard; wear gloves when handling.
3.
Scott’s Tap Water Substitute (Fisher), also known as Blueing Solution (see Note 3).
4.
Ethanol (ethyl alcohol, absolute, 200 proof molecular biology grade). Flammable; store away from heat, sparks, and open flames.
5.
Ethanol gradient: 70% (v/v in dH2O), 95 and 100% ethanol (see Note 4).
6.
Type 1 reagent-grade water (dH2O).
7.
Xylene. Xylene vapor is harmful and can be fatal if inhaled. Use in a well-ventilated area and discard in appropriate hazardous waste container. Flammable; Contact hazard; wear gloves when handling.
8.
Protease inhibitors (Complete Protease Inhibitor Cocktail tablets; Roche). Use one inhibitor tablet for every 10 mL of solution (see Note 5).
2.5 One-Step Cresyl Violet Acetate/Eosin Y Staining of FFPE Sections for NanoString Analysis
1.
Cresyl violet acetate (Sigma).
2.
Eosin Y (VWR).
3.
Ethyl alcohol USP Absolute-200 proof (AAPER Alcohol and Chemical Co.).
4.
RNAse-free water.
5.
ProtectRNA™ RNase inhibitor (Sigma).
6.
Xylene.
7.
50 mL conical (Falcon) tubes.
2.6 Laser Capture Microdissection Infrared Mode
1.
Arcturus XT LCM system (Applied Biosystems).
2.
CapSure® Macro LCM Caps (Applied Biosystems) are recommended for protein analysis. CapSure® HS LCM Caps (Applied Biosystems) are recommended for DNA or RNA downstream analysis (see Note 6).
3.
SealRight tubes 0.5 mL (USA Scientific) or GeneAmp® 0.5 mL Thin-walled Reaction Tubes with Domed Cap (cat. No. N801-0611; Applied Biosystems) (see Note 7).
2.7 Laser Capture Microdissection UV Mode
1.
Arcturus XT LCM system (Applied Biosystems/Life Technologies).
2.
mmi CellCut Plus® microdissection system (MMI).
3.
mmi IsolationCap® (MMI).
4.
PCR tube (200 μL).
5.
CapSure® Macro LCM Caps (Applied Biosystems) are recommended for protein analysis. CapSure® HS LCM Caps (Applied Biosystems) are recommended for DNA or RNA downstream analysis (see Note 6).
6.
SealRight tubes 0.5 mL (USA Scientific) or GeneAmp® 0.5 mL Thin-walled Reaction Tubes with Domed Cap (cat. No. N801-0611; Applied Biosystems) (see Note 7).
2.8 Protein and RNA Extraction Buffers
1.
Protein extraction buffer: 450 μL T-PER Tissue Protein extraction reagent (Pierce), 450 μL Novex® Tris-glycine 2× SDS loading buffer (Invitrogen), and 100 μL TCEP (Tris (2-carboxyethyl)phosphine) Bond Breaker® (Pierce).
2.
RNA lysis buffer for NanoString analysis: 2 μL of buffer RLT with β-mercaptoethanol from AllPrep RNA/DNA extraction kit (Qiagen), 3.8 μL of RNAse-free water (Hydro Picopure® 2UV Plus), 1.0 μL Proteinase K from FFPE RNA extraction kit (Qiagen), 0.3 μL of RNAseOut™ RNAse inhibitor (Invitrogen).
2.9 Adaptation of LCM Workflow for NanoString Platform
1.
Aperio ScanScope®XT scanner.
2.
ImageScope™ software.
3.
Agilent Bioanalyzer (Agilent Technologies).
4.
Agilent RNA 6000 Pico LabChip kit.
5.
AllPrep RNA/DNA extraction kit (Qiagen).
2.10 NanoString Analysis of LCM Samples
1.
NanoString technology platform.
2.
LCM sample lysate.
3.
Reporter CodeSet.
4.
Capture ProbeSet.
3 Methods
The protocols described below illustrate (a) sample preparation of frozen tissue sections, (b) hematoxylin and eosin (H&E) tissue staining for frozen sections and formalin-fixed paraffin-embedded sections (FFPE) or ethanol-fixed paraffin-embedded section, (c) infrared capture mode microdissection, (d) ultraviolet cutting mode microdissection using the Arcturus XT and mmi CellCut Plus, (e) cell lysis and protein extraction, and (f) NanoString analysis (30).
3.1 Frozen Tissue Sectioning for Protein Analysis
Tissue biopsy samples should be stabilized promptly (within 15 min) after procurement. Stabilization methods for tissue that will be frozen include embedding in a cryopreservative solution or snap freezing as soon as the specimen is excised from the patient/animal. Prompt preservation of the sample reduces protein and RNA degradation as a result of protease and RNase activity, respectively, and limits reactive changes in phosphorylated kinases (22, 24, 31–33).
1.
Embed tissue directly in a cryomold, covering the tissue with cryopreservative solution (OCT). Place OCT-embedded tissue on dry ice, or at −80°C, to freeze the tissue. Store the frozen tissue at −80°C (see Note 8).
2.
Cut frozen sections at 2–15 μm thickness (5–8 μm is optimal for IR laser capture) and place sections on labeled, uncharged, pre-cleaned glass microscope slides (see Note 9). Position the tissue section near the center of the slide, avoiding the top and bottom thirds of the slide (see Note 10). Place the slide directly on dry ice or keep it in the cryostat at −20°C or colder, or place the slide in a prechilled slide box on dry ice until the slides can be stored at −80°C. Alternatively, the frozen section can be immediately stained and microdissected (see Note 11).
3.2 FFPE Tissue Sectioning for NanoString Analysis
Maintain nuclease-free conditions throughout the procedure: Tools should be wiped with RNAse-AWAY™, rinsed with RNAse-free water, and wiped dry with a new kimwipe. A new disposable blade should be installed prior to cutting each sample. Use RNAse-free water in the water bath and use individual containers for soaking the tissue blocks (see Note 12). Discard the first 20–25 μm of tissue before cutting an LCM section (or use these first sections for reference H&E). Sections should be protected from dust while drying.
Coat PET slides with 8% APES in dry acetone.
1.
Expose PET slides to UV at 352 nm for 30 min.
2.
Immerse the slides in APES coating solution for 10 min.
3.
Wash slides in two changes of acetone for 1 min.
4.
Rinse slides in two changes of RNAse-free water for 10 min.
5.
Dry slides overnight at 37°C (see Note 13).
Design a block trimming template and trim the block
6.
Use an Aperio annotated digital image of the H&E reference slide (Fig. 4a) to design a block trimming template (Fig. 4b).
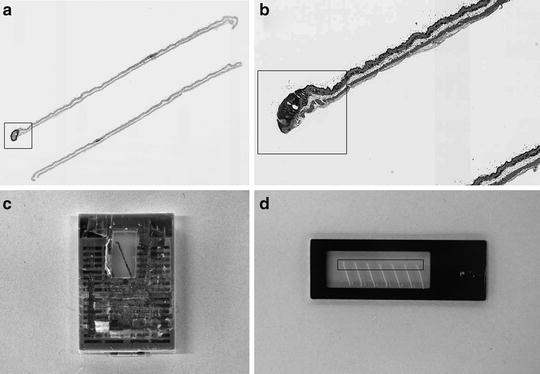
Fig. 4.
Sectioning approach for LCM slide preparation (large-scale target collection for NanoString analysis). (a) Aperio digital image of H&E slide with annotated papilloma (Aperio “fit” magnification). (b) FFPE block trimming template (Aperio ´4 magnification). (c) View of FFPE block trimmed according to the template. (d) Serial sections mounted on PET membrane slide. Target area in (a), (b), and (d) is indicated by a rectangle.
7.
8.
Cut serial 7 μm sections.
9.
On a water bath, separate the number of sections that will fit inside the dissection area of the PET framed slide.
10.
Position the tissue sections on the flat side of the PET slide, opposite the slide window. Center the sections such that the annotated area can be optimally dissected from around the slide midline (Fig. 4d).
11.
Air-dry slides for 1 h in a vertical position. Place a filter paper under the slide so that water which may have accumulated under the bottom section will drain out. Incubate the slides at 37°C overnight, followed with a 1 h incubation at 58°C.
12.
Cool slide to room temperature and place each sample set in an individual slide box with a desiccant pouch or Drierite. Store slides at −20°C.
3.3 Hematoxylin and Eosin Staining
Selection of tissue staining protocols should be based on compatibility with the downstream analysis (see Note 14). Staining protocols allow visualization and identification of the tissue or cells of interest with a standard inverted light microscope. Incorporation of protease inhibitors in the staining reagents, along with a microdissection session limited to 1 h, minimizes protein degradation during the staining process. RNAse inhibitors are recommended for tissues sensitive to RNA degradation. Skin tissue, cartilage, and samples prepared on charged slides might be difficult to microdissect and may require additional slide or tissue treatments (see Note 15) (34). The staining procedure employed depends on whether the tissue is frozen or paraffin-embedded.
3.3.1 H&E Staining Procedure for Frozen Tissue Sections
1.
Remove the frozen section slide from freezer/dry ice and proceed immediately with the staining protocol. Do not allow the slide to thaw.
2.
Dip the slide in each of the following solutions, for the time indicated. Blot the slide on absorbent paper in between the different solutions to prevent carryover from the previous solution.
(a)
70% Ethanol fixative, 3–10 s.
(b)
dH2O, 10 s.
(c)
Mayer’s hematoxylin, 15–20 s.
(d)
dH2O, 10 s.
(e)
Scott’s Tap Water Substitute, 10 s.
(f)
70% Ethanol, 10 s.
(g)
Eosin Y (optional), 3–5 s (see Note 16).
(h)
95% Ethanol, 10 s.
(i)
95% Ethanol, 10 s.
(j)
100% Ethanol, 30–60 s.
(k)
100% Ethanol, 30–60 s.
(l)
Xylene, 30–60 s (see Note 17).
(m)
Xylene, 30–60 s.
3.
Allow the stained slide to air-dry as quickly as possible (see Note 18).
4.
Proceed immediately with microdissection. Do not coverslip the slide.
3.3.2 H&E Staining Procedure for Formalin-Fixed or Ethanol-Fixed Paraffin-Embedded Tissue Sections
1.
Paraffin-embedded tissue sections must be de-paraffinized and rehydrated to allow staining of the tissue elements. Dip the slide in each of the following solutions, for the time indicated. Blot the slide on absorbent paper in between the different solutions to prevent carryover from the previous solution.
(a)
Xylene, 5–15 min (see Note 19).
(b)
Xylene, 5–15 min.
(c)
100% Ethanol, 30 s.
(d)
95% Ethanol, 30 s.
(e)
70% Ethanol, 30 s.
(f)
dH2O, 10 s.
(g)
Mayer’s hematoxylin, 15 s.
(h)
dH2O, 10 s.
(i)
Scott’s Tap Water Substitute, 10 s.
(j)
70% Ethanol, 10 s.
(k)
Eosin Y (optional), 3–5 s (see Note 16).
(l)
95% Ethanol, 10 s.
(m)
95% Ethanol, 10 s.
(n)
100% Ethanol, 30–60 s.
(o)
100% Ethanol, 30–60 s.
(p)
Xylene, 30–60 s.
(q)
Xylene, 30–60 s.
2.
Air-dry slide as quickly as possible.
3.
Proceed immediately with microdissection. Do not coverslip the slide (see Note 18).
3.3.3 One-Step Cresyl Violet Acetate/Eosin Y Staining Procedure for FFPE Sections (NanoString Analysis)
Our previously described protocol (35) was modified for (a) improved contrast on the dissecting screen of the mmi CellCut Plus® instrument, (b) gentle treatment of sections to minimize adherence to the membrane, and (c) better preservation of tissue RNA. RNase‐free conditions and reagents should be used for the whole procedure. Staining is performed in 50 mL Falcon tubes filled with 45 mL of required reagent (see Note 20).
1.
Prepare fresh staining mixture for four slides: 300 μL of cresyl violet stock (dissolve 250 mg of cresyl violet in 25 mL of 100% ethanol, mix on a shaker overnight, filter for RNAse-free conditions, store at +4°C for at least 6 months for the stain to reach full strength), 100 μL Eosin Y, 400 μL RNAse-free water, and 400 μL 100% ethanol. Vortex vigorously for 30 s, centrifuge (microfuge) at 6,000 rpm for 1 min, and pipette from the surface of the stain.
2.
Dissect one sample at a time. After −20°C storage, equilibrate slide to +4°C for 15 min in a closed box, and then to room temperature for 20 min.
3.
Move slide to a desiccator for at least 10 min before staining.
4.
Place the slide in xylene #1 and incubate for 5 min.
5.
Transfer the slide to xylene #2 and incubate for 5 min.
6.
Transfer the slide to 100% ethanol #1, gently invert the tube, and incubate for 1 min.
7.
Transfer the slide to 100% ethanol #2 and incubate for 1 min.
8.
By pipette, apply a maximum of 200 μL of stain to each section with ProtectRNA RNAse inhibitor (1:500) for 20 s, and immediately drain the slide by touching a kimwipe to the edge of the slide.
9.
Dip the slide in 100% ethanol for 5 s to rinse off the stain.
10.
Transfer the slide to 100% ethanol and incubate for 30 s.
11.
Transfer the slide to xylene #1, gently invert the tube, and incubate for 2 min.
12.
Transfer the slide to xylene #2 and incubate for 3 min.
13.
Air-dry the slide for 5 min in a fume hood in a vertical position (see Note 21).
14.
Transfer the slide to a desiccator at least for 10 min prior to LCM.
3.4 Laser Capture Microdissection: Infrared (IR) Capture Mode
The Arcturus XT system combines IR capture microdissection (LCM) and ultraviolet (UV) laser cutting in one instrument. UV laser cutting microdissection allows the “cut and capture” of cells of interest by first ablating unwanted cells, thus preventing contamination during cell capturing. This system is particularly useful for microdissection of tissue sections up to 200 μm thick, such as plant tissue sections (5, 9).
The Arcturus XT instrument features imaging software for creating composite images of the tissue, allowing the user to identify differences in tissue architecture during cell selection. The Graphical User Interface permits the control of all operations in the system, including stage movement, slide selection, focus and light intensity, laser parameters, objective selection, cap transfers, and camera settings (Fig. 1). Images may be captured, annotated, and saved as JPEG or TIFF files; live video can also be taken at any point during the microdissection process. This automated system is equipped with a trackball activated stage and a mouse for navigation across a slide. An interactive touch screen (stylus) monitor permits selection of single cells or groups of cells (36).
A variety of slide types can be used with this automated system including glass, glass membrane (PEN), and/or framed membrane (PET) slides. This flexibility, along with the IR laser and UV laser capability of the system, allows the user to technically prepare any specimen for automated laser microdissection (see Note 22).
Microdissection is performed without coverslips or immersion oils. Lack of immersion fluids on any of the optics prevents refraction of light from the tissue image. Thus, the color and detail of a given tissue stain is lost as the stained slide dries. Manual LCM methods capitalize on the index of refraction of a wet tissue slide for visualizing and reviewing an index-matched image of the tissue (11, 12). The Arcturus XT allows an index-matched image or images to be digitally saved which can be used to directly mark the cells of interest for microdissection.
The microdissection process consists of six steps: (1) loading the slides and LCM caps, (2) locating the cells of interest, (3) LCM cap placement and laser location, (4) marking the cells of interest, (5) capturing the cells, and (6) unloading of the samples and caps containing the captured tissue.
3.4.1 Arcturus XT Instrument Setup
1.
Turn on the PC, then the Arcturus XT instrument, and touch screen monitor.
2.
Open the Arcturus XT software program by double-clicking on the Arcturus XT software icon.
3.
Click on “Present Stage” in the SetUp tool pane. The microscope stage moves forward to allow loading of CapSure® caps and slides.
4.
Load the CapSure® caps by sliding a CapSure® cap cartridge into the stage slot. Each cartridge holds four individual LCM caps.
5.
Load up to three slides on the stage.
6.
Remove any existing caps in the QC/Unload area.
7.
Click the “i” options button to open the “Load Options” dialog box. Enter information about your slides and caps.
(a)
Check each slide that is loaded.
(b)
Check “Load with Overview” to create a full slide overview images.
(c)
Select the type of slide: glass, membrane, or frame.
(d)
Enter a slide name/ID in the “SlideName” field.
(e)
Enter any comments for each slide in the “SlideNotes” field.
(f)
Click on the “Caps” tab to enter information about the caps.
(g)
Select the type of cap: Macro or HS.
(h)
Check each cap that is loaded.
(i)
Click on “File Paths” tab to enter information regarding the location of saved images. Enter your desired file path/name information.
(j)
Click “OK.”
3.4.2 Inspect Image and Locate Cells of Interest
1.
Use the trackball or mouse to move the stage to an area for microdissection. The live video image is displayed on the monitor. Alternatively, you can tap the stylus on the overview image at the location of interest.
2.
To view a different slide, tap the slide button for the slide of interest (see Note 23).
3.
In the “Inspect” tool pane, select the desired objective, brightness, and focus by tapping on the corresponding button. The selected objective is indicated in red. Autobrightness and Autofocus settings are located in the middle icon between the up and down arrows (see Note 24).
4.
Locate the cells of interest using the trackball, mouse, or stylus to move the stage to the desired location (see Note 25).
3.4.3 LCM Cap Placement and Laser Location
1.
Place a cap on the slide by clicking “Place Cap” icon in the “Microdissect” tool pane. The instrument places a cap at the center of the red box in the slide overview image. The apparent size of this box will change depending on the microscope objective. The cap location is outlined in green.
2.
Use the trackball to move to an area without tissue but still under the cap. This can be at the side of the tissue, a luminal area, or any other area without cells.
3.
Tap the “i” options button in the “Select” tool pane. Tap the “IR Spot Sizes” tab.
4.
Click on the desired spot size button. Click OK.
5.
Double-click the mouse in the area without tissue to fire a test IR laser shot. This test spot allows you to verify the polymer wetting, spot size, and IR laser location.
6.
Place the mouse cursor directly in the center of the test spot. Right-click in the center of the spot and select “Located IR laser” (see Note 26).
7.
Move to another area free of cells and fire another test IR laser shot. Assess the quality of the spot for the following parameters (Fig. 1; see Note 27):
(a)
Clear center.
(b)
Dark ring around spot.
(c)
Appropriate spot size for cell type to be microdissected.
Spot adjustments can be made using the options button in the “Select” tool pane. If the spot diameter is larger than desired, reduce the power and/or duration. If the spot diameter is too small, increase the power and/or duration (see Note 28). Fire additional test spots until the desired spot is achieved (see Note 29).
8.
Measure the diameter of the test spot. Click on the ruler icon in the “Select” tool pane. Using the mouse or stylus, click and drag from one inner edge of the spot to the opposite inner edge. A line and label will be displayed showing the diameter of the spot. Click on the Move Stage (hand) icon to deactivate the ruler tool.
9.
Tap the “i” options button in the “Select” tool pane to edit the spot diameter, laser power/duration, and IR laser location.
10.
Tap the “IR Spot Sizes” tab. Enter the measured spot diameter for the selected spot size. Click OK.
3.4.4 Mark the Cells for Microdissection
1.
Locate the cells of interest using the trackball, mouse, or stylus to move the stage to the desired location.
2.
Click on any tool in the “Select” tool pane. The pencil icon is for freehand drawing. Freehand drawing objects must be a closed figure, i.e., the ends of the drawing must touch to enclose the desired area. The Defined circle tool allows the selection of defined areas of known diameter. The Single IR spot tool is for single cell or single spot microdissection. The IR Spot Line tool permits microdissection of a line, either straight or curved. A drawing tool is active if the icon is gray. Deactivate each drawing tool by clicking again on the icon.
3.
Using the stylus or mouse, mark cells on the live image that is to be microdissected.
4.
5.
Selected areas may be deleted or erased if they were erroneously selected. Right-click on the area to be deleted and select “delete” or use the eraser icon to delete partial areas. Alternatively, the drawing object may be deleted by right-clicking on the item in the Drawing Items List and selecting “Delete Object.” Selected areas may also be copied and pasted to another location or dragged as needed to duplicate or correct the drawing item placement.
6.
Different cell types can be marked for microdissection and separated out by utilizing Capture Groups. This feature allows cells to be marked from one image but microdissected separately. A Capture Group is a group of drawing items that will be microdissected during one microdissection session, on one cap (see Note 30).
(a)
Prior to marking cells for microdissection, click on the desired Capture Group (A, B, C, D) in the “Select” tool pane.
(b)
Mark the desired cell population for microdissection.
(c)
Select a new Capture Group. Mark the second desired cell population for microdissection.
(d)
Tap the “i” options button in the “Select” tool pane and click on Capture Group. Click the desired group and enter the attributes for that group (name, IR spot color, UV cut color). Click OK.
7.
To view the area of microdissection or the number of laser spots in each area, tap the “i” options button in the “Select” pane. Click on the “Drawing Items” tab to determine the area microdissected (μm2) or number of laser spots (see Note 31).
3.4.5 Capturing the Cells
1.
Tap the Capture Group to be microdissected if capture groups were assigned.
2.
Click on the IR capture icon in the “Microdissect” tool pane.
3.
If necessary, move the cap to new areas of the tissue/slide to microdissect additional cells (of the same cell type) that were not included under the original cap diameter. To move the cap, use the trackball, mouse, or stylus to move the stage to the new location. Right-click on the slide overview image and select “Place cap at region center.”
4.
Fire a test IR pulse in an area lacking cells to check the laser spot morphology (see Subheading 3.4.3, steps 4–8). Adjust the power and/or duration as needed to achieve the desired spot size and quality.
5.
Click on the IR capture icon in the “Microdissect” tool pane.
3.4.6 Unload the Samples and Microdissected Tissue
1.
After the desired number of cells, or a capture group, has been collected on a cap, move the cap to the QC station. Click on the “Move Cap to QC” icon in the “Microdissect” tool pane. The cap will be moved to the QC position on the stage. The stage will be aligned so the QC station holding the cap is in the optical path of the microscope. The cap image will be displayed in the live image window.
2.
Get Clinical Tree app for offline access
Inspect the tissue on the cap for efficiency of microdissection. Adjust the magnification (maximum of ×20 in the QC station), focus, and brightness.
(a)
Observe the cap for microdissection of the desired cells and for debris and/or adhesion of nonspecific tissue to the polymer surface.
(b)
 Histochemical Detection of Lipid Droplets in Cultured Cells
Environmental Scanning Electron Microscopy Gold Immunolabeling in Cell Biology
Histochemical Detection of Lipid Droplets in Cultured Cells
Environmental Scanning Electron Microscopy Gold Immunolabeling in Cell Biology
 Colocalization Analysis in Fluorescence Microscopy
 Atomic Force Microscopy Functional Imaging on Vascular Endothelial Cells
 Imaging Non-fluorescent Nanoparticles in Living Cells with Wavelength-Dependent Differential Interference Contrast Microscopy and Planar Illumination Microscopy
 Environmental Scanning Electron Microscopy in Cell Biology


Related posts:
Histochemical Detection of Lipid Droplets in Cultured Cells
Environmental Scanning Electron Microscopy Gold Immunolabeling in Cell Biology
Colocalization Analysis in Fluorescence Microscopy
Atomic Force Microscopy Functional Imaging on Vascular Endothelial Cells
Imaging Non-fluorescent Nanoparticles in Living Cells with Wavelength-Dependent Differential Interference Contrast Microscopy and Planar Illumination Microscopy
Environmental Scanning Electron Microscopy in Cell Biology
Stay updated, free articles. Join our Telegram channel
Full access? Get Clinical Tree
