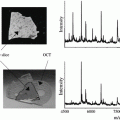
Fig. 1
(Top) Ion source and (bottom) vacuum chamber for laser desorption postionization mass spectrometer (LDPI-MS) instrument. Ion source shows only desorption laser, as ionization lasers come out of page parallel to and immediately above surface of sample plate. Load lock, main chamber, sample holder with motion stage, ion optics, reflectron, detector, and time-of-flight (ToF) tube are shown in vacuum chamber drawing
3 Instrument Workflow for Experiment
Figure 2 shows an overview of the workflow of each experiment involving LDPI-MS imaging analysis, emphasizing sample introduction since such customized instruments lack the automated sample transfer stages that are standard in most commercial MS instruments. The high-vacuum conditions required to operate the time-of-flight mass analyzer require that any residual moisture be removed from the sample by leaving it under vacuum in the load lock until the pressure reaches ~10−5 mBar. Next, the sample is inserted into the main chamber and is allowed to reach an equilibrium pressure of ~10−7 mBar. Power supplies for ion optics and the detector are turned on at this time and allowed to stabilize for >15 min. Analysis of the sample can begin after pressure drops below 10−7 mBar. Acquisition parameters and ion optics should have already been optimized prior to final data acquisition (see below). Since the values of these parameters affect the mass accuracy of the instrument, the acquired data must usually be reanalyzed using a mass calibration recorded on the same day.
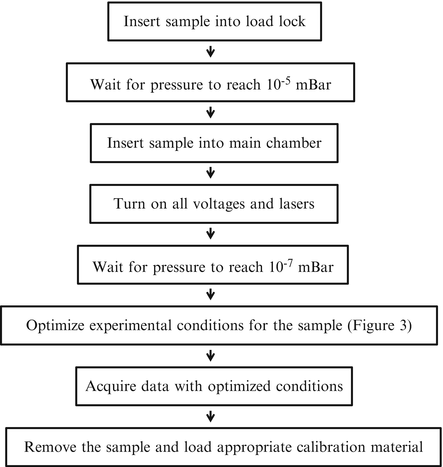

Fig. 2
Instrument workflow for each experiment. The sample is prepared and inserted into the instrument followed by data acquisition
4 Optimization of Data Acquisition Parameters
Optimization of data acquisition parameters is shown in Fig. 3. Data acquisition begins with acceleration and ion lens voltages initially determined by an ion optical calculation, and then refined through subsequent experiments. This set of standard conditions is stored on the data acquisition computer to be utilized as the initial instrumental settings at the start of each daily experimental run. The default delay between desorption and ionization lasers is set on the time delay generator box, but is optimized for different experiments.
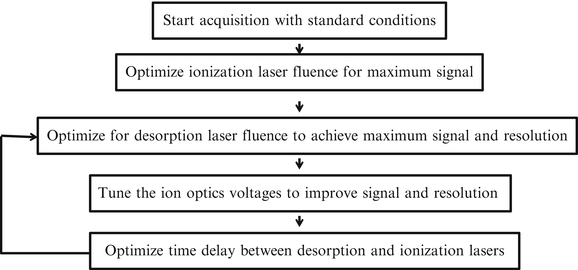

Fig. 3
Optimization of data acquisition parameters. The acquisition begins with standard conditions, and then ion optic voltages are optimized for optimum signal and resolution
When the procedure in Fig. 2 is completed up to the actual collection of MS data, the standard conditions are loaded and a series of daily optimizations are performed. First, ionization laser fluence is optimized for maximum signal. Two different ionization lasers are available, but the procedure varies slightly with each laser. In both cases, laser optics along the VUV beam path must be occasionally cleaned to maintain maximum ionization laser fluence [21].
For the 7.87 eV fluorine laser, the laser fluence is monitored at all times during the experiment. The laser may be refilled with fluorine gas if fluence is too low to obtain optimum signal intensity, as verified by collecting SPI-MS of triethylamine vapor introduced into the vacuum chamber via a leak valve. Next, the desorption laser is turned on and LDPI-MS signal is optimized on known standard compounds spotted onto a sample plate. Long data acquisition times may require refills if the laser fluence drops excessively during the experiment.
LDPI-MS with 10.5 eV radiation requires a Xe or Xe:Ar gas cell used for tripling the 355 nm output of a Nd:YAG [8, 14]. The Nd:YAG fluence at 355 nm is optimized for maximum 10.5 eV output followed by optimization of Xe gas pressure. If a Xe:Ar cell is used, then the gas ratio must also be optimized. 10.5 eV generation and output are measured by SPI-MS of gaseous acetone introduced via leak value. However, the absolute gas pressure, gas ratios (if relevant), and Nd:YAG pump fluence tend to remain constant over many experiments. While 10.5 eV generation has not been always reliable in some experimental configurations [1], this difficulty has been addressed through careful attention to the details of gas cell design, cleanliness of the gas cell [8, 14], and quality of the LiF optics used to transmit and focus VUV radiation [21].
Once ionization laser fluence is maximized, desorption laser fluence must be optimized during each experiment to maximize molecular ion signal while minimizing ion fragmentation. Increasing desorption laser fluence increases total ion signal, but this can be accompanied by an increase in the total fragmentation (up to a certain threshold) due to enhanced transfer of internal energy into the desorbed molecular species. However, it has been reported that surpassing this desorption laser fluence threshold can lead to reduced fragmentation for some organic samples [5]. Thus, the goal of the optimization of the desorption laser fluence is to minimize the fragmentation of the molecular ion while maximizing the total signal for that ion. Furthermore, optimization of desorption laser fluence is usually dependent on the type of sample and the nature of the experiment. For example, biofilm samples typically require higher fluences in order to desorb the necessary amount of sample for successful analysis.
Finally, laser spot size must be optimized for most experiments. Typically, the goal is to minimize the total spot size for the highest spatial resolution in imaging mode. However, the laser may be defocused in order to desorb a larger amount of analyte for the samples near the limit of detection. The desorption laser is focused onto the sample by a movable lens which can adjust the focus of the beam on the sample. Varying the position of the lens allows for varying the laser spot size on the sample. The optimum position of the lens and the resulting spot size vary from experiment to experiment, with larger spot sizes typically resulting in an increase of total signal.
Various ion optics are used in order to guide the ion plume to the detector. The voltages are tuned to optimize the trajectory of photoions to the detector for maximum signal. Often, voltages are tuned for each position on the sample plate. Each position on the acquisition plate requires voltage fine-tuning corresponding to the electric field. Each sample requires slightly different voltage tuning, since samples can vary in their response to the electric field generated by the desorption plate and thus require adjustment of steering plates for successful detection. Steering and repeller plate voltages are optimized for each experiment to achieve maximum signal at highest resolution.
During each experiment, the time delay between desorption and ionization lasers also must be optimized. Selecting the delay between desorption and ionization laser allows for a degree of control over the fragmentation of the analyte, with longer delays leading to reduced fragmentation and often detection of a higher mass distribution [5]. However, selection of especially long delay times comes at the price of decreased total signal.
Optimization of the desorption laser fluence, followed by the tuning of the voltages and optimization of the time delay between desorption and ionization laser, is repeated until acceptable mass resolution and signal to noise is achieved. However, this optimization can alter the mass calibration of the instrument, as described above, since varying ion optical voltages affects the mass calibration. For this reason, the mass analyzer needs to be calibrated for several different regions of the sample plate to obtain maximum mass resolution.
5 Data Collection for Imaging
Several additional conditions need to be established for imaging experiments. The instrument shown in Fig. 1 employs fixed laser positions with respect to the ion source and ToF mass analyzer, requiring sample-stage translation for imaging. Meandering speed for the sample stage is determined in accordance with the desired resolution, step size, and desired length of acquisition time for the experiment: a typical stage speed is 0.05 mm/s with a step size of 50–100 μm. The operator also controls the total binning and averaging of spectra recorded from individual laser shots. The larger average values result in better signal to noise for the analyte, in results in the trade-off of decreased spatial resolution. The total time required to acquire a mass spectrum is determined by the signal to noise and the data acquisition rate, the latter of which is usually limited by the repetition rate of the ionization laser. Maximum data acquisition rates of 100 Hz for 7.87 eV photoionization and 10 Hz for 10.5 eV photoionization are possible for the instrument described here.
Stay updated, free articles. Join our Telegram channel

Full access? Get Clinical Tree


