Fig. 1.
Schematic representation of the laser scanning cytometer (LSC) (see text for explanation). It should be noted that the most recent models of LSC (iGeneration) have an inverted format with the laser illumination originating beneath the microscope slide (see ref. (15)).
The measurement of cell fluorescence (or light scatter) is computer-controlled and triggered by a threshold contour set above background (Fig. 2). The following parameters are recorded by LSC for each measured cell/object:
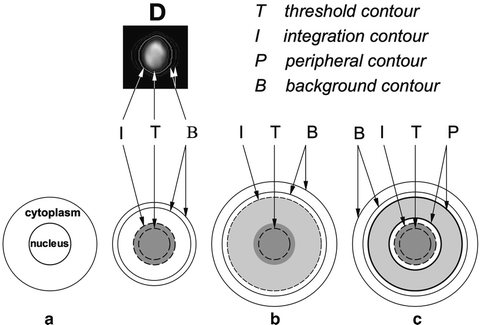
Fig. 2.
Different settings for analysis of nuclear, total, and/or cytoplasmic fluorescence by LSC. When nuclear DNA is stained with a red fluorescing dye (e.g., propidium), the threshold contour (T) is set on red signal to detect the nucleus, e.g., as shown in (a). The integration contour (I) is then set a few pixels outside of T to ensure that all nuclear fluorescence is measured and integrated (a). However, when cytoplasmic fluorescence also is measured, I is set far away from T to ensure that fluorescence emitted from the cytoplasm is integrated as well (b). It also is possible to separately measure nuclear and cytoplasmic fluorescence as shown in (c). The peripheral contours (P) are then set at the desired number of pixels outside of I and the fluorescence intensities emitted from both areas, namely within the I boundary and within the P torus, are separately measured and separately integrated. In each case the background contour (B) is automatically set outside the cell and the background fluorescence is subtracted from nuclear, cytoplasmic, or total cell fluorescence. The actual cell’s contours, as they appear on the monitor, are shown in (d).
(a)
Integrated fluorescence intensity, representing the sum of intensities of all pixels (“picture elements”) within the integration contour area. The latter may be adjusted to a desired width with respect to the threshold contour (Fig. 2)
(b)
The maximal intensity of an individual pixel within this area (maximal pixel; “max pixel”)
(c)
The integration area, representing the number of pixels within the integration contour
(d)
The perimeter of the integration contour (in μm)
(e)
Circularity, a measure of “roundness” calculated as the ratio of (perimeter 2 )/area
(f)
The fluorescence intensity integrated over the area of a torus of desired width defined by the peripheral contour located around (outside) of the primary integration contour. For example, if the integration contour is set for the nucleus, based on red fluorescence (DNA stained by propidium iodide, PI), then the integrated (or maximal pixel) green fluorescence of fluorescein isothiocyanate (FITC)-stained cytoplasm can be measured separately, within the integration contour (i.e., over the nucleus) and within the peripheral contour, i.e., over the rim of cytoplasm of desired width outside the nucleus. All above values of fluorescence (a, b, d) are automatically corrected for background, which is measured outside the cell, within the background contour (Fig. 2)
(g)
The xy coordinates of maximal pixel locating the measured object on the microscope stage
(h)
The computer clock time at the moment of measurement
The software of LSC (WinCyte) allows one to obtain ratios of the respective parameters as a new parameter, and the ratiometric data can be displayed during data analysis. The electronic compensation of fluorescence emission spectra overlap is one of the features of the data analysis. The compensation at the time of data analysis is more convenient than in real-time, as it is in most flow cytometers, because it provides an opportunity to test and compare different settings for optimal results.
In addition to the parameters listed above, the WinCyte software of LSC is also designed to analyze the fluorescence in situ hybridization (FISH). Towards this end, the software allows one to establish, within a primary contour representing nucleus stained with a particular dye (e.g., propidium), a second set of contours representing another color (e.g., FITC) fluorescence. Five secondary features are then measured in addition to the major features that were listed above, namely: (a) number of secondary contours (i.e., FISH spots); (b) distance between the nearest spots; (c) integrated- and (d) maximal pixel-fluorescence, as well as (e) fluorescence area. The three last parameters (c–e) are measured for each secondary contour.
Recent advancements in development of LSC are represented by the iGeneration instruments (15). In these instruments (e.g., iCys® Research Imaging Cytometer), the beams from up to four lasers (with the six available excitation wavelengths at 405, 488, 532, 561, 594, and 633 nm) are combined into a coincident path and directed to an inverted microscope and onto a focal plane at the specimen. Thus, compared with most instruments that still are in use (schematically illustrated in Fig. 1), the laser illumination in the iGeneration LSCs is beneath the sample. The inverted format allows analysis of specimens on a variety of platforms, including microscope slides, microtiter plates, chamber slides, Petri dishes, or user-defined carriers fitting the footprint of a microtiter plate. Autofocus is integral to iGeneration cytometers, minimizing operator involvement during measurements. The available objectives are ×4, ×10, ×20, ×40, and ×60, offering nominal scan resolution (square pixels) of 2.5, 1.0, 0.5, 0.25, and 0.15 μm. The higher resolution imaging eliminates the need for additional imaging with an optical microscope and allows for post-scan visualization of any site of interest. In addition to fluorescence intensity, the laser light-loss (for use with chromatic dyes) can be measured by collecting the transmitted laser light and directing it to photodiode detectors. An optional robotic arm is available for large-scale walk-away experiments, allowing automatic loading of up to 45 carriers.
Moreover, the iGeneration software has also been upgraded. The raw scan data can be saved as JPEG or 16-bit image files suitable for data processing, specimen visualization, and quantification by proprietary analytical software. Contours can be generated around cellular events based on the fluorescence intensity, forward scatter, or light absorption, either automatically to select an entire sample area, or user-defined to target specific types of events. Scan images may be assembled into tiled mosaic images, allowing contours to be drawn on tissue sections, cell colonies, and other large events that span multiple scan fields. Once the contours are generated, the software can perform a wide range of analyses and produce output in the form of numerical statistics, scattergrams, histograms, expression maps, or other statistical visualizations. Special mathematical operations allow correction for spectral overlap and tissue autofluorescence and permit combining different time-lapse images. Analysis protocols are easily “written” by graphically assembling various functional modules to establish the desired analytical workflow. Each module’s attributes can be easily modified, and the effect of these changes can be viewed immediately in the scanned images. Customizable protocol templates are provided as frameworks for different assays. More detailed and up-to-date description of the iGeneration LSC instruments is presented by Henriksen et al. (15).
The measurements by LSC are relatively rapid; for instance, with optimal cell density on the slide, up to 5,000 cells can be measured per minute. The accuracy and sensitivity of cell fluorescence measurements by LSC are comparable to the advanced flow cytometers (1–3).
Other methodologies that can quantify cell constituents measuring fluorescence, in addition to LSC and FCM, are fluorescence image analysis (FIA) and ImageStream cytometry (16). In FIA the cell illumination is uniform, provided by a mercury or xenon arc epi-illuminator. A band-pass filter selects fluorescence of a desired wavelength that is imaged at low depth of focus by a CCD camera. Compared with LSC or FCM that utilize photomultipliers, the dynamic range of sensitivity of fluorescence intensity measurement by a CCD is lower in FIA; thus, FIA cannot provide quantitative analysis of fluorescence intensity that would be on the par with FCM or LSC. ImageStream cytometry offers more rapid (up to 1,000 cells/s) analysis of individual cells compared to LSC. However, because unlike in LSC the interrogated cells are suspended in liquid rather than spread flat (stretched out) on slide, the spatial image resolution is inferior. Also, each cell can be measured only once in flow which prevents their repeated measurements, subsequent analysis by other probes, or archival preservation (16).
3 Maximal Pixel of Fluorescence Intensity
Maximal pixel of fluorescence intensity (MP) is a useful reporter of local hypo- or hyperchromicity, reflecting the degree of concentration (density) of the fluorescent probe either in intracellular compartments or on cell surfaces (e.g., receptor clustering). One of the early applications of LSC along this line was to identify cells with condensed chromatin. Specifically, because DNA in condensed chromatin, such as of mitotic or apoptotic cells, shows increased staining intensity (per unit area of chromatin image, because the same amount of DNA is compacted at higher spatial density), the MP of these cells stained with a DNA fluorochrome is higher than that of cells with the same DNA content but with diffuse chromatin (17, 18). Although mitotic cells can be recognized by cytometry using a variety of markers (reviewed in ref. (19)), an advantage of the MP marker is the use of a single fluorochrome to distinguish G1 vs. S vs. G2 vs. M phase cells. This enables one to apply another color fluorochrome(s) to detect other cell constituents. Such an approach has been used to combine pulse labeling of DNA replicating cells with bromodeoxyuridine (BrdU) (detected with anti-BrdU Ab) with identification of mitotic cells to study cell cycle kinetics by the “fraction of labeled mitoses” (FLM) method (20). The FLM assay, designed initially for tritiated thymidine autoradiography, yields a wealth of information on cell cycle kinetics, but in its original version (21) is cumbersome and time consuming. Its adaptation to LSC simplifies the procedure and shortens the time of analysis (20). Similar to mitotic-, BrdU-labeled meiotic-chromosomes were identified by LSC in studies of mutagenesis (22).
Apoptotic cells having condensed chromatin also can be identified by MP of DNA-associated fluorescence (14, 23, 24). It should be cautioned, however, that because mitotic and apoptotic cells both are characterized by high value of MPFI, the distinction of apoptotic—from mitotic—cells is not always possible. This limitation is of particular importance when apoptosis is induced by agents that arrest cells in mitosis, and therefore the sample contains mitotic cells that die by apoptosis (“mitotic catastrophe”). MP has also been found useful to detect localized caspase activity in early apoptotic cells by the analysis of local intracellular accumulation of the caspase-cleavage product of the fluorogenic substrate (25). Likewise, translocation of Bax to, and its accumulation in mitochondria, the event that facilitates the release of cytochrome c and activation of caspases was detected by LSC as an increase in MP of Bax immunofluorescence (26). The MP of DNA-associated fluorescence combined with fluorescence area, the parameter that reflects nuclear size and correlates inversely with chromatin condensation, was used to distinguish lymphocytes from monocytes and from granulocytes, the cell types that differ by the degree of chromatin condensation (27).
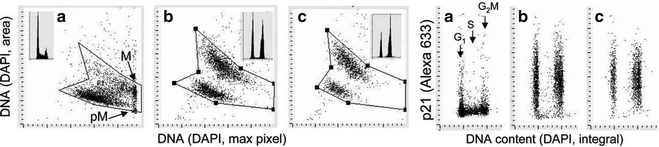
Fig. 3.
Discrimination of cells undergoing senescence based on morphometric analysis of nuclear changes revealed by a decrease in intensity of maximal pixel of DNA-associated (DAPI) fluorescence and an increase in nuclear area. To induce senescence, A549 cells were treated in culture with DNA topoisomerase II inhibitor mitoxantrone (Mxt) for 48 h (b) or 72 h (c). Intensity of maximal (max) pixel of DNA/DAPI fluorescence reports the degree of chromatin condensation, and in untreated cells (a) has the highest value and marks mitotic (M) and immediately postmitotic (pM) cells. In the senescing cells, due to their extreme “fattening,” nuclear area increases and the intensity of maximal pixel decreases. The ratio of maximal pixel to nuclear area provides a sensitive marker of “depth” of cell senescence. Right panels show expression of CDK inhibitor p21, known to be another marker of senescent cells, measured concurrently with DNA (28).
The utility of MP of the DNA-bound fluorochrome as measured by LSC was recently underscored in an analysis of cell senescence (28). The attribute of senescent cells is their morphology: enlargement and characteristic “flattening” of the nucleus (Fig. 3). When analyzed by LSC, this was reflected by an increase in nuclear area and a decline in intensity of MP, most pronounced as the decrease of the ratio of MP/nuclear area, providing a very sensitive biomarker of the degree of cell senescence (28). Still another utility of MP analysis by LSC was recently demonstrated by detection of the very early step of DNA damage response (DDR), namely recruitment of the MRN complex of proteins (Mre11, Rad50, Nbs1) to the DNA damage site (13). This event, which is essential for activation of Ataxia Telangiectasia mutated protein kinase (ATM) and initiation of the subsequent steps of DDR, was revealed as the increase in intensity of MP of Mre11 immunofluorescence measured over nuclei of cells subjected to oxidative stress (13, 29).
4 Nuclear vs. Cytoplasmic Localization of Fluorescence
Fluorochrome-stained DNA provides a good marker defining nuclear boundary. If another color fluorochrome is used to mark other cell constituents, LSC is then able to resolve and separately measure nuclear and cytoplasmic content of such constituents (Fig. 2; peripheral torus). This capability can be used to detect translocation of particular proteins from cytoplasm to nucleus, or vice versa, e.g., to monitor the traffic of signal transduction or activation molecules. A classical example of such a protein is nuclear factor kappa B (NF-κB). This ubiquitous factor is involved in regulation of diverse immune and inflammatory responses and also plays a role in control of cell growth and apoptosis (30). Activation of NF-κB was detected by an increase in its immunofluorescence measured over the nucleus, concomitant with a decrease in fluorescence over the cytoplasm, which was reflected by a large increase in the nuclear to cytoplasmic fluorescence ratio (see ref. (31); Fig. 4). One of the virtues of this assay is that NF-κB activation can be correlated with cell morphology, immunophenotype, or cell cycle position (31). The assay of NF-κB translocation by LSC has been found more sensitive than any of the four alternative methods (32). This application of LSC can be extended to monitor other transcription factors that upon activation undergo translocation to the nucleus, such as tumor suppressor p53 and specific signal transduction or cell cycle regulatory molecules. For example, the upregulation and translocation of p53 from cytoplasm to nucleus in response to DNA damage by topoisomerase I inhibitor camptothecin was detected and measured by LSC (33). The nuclear location of proliferating cell nuclear antigen (PCNA), detected immunocytochemically by LSC, provided a good discrimination of the proliferating potential in histopatological analysis of renal cell carcinoma (34).
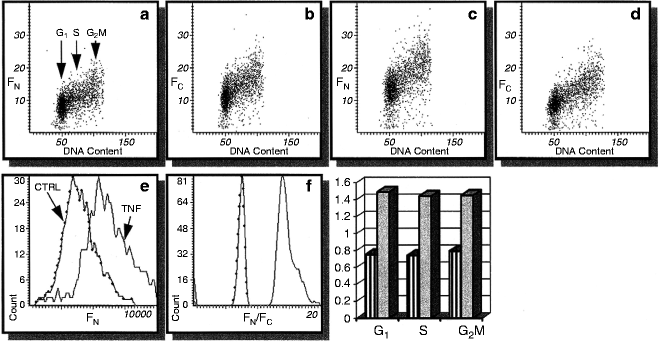
Fig. 4.
Changes in intensity of NF-κB immunofluorescence integrated over the cell nucleus (FN; a, c) and cytoplasm (FC; b, d) in U-937 histiomonocytic lymphoma cells, untreated (a, b) and treated for 1 h with 10 ng/mL TNF-α (c, d). Note the increase in FN after the treatment (e) and even more pronounced increase in the FN/FC ratio (f). Bars indicate FN/FC of the cells gated in G1, S, and G2/M based on differences in their DNA content as shown in (a); striped bars, prior to TNF-α treatment, shaded bars, after the treatment (25).
It should be mentioned that in the case of asymmetrically shaped cells (e.g., fibroblasts, neurons) or cells with acentric position of the nucleus (e.g., muscle cells), the integration of fluorescence from the entire cytoplasm is problematic. Partial solution to the problem may involve trypsinization followed by cell deposition on slides by cytocentrifugation. The cells that grow asymmetrically on slides become then more spherical, with the nucleus centrally located.
5 The Micronucleus Assay and DNA Damage Signaling
The micronucleus assay is widely used to assess the chromosomal or mitotic spindle damage induced by ionizing radiation or mutagenic agents in vivo or in vitro. Because visual scoring of micronuclei is cumbersome, semi-automatic procedures that rely either on FCM or image analysis were developed. LSC was adapted for the analysis of micronucleation induced by genotoxic agents in vivo in mouse erythrocytes (35), as well as in vitro, in cultured cells (12, 36, 37). The ability of LSC to relocate micronuclei for visual examination was useful in confirming their identification. Multiparameter characterization of micronuclei that took into an account their DNA content and protein/DNA ratio (Fig. 5) made it possible to establish the gating parameters that excluded objects that were not micronuclei (36). The percentage of micronuclei assayed by LSC correlated well with that estimated visually by microscopy in published studies (36, 37). LSC, thus, can be used to obtain an unbiased estimate of the frequency of micronuclei more rapidly than by conventional examination of the preparations by microscopy. Furthermore, unlike FCM, LSC allows one to characterize individual cells with respect to frequency and DNA content of micronuclei residing in these cells, and furthermore can be applied to the cytokinesis-blocked (e.g., by cytocholasin B) micronuclei assay (36, 37). Assessment of DNA damage is another measure of genotocicity or can be used as a marker of cell death (apoptosis). LSC has found an application for this purpose as well, specifically, for measuring the extent of DNA degradation and electrophoretic mobility from individual cells in the “comet” (38) or “halo” (39) assays.
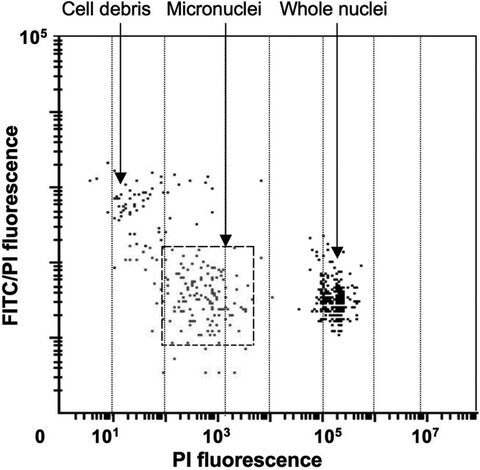
Fig. 5.
Detection of micronuclei by LSC. To induce micronuclei, HL-60 cells were treated with mitomycin C, then cytocentrifuged, fixed, and stained with FITC and PI. Micronuclei (located on this scatterplot within the dashed-line gating window where they consist ∼93% of all events) were identified by their low DNA content (PI fluorescence) ranging between 0.1 and 5% of that of the whole G1 nuclei and FITC/PI fluorescence ratio that was similar to that of the whole nuclei (30).
During the past 5 years, LSC has been extensively used in studies of DDR (12, 40–45). In these studies, the DNA damage signaling was detected immunocytochemically using phospho-specific Abs reactive with activated members of the signaling pathways: histone H2AX phosphorylated on Ser139 (γH2AX), ATM phosphorylated on Ser1981, p53 phosphorylated on Ser15, and Chk2 phosphorylated on Thr68. The advantage of LSC in these studies stems from the possibility of cell imaging, which allows one to identify cells having punctate (foci) distribution of γH2AX, considered to be a marker of double-strand DNA breaks (46). The multiparameter analysis of DNA damage signaling of cells treated with a variety of genotoxic agents correlated with identification of the cell cycle phase and active DNA replication detected by the “click chemistry” provided a wealth of information on mechanisms of DDR involving activation of cell cycle checkpoints, induction of apoptosis, and recruitment of the repair machinery (12, 40–45).
6 Applications of LSC Utilizing the Software Designed for FISH Analysis
6.1 FISH Analysis, Cytogenetic Studies
Semi-automated FISH analysis represents still another LSC application that is based on its capability to spatially resolve the distribution of fluorescent regions within the cell (2, 46, 47). As mentioned, the software developed for this application allows one to establish, within a primary contour representing, e.g., nucleus stained with a particular dye (e.g., propidium), a second set of contours representing another color (e.g., FITC) fluorescence. An obvious advantage of LSC over visual analysis of FISH is the unbiased selection of the measured cells and their semi-automated, rapid measurement. Furthermore, the analysis of the integrated fluorescence intensity of the secondary contours may yield information pertaining to the degree of amplification of particular genome sections. Thus, for example, Kobayashi et al. (48), using the dual-color FISH analysis by LSC revealed an increase in 20q13 chromosomal copy number in several breast cancer cases and correlated it with DNA ploidy and estrogen- or progesterone-receptor status. LSC has also found utility in studies employing comparative genomic hybridization (CGH) to reveal cytogenetic aberrations in several types of human cancer (49–51), studies of DNA ploidy in sperm cells (52), or the analysis of HER2 amplification in breast cancer (53). It should be noted, however, that semi-automated FISH measurements by LSC are subject to potential traps and require high quality technical preparations (2, 43).
6.2 Analysis of Nucleoli and Protein Translocations Between Nucleoli and Nucleoplasm
The capacity of the LSC software originally designed for semi-automatic FISH analysis may be applied to other applications. One such application is the quantitative analysis of nucleoli and monitoring traffic of molecules between nucleoli and nucleoplasm (54, 55). A useful immunocytochemical marker of nucleoli is an Ab to the nucleolar protein nucleolin. Using this Ab, it was possible to estimate the size of individual nucleoli (area and circumference), number of nucleoli per nucleus, total nucleolar area per nucleus, as well as expression of nucleolin separately in nucleoli and nucleoplasm (55). All these parameters have been found to strongly correlate with the proliferative status and the cell cycle position of mitogenically stimulated lymphocytes (55). Most interesting, however, was the observation that abundance of nucleolin in nucleoplasm was maximal during the cell transition from G0 to G1 phase of the cycle, which corresponded to the maximal rate of rRNA synthesis and its accumulation within the cell. The translocation of nucleolin from nucleoplasm to nucleoli was observed at later stages of lymphocyte stimulation, when the cells were progressing through G1, S, and G2/M and when the rate of rRNA accumulation was decreased (55). Similar application of LSC revealed the cell cycle phase-associated nucleoplasm-nucleolar shuttling of cyclin E, which was defective in bladder cancer cells (54).
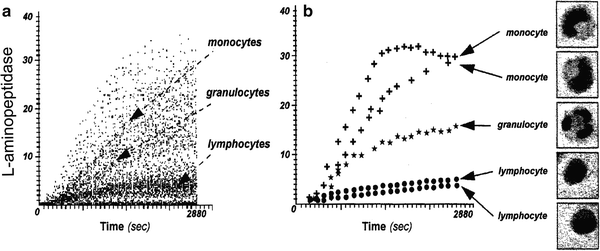
Fig. 6.
l-Aminopeptidase activity of white blood cells from human peripheral blood. Cells were attached electrostatically to a slide and incubated with the fluorogenic substrate of l-aminopeptidase (di-(leucyl)-rhodamine 110). Fluorescence of cells within a specified area of the slide was repeatedly measured and time-resolved changes in green fluorescence intensity of these cells were recorded for leukocytes, and their fluorescence was repeatedly measured. Integrated value of the cell green fluorescence, position on the slide (x vs. y coordinate), and the time of measurement were recorded in a list mode for each cell (78). The changes in fluorescence of all measured cells as a function of time are shown in (a). Five cells were selected from (a) and using the “merge” program the kinetic curves for each of these cells were constructed and plotted (b). The slides were then air dried, stained with Giemsa, and examined by light microscopy. Individual monocytes, granulocytes, and lymphocytes were identified as those that matched with their respective kinetic plots. The cells characterized by a high rate of di-(leucyl)-rhodamine 110 cleavage were predominantly monocytes, those characterized by a moderate rate of cleavage were granulocytes, and by a minimal rate were lymphocytes (b) (78).
6.3 Progeny of Individual Cells/Clonogenicity Assay
Another application of LSC utilizing the FISH approach was demonstrated in the analysis of progeny (clones) of individual cells (56). In this application, cellular protein and DNA were stained with fluorochromes of different color while the product of tumor suppressor gene p53 or estrogen receptor was detected immunocytochemically, with still another color fluorescent dye. The threshold contour was set on protein-associated fluorescence which made it possible to analyze the whole cell colony as a single entity. This approach made it possible to measure a variety of attributes of the progeny of individual cells (phenotype of individual cell colonies), such as colony size (area, circumference, cell number per colony), DNA and protein content per colony, expression of p53 or estrogen (per colony, per cell, per unit of DNA or protein), colony heterogeneity, and cell cycle distribution of individual cells within colonies. Such multiparameter analysis provided a wealth of information and has been used to study mechanisms by which the cytotoxic RNase—onconase affected proliferative capacity of the cells, induced growth imbalance, and differentiation (56). Extensions of LSC may make this instrument applicable for automatic analysis of cloning efficiency and multiparameter analysis of cell colonies in soft agar. Such analyses may be useful in studies of mechanisms and effectiveness of antitumor drugs, in the field of carcinogenesis, and for the analysis of primary cultures, including assessing tumor prognosis and drug sensitivity. The assay can also be adapted to the analysis of microbial colonies.
7 Cell Immuno-phenotyping
LSC has been adapted to perform routine immunophenotyping. Multi-chamber microscope slides were developed which can be used to automatically screen cells against up to 36 antibodies on a single slide by LSC (57–62). The chambers are filled with cell suspension by capillary action. In the absence of serum or other proteins in the suspension, the cells strongly attach to the floor of the chambers by electrostatic interactions (57–60). Various antibody combinations are then introduced into the chambers, the cells are incubated in their presence for 30–60 min, and following the rinse, their fluorescence is measured. The rate of analysis is relatively fast, as it takes ∼20 min to screen the cells distributed in 12 wells labeled with a panel of 36 antibodies (three antibodies at a time), measuring 3,000–5,000 cells/well (57–60).
Although the rate of measurement by LSC is slower than FCM, and the lack of side (90° angle) light scatter analysis precludes discrimination of lymphocytes from monocytes and granulocytes, certain advantages of LSC may outweigh these deficiencies. Thus, LSC is preferred for hypocellular samples which cannot tolerate repeated centrifugations that lead to cell loss. It should be stressed that loss of cells during centrifugations, as required for FCM analysis, is not random but preferential to different cell types (27). LSC analysis is also economical, since small sample size reduces the cost of reagents (Abs) by over 80% compared to FCM (57–60). Furthermore, the LSC provides the possibility to relocate immunophenotyped cells for additional analysis or archival preservation.
8 The Relocation Attribute
8.1 Visual Cell Examination: Imaging
Because the spatial xy position of the measured cell is recorded, its relocation for visual examination by microscopy or imaging is possible. This attribute is of importance in many applications. For instance, in the analysis of apoptosis cell morphology still remains the gold standard to identify this mode of cell death (13, 23). Using LSC, it was possible to discriminate between genuine apoptotic cells and “false positive” cells in peripheral blood and bone marrow of leukemic patients undergoing chemotherapy (13). The latter cells were monocytes/macrophages containing apoptotic bodies (probably ingested from the disintegrating apoptotic cells) in their cytoplasm. While both the genuine apoptotic cells and the “false positive” cells contained numerous DNA strand breaks and were indistinguishable by FCM, the analysis of their morphology by LSC allowed their positive identification (13). In another study, eosinophils were identified by LSC as “false positive” apoptotic cells due to their nonspecific labeling with fluorescein-conjugated reagents (63). LSC was also helpful in distinguishing apoptotic cells from cells infected by Human Granulocytic Erlichiosis (64). Based on these observations, as well as other findings, it was concluded that LSC is the instrument of choice for the analysis of apoptosis (13, 65).
Several other methods of identification of apoptotic cells, including recognition by the presence of DNA strand breaks, decreased mitochondrial transmembrane potential, cleavage of poly (ADP-ribose) polymerase, or fractional DNA content, have been successfully adapted to LSC (66, 67). LSC was used to measure activation of caspases during apoptosis by the method utilizing fluorochrome-labeled caspase inhibitors (FLICA) (68), as well as to detect segregation of RNA from DNA and their separate packaging into apoptotic bodies (69). In all these studies the possibility of cell relocation for visual assessment of apoptosis was a valuable feature of LSC.
8.2 Sequential Analysis of the Same Cells with Different Probes
LSC allows one to integrate the results of two or more measurements into a single file (the “file-merge” feature). This attribute provides the means to measure the same cells more than once, using different settings or probes (70). For example, it is possible to set the integration contour first on the nucleus and subsequently on the entire cell. This approach enables one to separately measure particular constituents in the nucleus and in the entire cell. Such analysis has been applied to reveal translocation of cyclin B1, detected immunocytochemically, from cytoplasm to nucleus during mitosis (71).
Another application of the file-merge feature of LSC was used for the analysis of cellular DNA and double-stranded (ds) RNA (72). Cells were stained with propidium iodide (PI) and measured twice, prior to, and after incubation with RNase. The integrated value of PI intensity of individual cells during the first measurement was proportional to their DNA plus ds RNA content. The PI fluorescence intensity during the subsequent measurement was due to the dye interaction with DNA only. Thus, when the second measurement was subtracted from the first measurement, the difference (“Differential Fluorescence”; DF) represented the RNA-associated PI fluorescence only. DF was then used as a separate parameter that was recorded in list mode in the merged file. Cellular protein was also counterstained, but with a fluorochrome of another color of emission than PI. The multiparameter analysis of these data made it possible to correlate, within the same cells, the cellular ds RNA content with DNA content (cell cycle position) or with protein content (72). This approach, using DF as an additional, discrete parameter for bivariate or multivariate analysis, extends the application of LSC for bivariate or multivariate analysis of other cell constituents which may be differentially stained with fluorochromes displaying the same wavelength of emission.
Related posts:
 Histochemical Detection of Lipid Droplets in Cultured Cells
Environmental Scanning Electron Microscopy Gold Immunolabeling in Cell Biology
Histochemical Detection of Lipid Droplets in Cultured Cells
Environmental Scanning Electron Microscopy Gold Immunolabeling in Cell Biology
 Colocalization Analysis in Fluorescence Microscopy
 Atomic Force Microscopy Functional Imaging on Vascular Endothelial Cells
 Environmental Scanning Electron Microscopy in Cell Biology
Stay updated, free articles. Join our Telegram channel

Full access? Get Clinical Tree


