Chapter 3 Left ventricular function
Radionuclide ventriculography (RNV)
Single-photon emission computed tomography (SPECT)
Positron emission tomography (PET)
Left ventricle
Left ventricular deterioration is an important marker of worsening clinical prognosis. Parameters of left ventricular function, generally systolic ejection fraction (EF), are commonly measured in patients with heart disease. The lower the resting EF or the more global the left ventricular dysfunction, the worse the survival. Therefore left ventricular assessment is one of the most frequent indications for cardiovascular imaging.
Anatomy
The left ventricle is an ellipsoid-shaped cavity with muscular walls. It contains the papillary muscles (anterolateral and posteromedial) and chordal attachments to both leaflets of the mitral valve.
Cardiovascular imaging
Invasive cardiac catheterization was the first reliable cardiac imaging technique. Now all non-invasive imaging techniques are able to perform some form of left ventricular assessment. However, there are significant differences in the accuracy and reproducibility of the methods. Optimal use of available techniques is crucial for diagnosis, treatment, and follow-up of patients. The optimal imaging technique needs to be able to measure left ventricular size and mass and also how those measures vary during the cardiac cycle (both systole and diastole). In principle echocardiography provides readily available evaluation of the left ventricle to determine systolic and diastolic function through a combination of 2D and Doppler imaging. However, it may be limited by image quality and CMR provides a far more precise measure of cavity size to determine systolic function although it is limited in its ability to assess diastolic function. Nuclear techniques have been available as a gold standard measure of left ventricular systolic function for many years.
The modalities most often used for left ventricular assessment are:
 Echocardiography.
• 2D
• contrast 2D
• real-time three-dimensional (RT3DE)
• contrast RT3DE
• transoesophageal echocardiography (TOE)
 Nuclear imaging.
• radionuclide ventriculography (RNV)
• gated SPECT
 Cardiac magnetic resonance (CMR)
 Angiography.
Modalites used less often for left ventricular assessment are:
 Computed tomography (CT)
 Positron emission tomography (PET).
Left ventricular function
Global left ventricular function
Quantitative measurements of left ventricular function have the highest value for the clinical assessment of cardiovascular prognosis. However, imaging modalities vary significantly in their ability to provide accurate and reproducible measurements. This ability depends greatly on the mode of acquisition, which determines the type and accuracy of the geometric assumptions used to reconstruct the heart structure and calculate the cardiac volumes.
Cardiac volumes
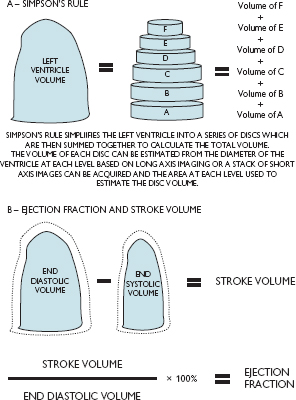
Simpson’s rule is generally used to determine LV volume. It is based on the principle of slicing the LV from the apex to the mitral valve annulus in a series of discs. The volume of each disc is measured and the volumes summed to give the full volume.
Ejection fraction
Left ventricular systolic function is usually assessed using the ejection fraction (EF) which is expressed as the ratio of stroke volume (SV) to end-diastolic volume (EDV):
EF = (SV/EDV) × 100
where SV = EDV − ESV and ESV is the end-systolic volume (Fig. 3.1).
Although ejection fraction is used it can vary with:
 afterload
 preload
 myocardial contractility
 synchrony of the regional contractile pattern
 heart rate.
Quantitative assessment of systolic function
Quantitative assessment of the LV systolic function is usually based on ejection fraction measurements:
| EF >55% |
| EF 54–45% |
| EF 44–36% |
| EF <35% |
 normal systolic function
 mild systolic dysfunction
 moderate systolic dysfunction
 severe systolic dysfunction
Qualitative assessment of systolic function
Qualitative global cardiac function assessment is often used in a clinical setting. An observer subjectively grades LV function as normal, mild, moderate, or severe systolic dysfunction. This widely used method has acceptable correlations with quantitative assessment, but only for experienced readers.
Fig. 3.1 Schematic diagram of the principle of measurement of stroke volume and ejection fraction.
Regional left ventricular function
Wall motion assessment
Regional wall motion influences global left ventricular function and is an independent predictor of outcome in patients with ischaemic heart disease. However, imaging modalities differ significantly in relation to their ability to recognize wall motion abnormalities.
Unfortunately, at present there are no widely used objective quantitative methods to assess regional wall motion abnormalities in any of the imaging methods. Subjective visual grading is the most frequently used approach. Accurate visual grading of regional wall motion, technically one of the simplest aspects of cardiovascular imaging, is actually one of the most complex and difficult tasks for a cardiovascular imager to learn.
Cardiac segment grading
Cardiac segments are graded as follows.
 Normal or hyperkinetic—the LV contour moves concentrically, visible endocardial excursion, normal wall thickening.
 Hypokinetic—reduced wall motion and wall thickening.
 Akinetic—lack of both motion and wall thickening.
 Dyskinetic—outward movement during systole, systolic ventricular wall bulging.
 Aneurysmal—thinned ventricular wall.
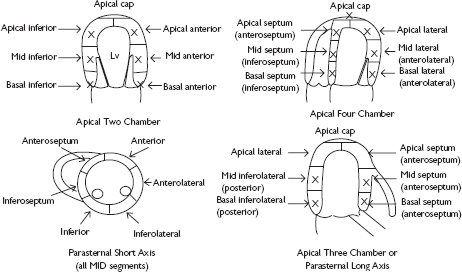
Models containing 17 segments (most modalities) or 16 segments (echocardiography only, according to the American Society of Echocardiography (ASE) guidelines) are usually used for cardiac wall motion assessment (Fig. 3.2). Factors influencing accuracy of wall motion assessment are:
 image quality
 improper alignment of the imaging planes
 cardiac movement
• complexity of LV motion—translational motion of the heart and the descent of the aortic and mitral rings
• tachycardia
• bundle branch blocks
• arrhythmias
• cardiac translational movement.
Diastolic function
Diastolic dysfunction is an important feature of cardiac dysfunction that has proved hard to diagnose or quantify accurately. The basis of diastolic dysfunction is a disorder of relaxation of the myocardium during diastole that leads to inefficient filling of the ventricle. Therefore imaging diastolic function requires an ability to measure movement of the myocardium during diastole or a method of estimating filling of the ventricle.
Fig. 3.2 The left ventricle is divided into 17 segments to allow regional descriptions when reporting variation in left ventricular function. All segments can be assessed using the standard imaging planes, and some segments are seen in multiple planes.
Chest X-ray
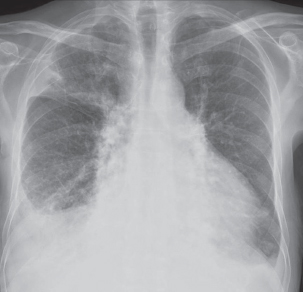
The chest X-ray (Fig. 3.3) has long been the first line assessment of cardiac function. Often the referral for further cardiovascular imaging is based on the conclusions drawn from clinical skills and the chest X-ray.
Advantages of the chest X-ray
 Widely available
 Image of heart and chest in the same view to allow investigation of differential diagnoses.
Disadvantages of the chest X-ray
 Single view without detailed anatomy or information over the cardiac cycle
 Ionizing radiation.
What does the chest X-ray tell us?
The key signs of interest in the chest X-ray to assess cardiac structure and function are:
 size of cardiac silhouette relative to size of thorax—enlarged heart consistent with cardiac enlargement due to heart failure, hypertrophy, or pericardial fluid
 evidence of fluid in the lungs (e.g. upper lobe blood diversion, fluid in fissures, Kerley B lines).
Fig. 3.3 PA chest X-ray. This patient has an increased cardiothoracic ratio suggesting that there may be some form of cardiac pathology such as left ventricular dysfunction, hypertrophy, or pericardial disease.
Echocardiography
Cardiac ultrasound has high spatial resolution and excellent temporal resolution to define left ventricular function, cardiac regional wall thickening, and inward endocardial excursion. Well-established technological advances, such as harmonic imaging and contrast echocardiography, improve image quality in patients with difficult acoustic windows.
Advantages of echocardiography
 High spatial resolution
 High temporal resolution
 Additional structural and physiological information (cardiac, extra-cardiac)
 No ionizing radiation or contrast material needed (but ultrasound contrast agents can be used if required to improve image quality)
 Versatile, widely available, portable, and low cost
 Tissue Doppler and strain analysis allow measures of diastolic function.
Disadvantages of echocardiography
 Poor acoustic windows in some patients
Related posts:
Stay updated, free articles. Join our Telegram channel

Full access? Get Clinical Tree


