CHAPTER 23 Lesion Composition
Composition is an important discriminating characteristic of a radiographic abnormality. The composition of a lesion may be inferred from its echotexture, attenuation, signal intensity, or enhancement pattern. The presence of fluid, fat, hemorrhage, gas, or calcium within an abnormality may dramatically reduce or alter its differential diagnosis. This chapter explores imaging clues to determining lesion composition and the implications of these findings for developing a differential diagnosis.
FLUID
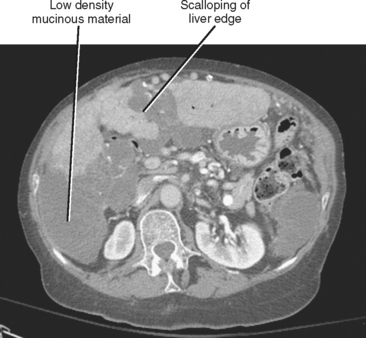
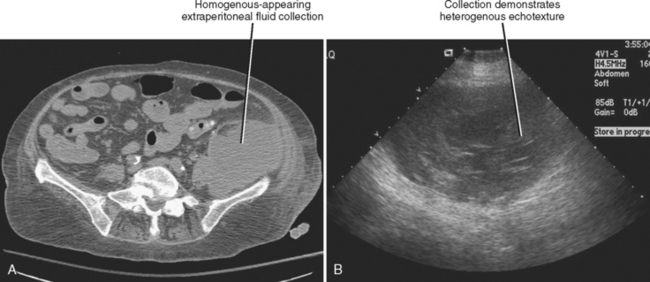
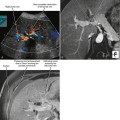
Simple fluid is easily identified on imaging studies. It is typically anechoic with sonography, low attenuation (less than 20 HU) on computed tomographic (CT) images, low signal intensity on T1-weighted MR images, very bright on T2-weighted magnetic resonance (MR) images, and does not enhance after administration of intravenous contrast media. Simple-appearing fluid is most often present in cysts, pseudocysts, seromas, bilomas, urinomas, lymphangiomas, and lymphoceles. The presence of simple-appearing fluid does not confirm benignity, however, because necrotic or cystic neoplasms may contain simple-appearing cystic areas depending on the modality. Furthermore, mucin (a substance produced by a variety of benign and malignant tumors) mimics simple fluid on imaging studies (Fig. 23-1). Therefore, it may be difficult or impossible to distinguish some mucinous neoplasms from nonneoplastic lesions that contain simple fluid. Fluid that appears simple with one modality will appear complex on another modality. For example, ultrasound (US) is often more useful than CT for evaluation and characterization of the internal complexity of cystic structures (Fig. 23-2).
Box 23-1 lists some collections of simple-appearing fluid that may be encountered on imaging studies of the abdomen and pelvis. Table 23-1 lists some ways in which simple peritoneal fluid differs from other types of peritoneal fluid. A variety of processes may alter the attenuation value or signal intensity of peritoneal fluid on CT or MR images, including hemorrhage, leakage of contrast material from the urinary tract or bowel, or even intravenous extracellular contrast media administration (on delayed images).
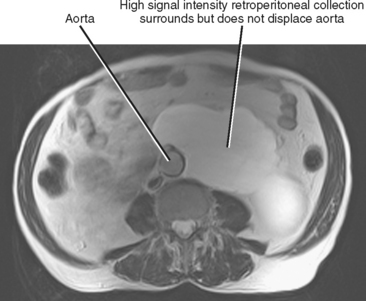
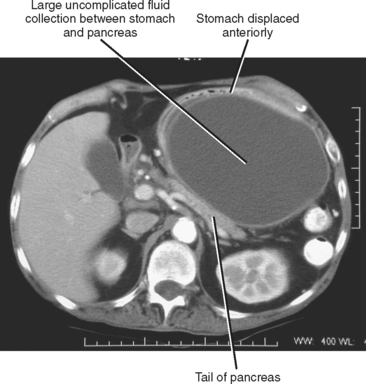
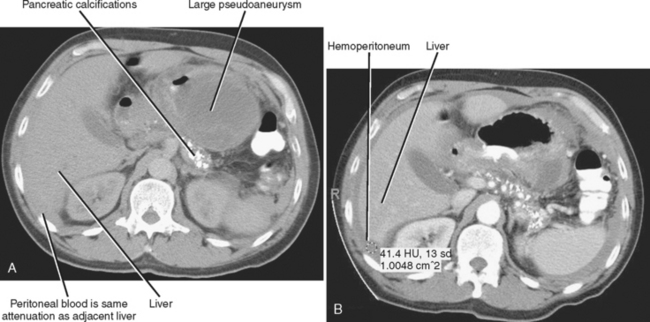
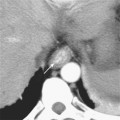
Figure 23-4 Axial enhanced computed tomographic image in a patient with a large pancreatic pseudocyst.
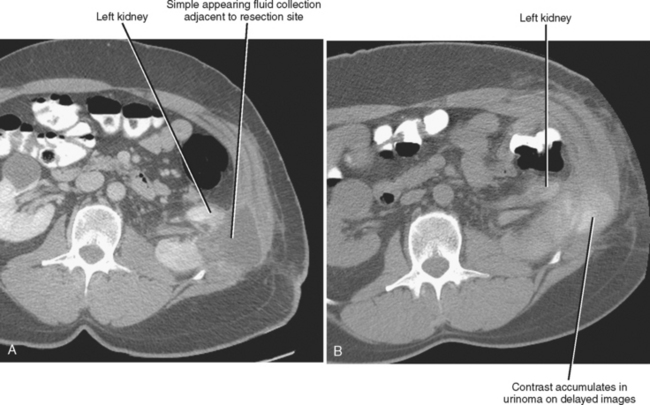
Table 23-1 Differential Diagnosis of Peritoneal Fluid
| Substance | Distinguishing Imaging Features |
|---|---|
| Simple ascites | |
| Bile | |
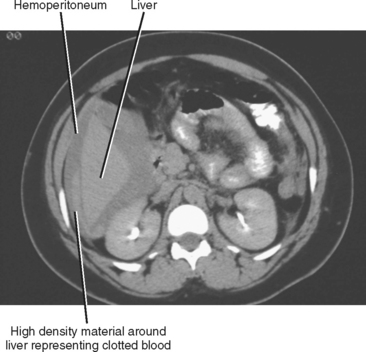
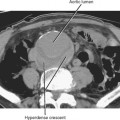
| Hemoperitoneum (Figs. 23-6 and 23-7) | |
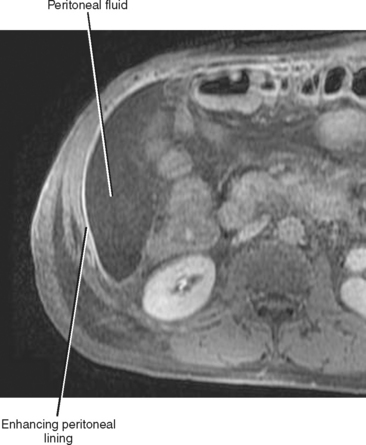
| Infected fluid (Fig. 23-8) | CT/MR: smooth uniform peritoneal enhancement, gas |
| Pseudomyxoma peritonei (see Fig. 23-1) | US/CT/MR: thickening, and nodularity of peritoneal surfaces and omentum, scalloping of serosal surface of liver or spleen, mass effect on bowel |
| Urine | CT/MR: contrast accumulation on delayed enhanced images |
| Dialysate | Dialysis catheter present, intraperitoneal gas |
| CSF (shunt patients) | Shunt catheter present |
| Chylous ascites | CT/MR: Fat–fluid level |
CSF, Cerebrospinal fluid; CT, computed tomography; MR, magnetic resonance; T1WI, T1-weighted imaging; T2WI, T2-weighted imaging; US, ultrasound.
| 0-20 HU | Serous fluid |
| 20-40 HU | Exudate |
| 40-60 HU | Blood |
| >60 HU | Contrast |
These approximations will be altered by the presence of anemia, dilution effects, or ascites.
FAT
Macroscopic fat is usually easy to identify on imaging studies. It is typically echogenic on sonograms and may demonstrate mild acoustic shadowing or sound attenuation. However, this appearance is not specific for fat. For example, a hyperechoic renal mass often represents an angiomyolipoma, although some renal cell carcinomas may have a similar appearance (the latter entity is more likely to have a hypoechoic rim). In addition, fat does not always appear hyperechoic; for example, fat can appear hypoechoic in the anterior abdominal wall beneath the rectus muscles. This occasionally results in confusion with fluid or abscess. Lipomas can occasionally display echogenicity similar to that of muscle.
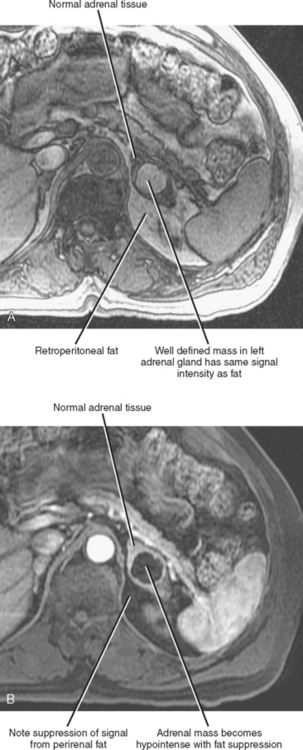
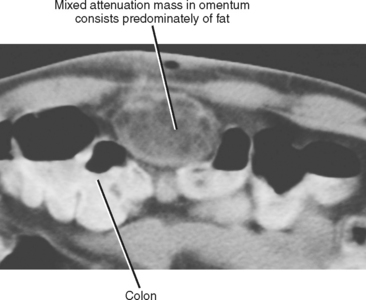
On CT, macroscopic fat appears of low attenuation (less than −220 HU). On T1-weighted MR images, fat appears significantly brighter than most other tissue types. The signal intensity of fat on T2-weighted images varies somewhat with the pulse sequence, although fat is typically bright on long-echo-train spin-echo sequences performed without fat suppression. With MRI, macroscopic fat can be identified by the presence of chemical shift artifact when it shares an interface with soft tissue or fluid. Fat will become dark on T1- or T2-weighted MR pulse sequences that utilize fatsuppression techniques such as short tau inversion recovery, spectral presaturation inversion recovery, fat saturation, or water excitation. Chylous collections within the abdomen may demonstrate fat–fluid levels on CT or MRI scans (Fig. 23-9). Box 23-2 lists some entities of the abdomen and pelvis that may contain macroscopic fat.
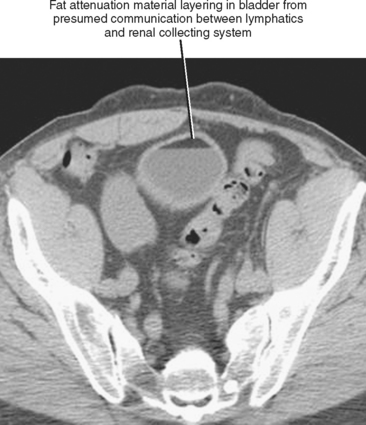
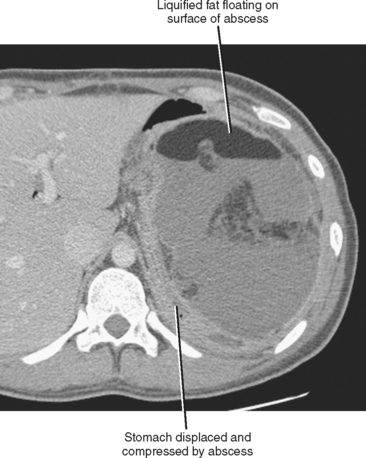
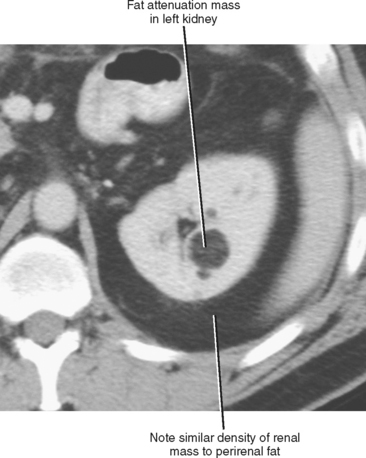
Figure 23-11 Axial enhanced computed tomographic image in a patient with angiomyolipoma of the left kidney.
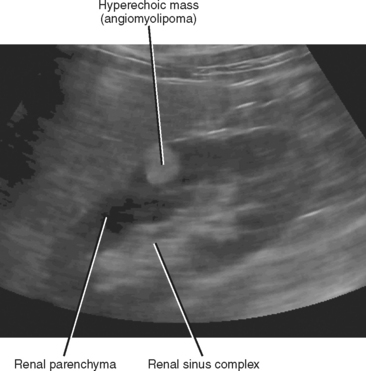
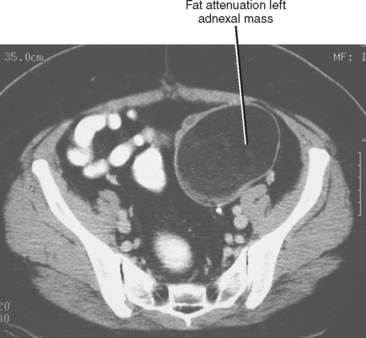
Figure 23-13 Axial enhanced computed tomographic image of a patient with benign cystic teratoma of left ovary.
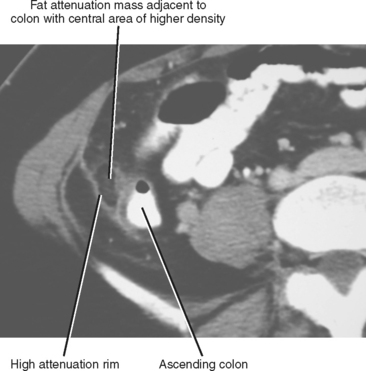
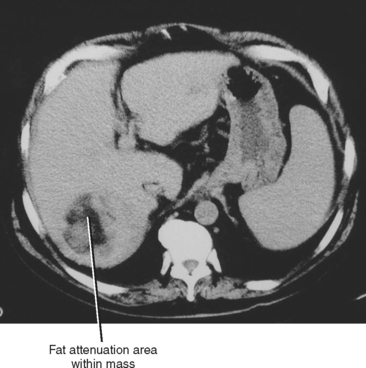
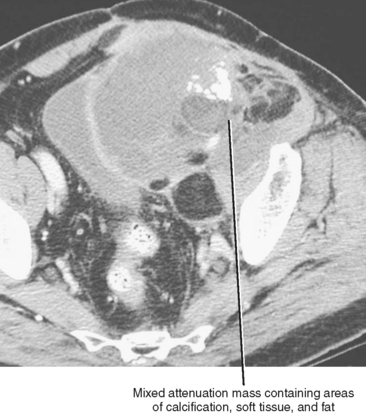
Figure 23-16 Axial enhanced computed tomographic image in a patient with extraperitoneal pelvic liposarcoma.
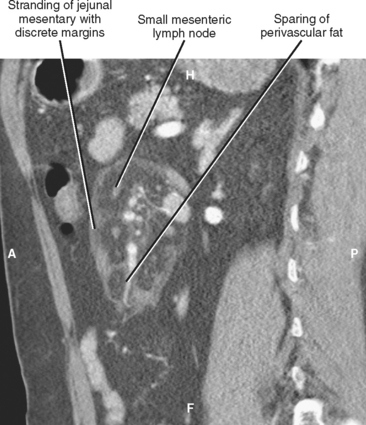
Figure 23-17 Sagittal reformation of an enhanced computed tomographic scan in a patient with mesenteric panniculitis.
Stay updated, free articles. Join our Telegram channel

Full access? Get Clinical Tree


