Fig. 1.
Schematic of a typical TIRF microscope (system 2) and representative images of a cluster of three β-cells under epifluorescent (left) and TIRF (right) illumination.
TIRF microscopy employs an angled excitation laser light and excites fluorophores just beneath a glass-water interface with extremely high vertical spatial resolution. A laser beam, hitting a substance of different refractive index to the one in which it is travelling, bends. In TIRF microscopy, the laser irradiates the specimen at an angle of incidence greater than or equal to the critical angle of refraction whereby the excitation laser light is totally reflected. The reflection generates a very thin electromagnetic field (∼200 nm) in the specimen. This field, called the evanescent wave or field, undergoes exponential intensity decay with increasing distance from the surface. Thus, only those fluorophores within 200 nm of the specimen interface are excited, providing high vertical spatial resolution fluorescence images suitable for studying rapid active biological events. Release of hormones via regulated exocytosis in response to a physiological stimulus is a fast, dynamic and complex process requiring the trafficking of cargo to the plasma membrane, reorganization of the cytoskeleton and actin networks (3–5), and the fusion of vesicles with the plasma membrane through protein recruitment to the soluble NSF attachment protein receptors (SNARE) complex (6). Many diseases, from depression to diabetes, involve perturbations of these processes. Thus, understanding of the behavior of secretory granules at the plasma membrane and of the regulatory molecules involved is an essential goal of modern cell biology.
With high speed data acquisition and ultra sensitive charge-coupled device (CCD) cameras, TIRF microscopy has been used to observe the exocytotic release of glutamate in astrocytes (7), to measure changes in Ca2+ concentration beneath the plasma membrane (8), and to investigate dense-core vesicle behavior (4, 9–13). We have employed TIRF to visualize insulin exocytosis and intracellular Ca2+ and Zn2+ signaling in pancreatic β-cells and here we describe the details of this technique.
2 Materials
2.1 Equipment
There are many types of TIRF configurations including the use of either a prism or illumination “through the lens”; the latter is the most common in molecular biology and requires a ultra high numerical aperture (NA) objective. Here, we describe two configurations used in our laboratories: System 1 a Nikon TIRF microscope and System 2 based on a Zeiss Axiovert microscope. System 1 was largely used to generate the granule movement data described whereas system 2 was used for the plasma membrane divalent cations studies. However, the methods described can be used interchangeably.
2.1.1 System 1: Nikon TIRF Microscope
1.
An ultra high numerical aperture (NA) objective lens (CFI Apo TIRF 100× H, NA = 1.49; Nikon) is mounted on a nosepiece of a Ti-E inverted microscope. Immersion oil (Cargille Laboratories) of a high refractive index (n = 1.515) is used to couple the lens to the glass dish. Excitation laser light from a diode pumped solid-state (DPSS) laser (wave length = 488 nm, 30 mW; Spectra Physics) is introduced to an optical fiber. The light from the optical fiber is focused with two illumination lenses on the back focal plane near the extreme edge of the objective lens. By theoretical calculation, the space constant for exponential decay of the evanescent field was estimated to be 100 nm (see Note 1).
2.
To excite the green fluorescent protein (GFP), or the yellow fluorescent protein (YFP) variant Venus, we use a 488 nm DPSS laser. For imaging of green fluorescence, we use a dichroic mirror (T510LPXRXT, Chroma) which divides the blue and green components of the images. We then use a 515–550 nm band-pass filter (ET535/50m, Chroma) to obtain the green fluorescence component. A computer-controlled electromagnetically driven shutter (VMM-D3J, Uniblitz) is placed between the optical fiber and illumination lenses to prevent photobleaching of the cells between image acquisitions. The shutter is opened synchronously with an electron multiply charge-coupled device (EM-CCD) camera (DU897E-CS0-#BV, Andor Technology) and exposure controlled with MetaMorph software (version 7.7, Molecular Devices).
2.1.2 System 2: Zeiss Axiovert TIRF Microscope
1.
An ultra high numerical aperture objective lens (Apo 100× H, NA = 1.45) is mounted on the nosepiece of an Axiovert 200M inverted microscope. Immersion oil (Olympus) of a high refractive index (n = 1.517) is used to couple the lens to a glass coverslip. Cells are excited using a DPSS laser (473 nm, 80 mW; Crystalaser). Emitted light is separated using a double dichroic (590/22bs), magnified with an 1.6× optovar. For two color imaging, the emitted light is split into two channels using a Dualview (Optical Insights) image splitter with a dichroic cutoff at 585 nm (T585LP) and band-pass filters 595–670 nm (ET630-75) and 485–550 nm (ET517/65M) (all filters from Chroma,). Separate images of the two channels are taken on an iXonEM + EM-CCD camera (Andor Scientific) controlled by Andor IQ software. Images shown are acquired at 20 Hz and 50 ms exposure at 100 nm/pixel. The light from the lasers is focused through a pinhole via two illumination lenses on to the back focal plane near the extreme edge of the objective lens. By theoretical calculation, the space constant for exponential decay of the evanescent field is estimated to be 100 nm (see Note 1).
2.
For high resolution granule movement studies using system 2, we use a higher numerical aperture lens (1.65 NA 100× ApoTIRF, Olympus), special immersion oil with a very high refractive index (n = 1.78 SPI supplies), and TIRF coverslips (035055-9-U990, Olympus).
2.2 Cell Preparation (See Note 2)
2.2.1 MIN6 Cells
1.
Dulbecco’s modified Eagle’s medium (DMEM, high glucose) supplemented with 10% fetal bovine serum (FBS), 100 U/mL penicillin, 100 μg/mL streptomycin, and 30 μM 2-mercaptoethanol.
2.
Phosphate-buffered saline (PBS): pH 7.4, without CaCl2 and MgCl2.
3.
Trypsin 0.25% with 1 mM ethylenediaminetetraacetic acid (EDTA) solution.
4.
Poly-l-lysine (PLL): 1 mg/mL.
5.
Glass-bottom 35-mm dishes treated with PLL in PBS for 30 min.
6.
MIN6 cells (passage # 19–30; a gift from Prof. Junichi Miyazaki, Osaka University, Osaka, Japan) (14).
7.
Lipofectamine 2000 (Invitrogen)
2.2.2 Primary Pancreatic β-Cells
1.
Female CD1 mice age 12–16 weeks.
2.
RPMI 1640 medium: 10 mM glucose and 2 mM glutamine supplemented with 10% FBS, 100 U/mL penicillin, and 100 μg/mL streptomycin.
3.
Ca2+-free buffer: 138 mM NaCl, 5.6 mM KCl, 1.2 mM MgCl2, 5 mM HEPES, 1 mM EDTA, 100 U/mL penicillin, and 100 μg/mL streptomycin, pH 7.35. Alternatively: 0.05% Trypsin/0.02% EDTA.
4.
Type IV collagenase.
5.
Poly-l-lysine (PLL): 1 mg/mL.
6.
Glass-bottom 35-mm dishes or 22 mm coverslips treated with PLL in PBS for 30 min.
2.3 Probes Used for the Labeling of Dense Core Vesicles
2.3.1 Neuropeptide Y Plasmid Used for Labeling MIN6 Cells
Human preproneuropeptide Y (NPY) cDNA lacking a TGA stop codon was amplified by PCR using a forward primer, 5′-GAATTCATGCTAGGTAACAAGCGACT-3′ (primer #1; EcoRI site underlined), and reverse primer, 5′-GGATCCCCACATTGCAGGGTCTTCA-3′ (primer #2; BamHI site underlined), where TGA is replaced by TGG. The PCR product was subcloned into a pCR2.1 vector (Invitrogen). The NPY cDNA fragment lacking a stop codon was cleaved with EcoRI/BamHI and subcloned into the EcoRI/BamHI site of the multiple cloning site of a yellow fluorescent protein variant expression vector (pVenus-N1) (15).
2.3.2 Adenoviral Probe Used for Labeling Primary Cultured β-Cells
Recombinant adenovirus encoding NPY–Venus (NPY–Venus) was prepared using the AdEasy system (16, 17). A DNA fragment encoding fused NPY and Venus cDNAs was generated using PCR with the NPY–Venus plasmid as template. The forward primer, 5′-GTCGAC GACGAGATGCTAGGTAACAAGCGA included a SalI restriction site (underlined) and Kozak sequence (italicized), and the reverse primer, 5′-TGCGGCCGCTTACTTGTACAGCTC, contained the Venus stop codon and a NotI restriction site (underlined). The SalI–NotI fragment, comprising full-length NPY–Venus, was purified and ligated into plasmid pShuttle-CMV under the control of the human cytomegalovirus promoter. Co-transformation of competent RecA+ bacteria (XL1-B) with the above construct and the adenoviral pAdEasy-1 vector generated recombinant adenoviral plasmid, which was purified and transfected into HEK293 cells. The transfected cells were readily monitored through Venus fluorescence, and adenoviral particles obtained by the extraction from the cells 10 days after transfection. The virus was further amplified and purified by centrifugation on a CsCl gradient. Stocks of 109–1010 infectious particles per milliliter were retained and used in experiments. Titration of the virus was performed by infecting HEK293 cells with serially diluted viral stocks, and counting positive cells through Venus fluorescence (18).
2.4 Reagents for TIRF Imaging
1.
Krebs-Ringer bicarbonate (KRB) solution: 125 mM NaCl, 3.5 mM KCl, 1.5 mM CaCl2, 0.5 mM MgSO4, 0.5 mM KH2PO4, 25 mM NaHCO3, 3 mM glucose, and 10 mM HEPES; pH 7.4 equilibrated with 95:5 O2/CO2.
2.
High glucose-containing KRB: KRB with 25 mM glucose.
3.
High-KCl-containing KRB: Stimulation with KCl is achieved by perfusion of 50 mM KCl-containing KRB (NaCl is reduced to maintain the osmolarity).
4.
Trypsin 0.25% with 1 mM ethylenediaminetetraacetic acid (EDTA) solution
5.
Poly-l-lysine (PLL): 1 mg/mL
6.
Glass coverslips and 6-well plates
7.
RPMI medium, supplemented with 10% FBS and 3 mM glucose
8.
2 μM Fura Red-AM: 2 mM stock solution Fura Red-AM in DMSO, diluted in KRB solution, and sonicated for 10 s to ensure resuspension.
9.
3 μM Fluozin-3 AM
3 Methods
3.1 Cleaning and Coating of Glass-Bottom 35-mm Dishes
1.
Clean glass-bottom 35-mm dishes by first placing them into a 500 mL beaker containing 300 mL of Milli-Q water, and then place the beaker in an ultrasound bath for 1 h.
2.
Dip the glass-bottom 35-mm dishes into another 500 mL beaker containing 300 mL of 70% ethanol for 1 h (see Note 3).
3.
Take out glass-bottom 35-mm dishes from the beaker inside a cell culture clean bench, then sterilize them using a UV lamp for 30 min in the clean bench.
4.
Apply 100 μL of PLL solution onto each glass-bottom 35-mm dish.
5.
After 30 min, remove the PLL solution and wash three times with 1 mL of sterile PBS.
3.2 Transfection of Dense Core Vesicle Marker to MIN6 Cells
1.
Culture cells in a 10-cm Petri dish and incubate in 5% CO2 at 37°C.
2.
For TIRF imaging, plate the cells in PLL-coated glass-bottom 35-mm dishes.
3.
Transfect the MIN6 cells with 3 μg of NPY–Venus vector using Lipofectamine 2000 according to the manufacturer’s instructions. All TIRF experiments are performed 2 days after transfection.
3.3 Adenoviral Infection to Primary Pancreatic β-Cells
1.
Preparation of mouse β-cells: For preparation of mouse islets of Langerhans, a detailed isolation procedure by collagenase digestion is described by Ravier and Rutter (19). Briefly, islets are isolated by collagenase digestion of the pancreas of female CD1 mice and selected by hand-picking or histopaque gradient centrifugation. Islets are then cultured in RPMI 1640 for 1 day. Islets are dissociated after incubation in Ca2+-free buffer or Trypsin EDTA for 5 min. After brief centrifugation, the solution is replaced with RPMI 1640, and the islets disrupted by pipetting through a glass pipette. After this procedure, the disrupted cells are then cultured for 1 day on PLL-coated glass-bottom 35-mm dishes or 22-mm coverslips. β-cells are likely to represent 60–80% of the cells in preparations used and can be further selected by identifying by eye the largest cells within the field.
2.
Infection: 1 day before imaging, cells are infected with adenoviruses at a multiplicity of infection of 30–100 infectious particles per cells for 4 h, and then the culture medium is changed.
3.4 Imaging of Exocytosis
1.
Change the culture medium to KRB for 30 min before imaging at 37°C.
2.
Transfer the glass-bottom dishes to the thermostat-controlled heating stage (37°C) of the TIRF microscope (system 1).
3.
Find fluorescent NPY–Venus-expressing MIN6 cells or infected dispersed primary β-cells.
5.
 Introduction: Nanoimaging Techniques in Biology
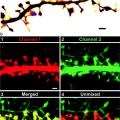 Two-Color STED Imaging of Synapses in Living Brain Slices
 Secondary Ion Mass Spectrometry Imaging of Biological Membranes at High Spatial Resolution
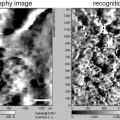 Functional AFM Imaging of Cellular Membranes Using Functionalized Tips
 Correlative Optical and Scanning Probe Microscopies for Mapping Interactions at Membranes
 Nanoimaging Cells Using Soft X-Ray Tomography


Precisely focus on the cell surface.
Related posts:
Introduction: Nanoimaging Techniques in Biology
Two-Color STED Imaging of Synapses in Living Brain Slices
Secondary Ion Mass Spectrometry Imaging of Biological Membranes at High Spatial Resolution
Functional AFM Imaging of Cellular Membranes Using Functionalized Tips
Correlative Optical and Scanning Probe Microscopies for Mapping Interactions at Membranes
Nanoimaging Cells Using Soft X-Ray Tomography
Stay updated, free articles. Join our Telegram channel
Full access? Get Clinical Tree
