Fig. 1.
Spinning disk confocal microscopy images of CHO-K1 cells stably expressing the focal adhesion adaptor protein paxillin conjugated to enhanced-green fluorescent protein (EGFP). EGFP was excited with a 491 nm laser. Images were collected using a 63×/1.4NA oil immersion lens on a Leica DMI6000B motorized inverted microscope (Wetzlar, Germany) coupled to a WaveFX spinning disk confocal (custom-modified Yokogawa CSU10 from Quorum Technologies, Guelph, ON), and detected with a Hamamatsu C9100-12 back-thinned EM-CCD camera (Hamamatsu City, Japan). Images from time points that are 15 min apart are shown. Images were corrected for background intensity and smoothed using a 2 × 2 lowpass filter to remove noise. Brightness, contrast, and the gamma factor were adjusted in MetaMorph software to the same settings for all images within the panel. Scale bars are 10 μm.
Fig. 2.
Wide-field vs. TIRF microscopy images of CHO-K1 cells stably expressing the focal adhesion adaptor protein paxillin-EGFP. Images were collected with a 60×/1.45 NA oil immersion lens on an Olympus IX81 microscope coupled with a TIRF illuminator (Olympus Canada) on a CoolSNAP ES CCD camera (Roper-Photometrics) with no pixel binning and a pixel size of 0.108 μm. Excitation of EGFP was from the 488 nm laser line of a 200 mW argon ion laser at ∼3% laser power with a 5 s exposure time. (a) A wide-field image was taken with the laser beam traveling straight through the sample. (b) A TIRF image was collected with the illuminator adjusted for the critical TIRF angle to produce an evanescent wave illumination. (c) A magnified region showing the TIRF image of one paxillin-EGFP expressing cell. (d) Intensity profile along the white line shown in (c) for the wide-field (solid line) and TIRF (dotted line) images. Note that the reduced background intensity in the TIRF image makes the adhesion intensity peaks stand out within the intensity traces. Scale bars are 10 μm.
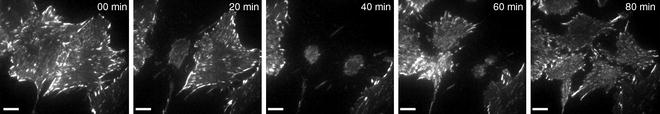
Fig. 3.
Live-cell TIRF images demonstrating cell viability through cell division collected on the same microscope as in Fig. 2. Note that two cells round up, divide, and re-spread on the glass coverslip. Images were collected every minute with 2 × 2 pixel binning (0.216 μm pixels) and a 500 ms exposure time. Scale bars are 10 μm.
Unlike the majority of assays used in research laboratories, live fluorescence microscopy imposes a unique requirement for monitoring sample viability before, during, and after experiments. In this chapter we will present methods for maintaining live, healthy samples to ensure that biological phenotypes are not artifacts of the technique itself. We will also present methods to prepare samples and measure quantitative and reproducible cell migration and adhesion turnover. This chapter will concentrate on imaging mammalian cells; however, most aspects can carry over to any living model system.
2 Materials
2.1 Cell Culture
1.
CHO-K1 cells stably expressing paxillin-EGFP or transiently expressing another fluorescent protein fusion. Avoid highly over-expressing fluorescent proteins as much as possible (see Note 1). For techniques on constructing and expressing fluorescent protein fusions see articles by Spector et al. (32, 33).
2.
DMEM Media (GIBCO 11885-084). Low glucose, with l-glutamine, with 110 mg/L sodium pyruvate, with pyridoxine hydrochloride. To a 500 mL bottle of medium, add 5 mL of nonessential amino acids (Gibco), 5 mL of Penicillin-streptomycin, 50 mL (10%) of fetal bovine serum, and 25 mM HEPES (N-2-Hydroxyethylpiperazine-N′-2-Ethanesulfonic Acid) buffer (see Note 2). For stable fluorescent protein expressing cell lines, add 2.5 mL of G418 100 mg/mL stock of G418 (Geneticin, Gibco 11811-031).
3.
Trypsin-EDTA (Gibco 25200056).
4.
Round 60 mm diameter tissue culture plates.
2.2 Cell Viability Materials
Most dead cell markers rely on cell impermeable dyes that only label cells with a compromised plasma membrane.
1.
Trypan Blue (Molecular Probes, 15250-061) is a visible blue dye that only penetrates dead cells. Cells can be trypsinized and suspended in a solution of Trypan Blue. The total number of cells and the number of dead cells can then be counted using transmission light microscopy.
2.
Hoechst 34580 (Molecular Probes, H21486) will label all cell nuclei fluorescent blue, and membrane impermeable propidium iodide (PI, Molecular Probes, P1304MP) will label dead cells red.
3.
LIVE/DEAD® Viability Kit (Molecular Probes L-3224). Live-cells stain with green fluorescent calcein-AM, indicating intracellular esterase activity, and dead cells stain red with the cell impermeable ethidium homodimer-1.
4.
Alamar Blue (Molecular Probes, DAL1025) provides both a visible (570 nm) and fluorescent (560 nm excitation, 590 nm emission) readout of cellular metabolic activity.
2.3 Live-Cell Imaging Materials
1.
DMEM medium without phenol red (see Note 3), or l-glutamine for live-cell imaging. Prepare as above, and also add 4 mM l-glutamine (Gibco 11054-020).
2.
Glass bottom 35 mm dishes (World Precision Instruments, Sarasota, Florida, FD35-100). For other suppliers of glass bottom dishes see Lacoste et al. (11).
3.
Fibronectin (Sigma Aldrich—F-0895).
4.
Phosphate buffered saline (PBS) (Gibco 10010023).
5.
MitoTracker Red CMXRos (Molecular Probes M-7512).
2.4 Image Analysis Tools
1.
InSpeck Green (505/515) 2.5 μm diameter calibration microspheres (Molecular Probes, I7219)
2.
Fluorescent plastic slides (Chroma Technology Corp., Bellows Falls, VT)
3.
MATLAB (MathWorks, Natick, MA)
4.
MetaMorph Software (Molecular Devices Inc., Sunnyvale, CA)
5.
Microsoft Excel Software (Microsoft)
3 Methods
3.1 Before the Microscope: Cell Culture
Microscopy-based experiments start in the tissue culture room, well before the microscope imaging sessions. Rigorous tissue culture practices and a thorough understanding of the normal physiology and behavior of the cells to be used are required. Entire textbooks are devoted to this topic and anyone practicing tissue culture should consult them (34). A few basic points will be mentioned here. Cells in culture should be kept in log phase during growth (i.e., not split to extremely low densities nor allowed to overgrow so that cells are under stress). Antibiotics should be omitted as much as possible to avoid the development of resistance. For adherent cells, both over- and under-trypsinization should be avoided (see Note 4). Use early passages of cell lines, and avoid environmental shock by minimizing time outside the incubator. Remember such equipment serves to provide the required temperature, humidity, and CO2 necessary for maintaining living and healthy cells. It is important to periodically verify the temperature and CO2 concentrations within the incubator by making measurements that are independent of those built into the incubation system. Buffering the tissue culture media with supplemental HEPES can help minimize the impact of transient CO2 loss (e.g., while passing cells or transporting them to the microscope). As with any supplement that is added to the tissue culture medium, it is important to verify that the addition of HEPES does not introduce any systematic effects on the normal physiology of the cells.
3.2 Monitoring Cell Health Before Imaging
Cells in culture should be checked for viability and health before starting any live-cell experiments. Cells growing in 60 mm tissue culture plates can be examined in a number of different ways.
1.
Cell morphology can be monitored using transmitted light microscopy techniques (e.g., DIC or phase contrast). If cells are forming many irregular plasma membrane bulges (i.e., cell blebbing), have large vacuoles and/or are not adhering well to the tissue culture plate, then they are likely under stress and probably in some stage of necrosis or apoptosis. For some examples, see Figs. 6 and 7 at http://www.microscopyu.com/articles/livecellimaging/livecellmaintenance.html.
2.
Contamination of cells with bacteria, mold, or yeast can be visualized when imaging cells (see Fig. 8 at http://www.microscopyu.com/articles/livecellimaging/livecellmaintenance.html). Conversely, mycoplasma contamination is hard to detect visually so it is best to check all cells in the laboratory on a regular basis (e.g., using commercially available PCR-based detection kits). Cells should be tested every couple of months, or weeks depending on the usage of the tissue culture facility and on the frequency at which contamination is detected. If contamination exists, it is best to obtain new stocks of cells, although drugs are also available to decontaminate precious cell lines if uncontaminated stocks are not available (e.g., Ciprofloxacin).
3.
Nonfluorescent cell viability markers such as Trypan Blue can be used to count the total number of cells and the number of dead cells that take up the dye because of a compromised plasma membranes. Fluorescent viability indicators typically have one dye that will label all cells, such as Hoechst 34580 and one that stains dead cells (e.g., PI). Some newer viability kits even have specific markers for live cells (calcein-AM indicating intracellular esterase activity) and dead cells (cell impermeable ethidium homodimer-1). More subtle markers for cell stress such as autophagy, apoptosis, or reactive oxygen species are also available (Molecular Probes, Promega). For example, Alamar Blue gives a visible and a fluorescence readout that is sensitive to the metabolic activity of cells (Molecular Probes). If the metabolic activity decreases, so do the visible and the fluorescence signals from the dye. The assay can be performed on living cells and tissues with no apparent adverse reaction from the cells, and it gives a linear response relative to cell number and cellular metabolic activity.
4.
Healthy cells have a very dynamic mitochondrial network. During apoptosis, this network collapses into more numerous, enlarged, and isolated mitochondria. Therefore, dyes such as MitoTracker Red CMXRos can be used to visualize the mitochondria before, during, and after imaging the cells. However, take care to titrate the dyes so as to minimize any nonspecific changes in cellular physiology (11).
3.3 Control Experiments
1.
Cellular auto-fluorescence can vary widely between different cell types and tissues so experiments should be repeated under identical conditions with unlabeled cells to determine the extent of auto-fluorescence.
2.
Images of a uniform sample such as a fluorescent plastic slide should be collected for all colors being imaged, in order to correct for any nonuniformity across the image field due to uneven fluorescence illumination (see Subheading 3.9, step 2 for more details). This is particularly important at lower magnifications and with lamp-based wide-field microscopes, but is also important when performing confocal microscopy (35).
3.
For multicolor imaging, it is important to image multicolored fluorescence microspheres to determine if the various detection channels will lead to shifts in the pixel location of objects within the images. These shifts can be minimized by adjusting the alignment of the system (e.g., pinhole, cameras, mirrors, and filters) or the shift can be measured and compensated for during image processing (35). This is especially important when performing co-localization experiments.
3.4 Plating Cells for Migration and Adhesion Assays
1.
Coat 35 mm glass bottom dishes with 2 μg/mL fibronectin for 60 min at 37°C, or overnight at 4°C. Rinse three times with PBS and store the coated dishes with ∼2 mL of PBS in the refrigerator for up to 2 weeks (see Note 5).
2.
Place 2 mL of imaging media (supplemented DMEM with no phenol red) into a fibronectin-coated 35 mm dish.
3.
Maintain cells in culture in a state of exponential growth at all times. If cells are allowed to reach confluency, they will down-regulate their cell migration-related proteins. As a result, when confluent cells are plated at a low density for imaging, they will not migrate due to the absence of the required proteins.
4.
For 60 mm tissue culture plates: Wash the cells twice with 1 mL of trypsin-EDTA (Notes 4). Leave just enough residual trypsin to coat the bottom of the tissue culture plate. Place the plate in the incubator at 37°C for ∼5 min. Gently tap the plate in the tissue culture hood to lift the cells off of the surface. Use 1 mL of imaging medium in a P1000 micropipette (see Note 6) to wash the cells off of the plate and suspend them. Pipette the suspended cells up and down gently a few times to break up any remaining cell–cell contacts.
5.
Place 10 μL of suspended cell solution into a fibronectin-coated 35 mm dish. Mix the cells into the medium by moving the dish gently up and down, and then side to side. Do not mix the cells using a circular motion because they will pool at the edges of the dish. Inspect the cell density visually by using a transmitted light microscope with a 10× or 20× objective lens. Ensure that the cell density is sufficient to have several individual cells in the field of view of a 60× objective lens. If the density is too low, place another 10 μL of suspended cells into the dish and mix. If the density is too high, remove 1 mL of cells and media from the dish. Add 1 mL of fresh imaging media and mix (see Note 7). Alternatively, cells can be counted for this step. Start with 4 × 10⁴ cells and adjust the cell count for an appropriate density.
6.
Healthy cells will begin to spread almost immediately and will spread and start to migrate within 30–60 min (see Note 8). After 2–3 h, the cell motility tends to slow down as cells begin to develop mature adhesions with the fibronectin-coated substrate.
3.5 Live-Cell Imaging Conditions: Tissue Culture on the Microscope
The importance of maintaining proper conditions for live-cell imaging cannot be understated.
1.
Temperature: A stage-top or microscope incubation enclosure should be used and should be turned on at least 1 h prior to experimentation. Some labs leave these systems on 24 h a day to avoid temperature instabilities. In fact, we have observed that a 1°C drop in temperature can stop the beating of mouse embryo hearts (unpublished observation). When using immersion objectives, it is important to also heat the objective lens; otherwise, it will act as a heat sink. Independently verify the temperature of the system occasionally and do not rely solely on the incubation equipment readout. Avoid temperature fluctuations resulting from ventilation within the room.
2.
CO 2 and pH: It is crucial to maintain cellular pH levels, and if possible, to maintain cells in a CO2 environment to maintain carbonate buffering of the medium. In fact, if the medium is not properly buffered, the mitochondrial network collapses within minutes. In addition, a small reduction of CO2 from 5 to 3.5% can halt HeLa cell division within minutes and initiate membrane blebbing shortly thereafter (unpublished observation). Wound healing experiments show that a reduction of CO2 (the 2 should be subscripted) from 5 to 4.5% impaired neuroendocrine-stimulated LNCap cell migration (unpublished observation). It is also important to have an independent measure of the CO2 concentration to verify the readout of the incubation chamber equipment. This is especially important if gas mixers are used with concentrated CO2 gas.
3.
Humidity: The system needs to be maintained at high humidity to avoid evaporation of the medium and changes in osmolarity. Most systems bubble the CO2 gas through water to introduce humidified gas; however, in our experience, the addition of some other aqueous medium within the chamber is necessary. A simple solution is to put wet KimWipes or cotton balls within the chamber.
3.6 Cell Migration Assay
1.
The ideal way to measure cell migration trajectories is to track the center of the cell based on images collected with a 10× or 20× objective lens using a transmitted light technique such as phase contrast or DIC microscopy (10). Once the migration rate is known, the ideal image acquisition time will be two to three times faster than the velocity of migration. For example, if the cells are moving at 1 μm/min, then images should be taken every 20–30 s. There is no need to sample faster than this to determine migration speeds and trajectories.
2.
Cell migration trajectories can also be measured using a 10× or 20× lens and a fluorescence marker, such as paxillin. Paxillin is a good cell marker because it is not a nuclear protein and therefore the nucleus of the cell will appear dark and can be easily tracked. Other cell markers such as free cytosolic EGFP or commercially available plasma membrane markers (Cell Mask, Molecular Probes) could also be used. Cell migration is very sensitive to light exposure, so verifying that migration speeds are similar with transmitted light and fluorescence excitation is a good indicator that the fluorescence light is not causing photo-toxicity. When using fluorescence, it is important to minimize the light exposure to the sample by using the largest time interval between successive images possible. For example, there is no need to image every 10 s if the cells are only moving at 0.2 μm/min.
3.

Cell migration trajectories can also be measured in a fully automated fashion if nuclear markers are used (Fig. 4). Basically, cell nuclei are identified as bright spots within microscopy images and tracked (see further details in Subheading 3.8). However, it is important to be cautious when using any fluorescent probe within a living sample. Our previous studies show that using Hoechst 34580 as a marker results in a marked decrease in cell migration speeds and impaired cell division. (11). Therefore, it is crucial to verify cell migration measurements involving florescence markers against experiments conducted using transmitted light techniques.
Get Clinical Tree app for offline access
Fig. 4.
Cell tracking and Rose plots. CHO-K1 cells were imaged on an Image Xpress Micro high content microscope system (Molecular Devices) using a 20×/0.75 NA Plan Apo objective lens. Images were collected using an EGFP-ET filter cube (Chroma Technology Corp) and a CoolSNAP-HQ camera (Photometrics) with 2 × 2 binning and a pixel size of 0.645 μm. The light source was a Xenon lamp and exposure times were 200 ms with images being collected every 5 min. (a) Cells were stained with a 1 μg/mL concentration of Hoechst (Molecular Probes) nuclear probe. (b) Cells were thresholded using the MetaXpress auto-threshold for light objects feature. (c) The center of each cell’s nucleus was tracked using the track objects module in MetaXpress. Tracks are shown for each of 3 cells over 150 min. Each point in the tracks represents the center of the nucleus for a single image frame. (d) MetaMorph object tracking requires the user to set up two tracking boxes. The inner box is representative of the size of the object (nuclei here) and the outer box is the region within which the nuclei will move during the subsequent image frame. (e) Rose plots were generated from the MetaMorph data using custom MATLAB code; however, any plotting software can be used. The time zero coordinates of the nuclear centers are assigned to x, y
 Histochemical Detection of Lipid Droplets in Cultured Cells
Environmental Scanning Electron Microscopy Gold Immunolabeling in Cell Biology
Histochemical Detection of Lipid Droplets in Cultured Cells
Environmental Scanning Electron Microscopy Gold Immunolabeling in Cell Biology
 Colocalization Analysis in Fluorescence Microscopy
 Atomic Force Microscopy Functional Imaging on Vascular Endothelial Cells
 Imaging Non-fluorescent Nanoparticles in Living Cells with Wavelength-Dependent Differential Interference Contrast Microscopy and Planar Illumination Microscopy
 Environmental Scanning Electron Microscopy in Cell Biology


Related posts:
Histochemical Detection of Lipid Droplets in Cultured Cells
Environmental Scanning Electron Microscopy Gold Immunolabeling in Cell Biology
Colocalization Analysis in Fluorescence Microscopy
Atomic Force Microscopy Functional Imaging on Vascular Endothelial Cells
Imaging Non-fluorescent Nanoparticles in Living Cells with Wavelength-Dependent Differential Interference Contrast Microscopy and Planar Illumination Microscopy
Environmental Scanning Electron Microscopy in Cell Biology
Stay updated, free articles. Join our Telegram channel
Full access? Get Clinical Tree