Fig. 2.1
ARFI liver. Normal value in healthy liver

Fig. 2.2
ARFI liver. High value in cirrhotic liver

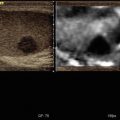
Fig. 2.3
Haemangioma. Higher value in the focal hyperechoic liver lesion (a) in respect to the adjacent liver parenchyma (b)
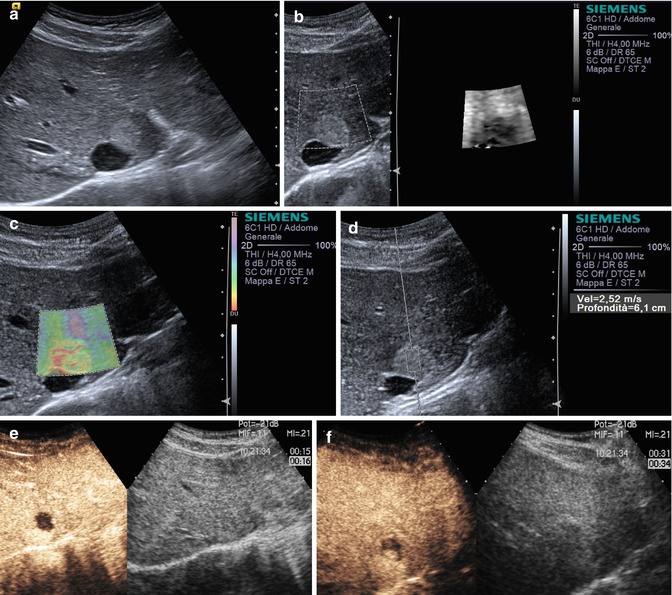
Fig. 2.4
Haemangioma (a–f) complete US study: round-shaped hyperechoic mass (a) resulting stiff (green, yellow and red in c and dark in b) due to sclerosis in the elastogram. At the quantitative ARFI elastography, a velocity value of 2,52 m/s is detected (d). At CEUS the lesion typically shows a globular enhancement in the peripheral area of the lesion in the arterial phase with progressive centripetal fill-in (e and f)


Fig. 2.5
Haemangioma. (a) B-mode ultrasound demonstrates a hyperechoic liver lesion. (b) Colour Doppler ultrasound demonstrates no increased vascularity of the liver lesion in comparison to the surrounding tissue. (c) Contrast-enhanced ultrasound depicted a peripheral nodular enhancement of the tumour in the arterial phases. (d) Contrast-enhanced ultrasound depicted a growing of the peripheral nodular enhancement of the tumour in the portal venous phase. (e) In the late phase, there is still the peripheral nodular enhancement of the tumour visible which matches with a haemangioma with central thrombotic changes. (f) In VTI mode elastography, the haemangioma appears in dark grey indicating a stiff lesion in comparison to the surrounding liver tissue. (g) In VTQ mode, the shear wave velocity was measured in the haemangioma with a velocity of v = 3.30 m/s. (h) In VTQ mode, the shear wave velocity was measured in the liver tissue with a velocity of v = 1.84 m/s. (i) In sonoelastography, the haemangioma appears in red as an indicator for a very stiff tissue. The border of the lesions is displayed well in this technique

Fig. 2.6
Focal nodular hyperplasia. Higher value in the focal liver mass (a) in respect to the adjacent liver parenchyma (b)

Fig. 2.7
Adenoma. In the focal liver mass (a) resulted quite the same values of the adjacent liver parenchyma (b)


Fig. 2.8
HCC. (a) B-mode ultrasound demonstrates a hyperechoic liver lesion in a cirrhotic liver. (b) Colour Doppler ultrasound demonstrates some peripheral vessels adjacent to the lesion but no increased vascularity inside the liver lesion. (c) Contrast-enhanced ultrasound depicted an intense enhancement of the tumour in the arterial phases. (d) Contrast-enhanced ultrasound depicted a washout of the lesion in the late phase and confirmed the suspicion of an HCC. (e) In VTI mode elastography, the tumour appears slightly bright to the surrounding liver tissue. (f) In VTQ mode, the shear wave velocity was measured in HCC with a velocity of v = 2.58 m/s. (g) In VTQ mode, the shear wave velocity was measured in the cirrhotic liver with a velocity of v = 2.19 m/s

Fig. 2.9
HCC in the focal liver nodule is softer (a) and brighter (b) at elastography in respect to the stiff liver cirrhotic parenchyma (c)


Fig. 2.10
HCC. (a) B-mode ultrasound demonstrates a hyper- until isoechoic liver lesion. (b) Colour Doppler ultrasound demonstrates some peripheral and central vessels inside the liver lesion. (c) Contrast-enhanced ultrasound depicted an intense enhancement of the tumour in the arterial phases, in comparison to the surrounding liver tissue. (d) Contrast-enhanced ultrasound depicted a moderate washout of the lesion in the late phase and confirmed the suspicion of an HCC. The histological diagnosis proven by surgery was an HCC. (e) In VTI mode elastography, HCC appears in yellow indicating a less stiffness of the lesion in comparison to the cirrhotic liver tissue. (f) In VTQ mode, the shear wave velocity was measured in HCC with a velocity of v = 1.68 m/s. (g) In sonoelastography, the lesion appears in green as an indicator for a less stiff tissue in comparison to the surrounding cirrhotic liver tissue. The border of the lesions is displayed well in this technique

Fig. 2.11
Hepatocellular carcinoma (a, b) US study: round-shaped hypoechoic liver mass (a) resulting stiff in the centre and inhomogeneously soft in the periphery at elastography (b) due to presence of fibrotic tissue and vessels. (c, d) CT study: typical appearance of a hepatocellular carcinoma, presenting as a hypervascular (c) lesion with washout resulting hypodense with capsule (d) in the late phase

Fig. 2.12
Liver metastasis. Liver nodule is stiffer (a) in respect to the liver parenchyma (b)


Fig. 2.13
Metastatic lymph node at hepatic hilum. (a) A 75-year-old woman with intestine cancer and suspicion of a lymph node metastasis in ultrasound examination. B-mode ultrasound demonstrates an isoechoic lesion adjacent to the liver tissue. (b) Colour Doppler ultrasound demonstrates no increased vascularity of the lymph node metastasis. (c) In VTI mode elastography, the capsular tumour appears in dark grey indicating a stiff tissue, and the centre appears in white as an indicator for soft tissue. (d) In VTQ mode, the shear wave velocity was measured in the liver tissue with a velocity of v = 2.58 m/s. (e) In VTQ mode, the shear wave velocity was measured in the lymph node metastasis with a velocity of v = 2.44 m/s. (f) In sonoelastography, the lesion appears in dark grey as an indicator for a stiff tissue. The border of the lesions is displayed well in this technique


Fig. 2.14
Liver neuroendocrine metastasis. (a) A 55-year-old man with known neuroendocrine tumour of the pancreas and an unclear liver lesion depicted in ultrasound examination. B-mode ultrasound demonstrates a slight hyper- until isoechoic liver lesion. (b) Colour Doppler ultrasound demonstrates some peripheral vessels of the tumour. (c) In VTI mode elastography, the tumour appears in dark grey indicating a stiff lesion in comparison to the surrounding liver tissue. (d) In VTQ mode, the shear wave velocity was measured in the liver tissue with a velocity of v = 1.41 m/s. (e) In VTQ mode, the shear wave velocity was measured in the tumour tissue with a velocity of v = 3.28 m/s. (f) In sonoelastography, the lesion appears in dark grey as an indicator for a very stiff tissue. The border of the lesions is displayed well in this technique. (g) Same patient as Fig. 30–35. High-resolution B-mode ultrasound (9 MHz) demonstrates a slight hyper- until isoechoic liver lesion. (h) Colour Doppler ultrasound demonstrates some peripheral and central vessels of the tumour. (i) Contrast-enhanced ultrasound depicted an intense enhancement of the tumour in the arterial phases, in comparison to the surrounding liver tissue. (j) Contrast-enhanced ultrasound depicted a clear washout of the lesion in the late phase and confirmed the suspicion of a liver metastasis. The histological diagnosis proven by surgery was a metastasis from neuroendocrine tumour. (k) VTIQ velocity colour overlay displayed relative shear wave velocities according to the adjacent colour spectrum, red areas corresponding to higher values and blue areas corresponding to lower values. Shear wave velocity was measured in the metastasis between v = 1.50 and 3.45 m/s and in the surrounding tissue between v = 0.85 and 1.08 m/s. (l) In VTI mode elastography, the tumour appears in dark grey indicating of a stiff lesion in comparison to the normal tissue. (m) In VTQ mode, the shear wave velocity was measured in the metastasis with a velocity of v = 4.04 m/s. (n) In VTQ mode, the shear wave velocity was measured in the liver tissue with a velocity of v = 1.92 m/s. (o) In sonoelastography, the lesion appears in dark grey as an indicator for a very stiff tissue. The border of the lesions is displayed well in this technique

Fig 2.15
Spleen. Normal value of the spleen that result superior to the liver in healthy subjects

Fig 2.16


Spleen nodule. Mainly isoechoic focal splenic lesion absolutely better visible as black because stiffer in respect to the adjacent parenchyma on elastogram
Related posts:
Stay updated, free articles. Join our Telegram channel
Full access? Get Clinical Tree
