Chapter 6
Liver metastases
Ersan Altun1, Mohamed El-Azzazi1,2,3,4, Richard C. Semelka1, and Miguel Ramalho1,5
1The University of North Carolina at Chapel Hill, Department of Radiology, Chapel Hill, NC, USA
2University of Dammam, Department of Radiology, Dammam, Saudi Arabia
3King Fahd Hospital of the University, Department of Radiology, Khobar, Saudi Arabia
4University of Al Azhar, Department of Radiology, Cairo, Egypt
5Hospital Garcia de Orta, Department of Radiology, Almada, Portugal
- Metastases are the most common malignant tumors of the liver.
- The liver, lungs, and bones are the most common sites of metastases in the body.
- Liver metastases usually appear as multiple nodules, but may also appear as a solitary nodule (colon cancer is the primary that has the greatest tendency to result in a solitary metastasis). Multiple nodules may form confluent masses. The presence of diffuse nodular metastases may mimic cirrhotic liver. Isolated infiltrative parenchymal metastatic lesions are also occasionally seen. Isolated infiltrative metastatic lesions may also be seen along the portal tracts and in the porta hepatis.
- Metastasis may be complicated by hemorrhage, central necrosis, or cystic change. Metastases may also contain calcifications, which are most frequently associated with mucinous adenocarcinomas of the colon and ovary, and medullary thyroid carcinoma.
- The presence of diffuse nodular metastases may mimic cirrhotic liver, especially following response to chemotherapy (an appearance most often seen with breast cancer).
- CT features of liver metastases on precontrast images
- Usually seen as hypoattenuating lesions (Figure 6.1)
- May be seen as hyperattenuating lesions if they contain hemorrhage or high protein such as mucin as in hemorrhagic metastases, or mucinous tumors such as ovarian mucinous tumors or mucinous colon carcinoma.
- Calcifications may be seen in the metastases of mucinous adenocarcinoma of the colon and ovary, and medullary thyroid cancer.
- Usually seen as hypoattenuating lesions (Figure 6.1)
- MR features of liver metastases on precontrast sequences
- Mild to moderately high in signal intensity on T2-WIs (Figure 6.2).
- Moderately low in signal intensity on T1-WIs (Figure 6.2).
- High signal intensity on T1-WIs may be seen in various metastatic lesions due to the presence of paramagnetic substances, including extracellular methemoglobin (hemorrhagic metastases), melanin (malignant melanoma) (Figure 6.3), protein (ovarian adenocarcinoma, multiple myeloma, and pancreatic mucinous cystic tumors) (Figure 6.4), and coagulative necrosis (colon adenocarcinoma).
- Mild to moderately high in signal intensity on T2-WIs (Figure 6.2).
- Target sign
- A central area of high signal intensity on T2-WIs and low signal intensity on T1-WIs corresponds to central liquefactive necrosis (Figures 6.2 and 6.5).
- Peripheral rim of tissue with relatively lower signal on T2-WI and relatively higher signal on T1-WI corresponds to viable tumor (Figure 6.5).
- A central area of high signal intensity on T2-WIs and low signal intensity on T1-WIs corresponds to central liquefactive necrosis (Figures 6.2 and 6.5).
- Halo sign
- A central area of lower signal intensity relative to the higher intensity tumor periphery on T2-WI (Figure 6.6) and a central higher signal intensity relative to lower signal intensity on T1-WI.
- The central area corresponds to coagulative necrosis, fibrin, and mucin, while the tumor periphery corresponds to viable tumor cells.
- Seen not uncommonly (approximately 25%), metastases from colorectal carcinoma.
- A central area of lower signal intensity relative to the higher intensity tumor periphery on T2-WI (Figure 6.6) and a central higher signal intensity relative to lower signal intensity on T1-WI.
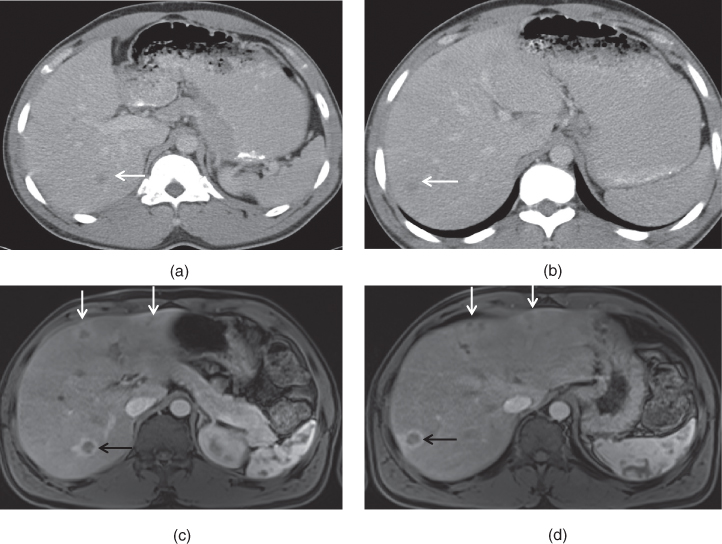
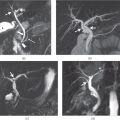
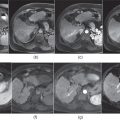
Figure 6.1 Transverse postcontrast hepatic venous phase images (a, b) demonstrate small, ill-defined hypodense enhancing lesions (arrows) in the right hepatic lobe in a patient with colon adenocarcinoma. Transverse postgadolinium hepatic arterial dominant phase T1-weighted fat-suppressed 3D-GE images (c, d) demonstrate the lesions (black arrows) detected in the right hepatic lobe seen on CT. These lesions demonstrate typical peripheral enhancement and are consistent with liver metastases secondary to colon adenocarcinoma. Please note that peripheral prominent enhancement is very well seen on MR images compared to CT. Additional smaller lesions (white arrows; c, d) showing peripheral enhancement are also noted on MRI. Associated wedge-shaped and circumferential parenchymal enhancement are also detected around the lesions on MRI.
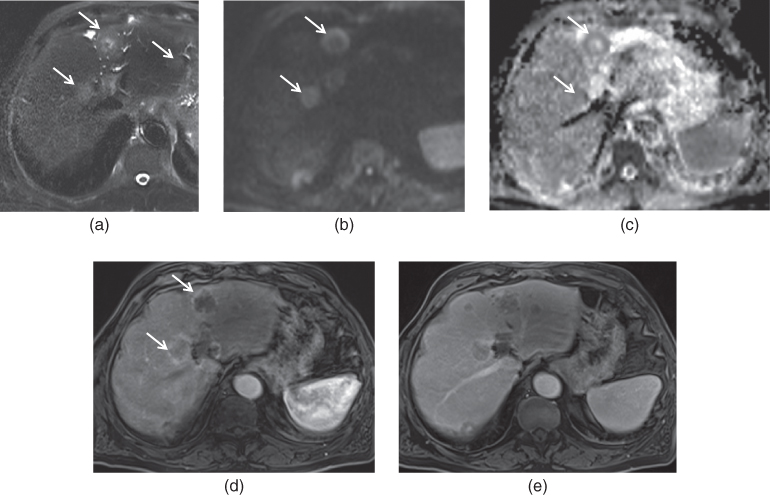
Figure 6.2 Transverse T2-weighted fat-suppressed SS-ETSE (a), diffusion weighted image (DWI) (b), ADC map (c), T1-weighted postgadolinium hepatic arterial dominant phase (d) and hepatic venous phase (e) fat-suppressed 3D-GE images demonstrate multiple hypovascular colon adenocarcinoma metastases (arrows). The lesions show mildly high T2 signal on T2-weighted image (a). Some of these lesions show diffusion restriction on DWI image (b) and ADC map (c). The lesions show peripheral diffusion restriction which is characterized by peripheral high signal on DWI (b) and low signal on ADC map (c). The center of these lesions show necrosis, which does not show diffusion restriction. These lesions show early peripheral enhancement (d) with progressive enhancement in the later phases (e).
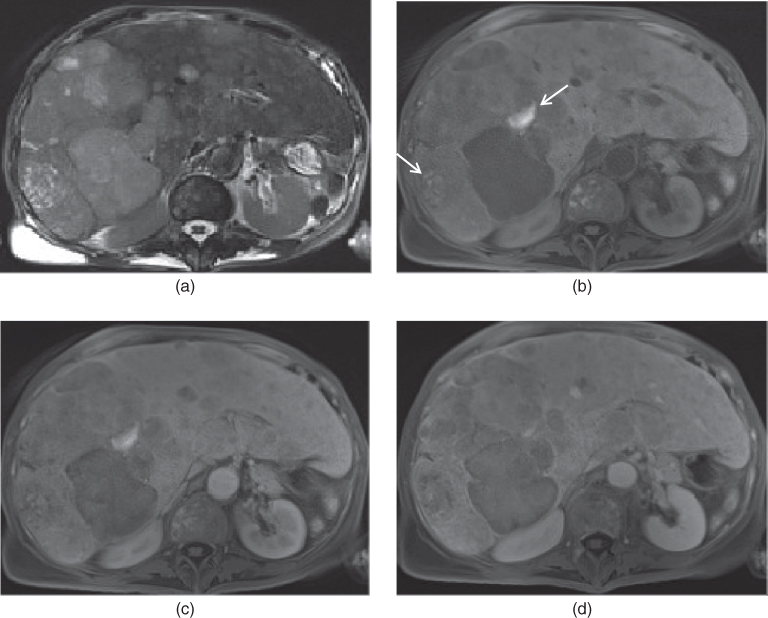
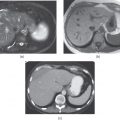
Figure 6.3 Transverse T2-weighted fat-suppressed SS-ETSE (a), T1-weighted fat-suppressed 3D-GE (b), T1-weighted postgadolinium hepatic arterial dominant phase (c) and hepatic venous phase (d) fat-suppressed 3D-GE images demonstrate multiple metastases secondary to ocular malignant melanoma. Multiple lesions showing heterogeneous precontrast signal and enhancement are seen in the liver. Some of these lesions (arrows, b) show precontrast high T1 signal due to the presence of melanin.
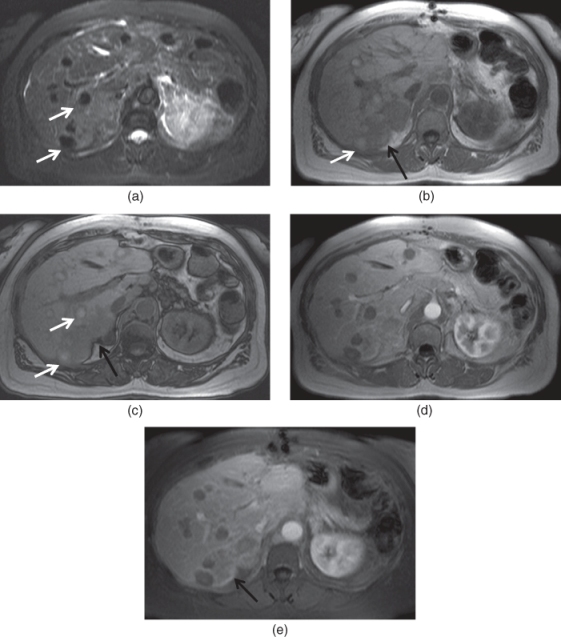
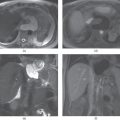
Figure 6.4 Transverse fat-suppressed T2-weighted SS-ETSE (a), T1-weighted in-phase (b), out-of-phase (c) 2D-GE, postgadolinium T1-weighted hepatic arterial dominant phase 2D-GE (d) and fat-suppressed 3D-GE (e) images demonstrate multiple mucinous adenocarcinoma metastases in the liver. The lesions (white arrows) demonstrate low T2 signal and high T1 signal on precontrast images due to high protein content. Mild enhancement is also noted in these lesions. Please note that additional heterogeneously enhancing metastases (black arrows), which do not have high protein content, are also detected in the posterior segment of the liver.
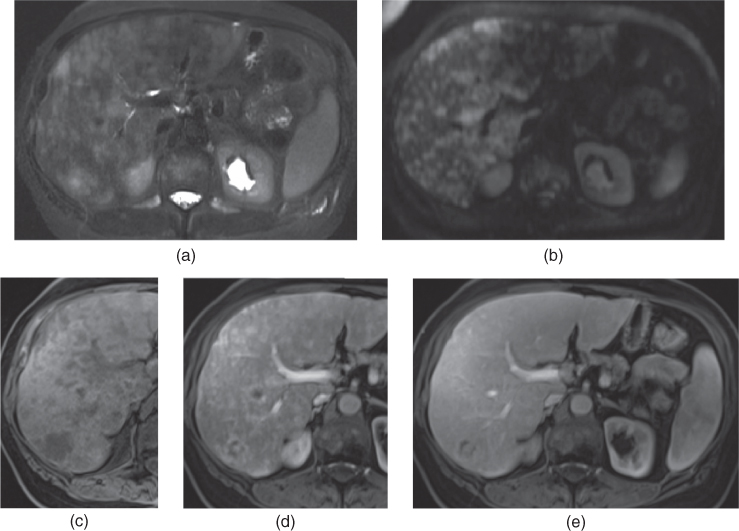
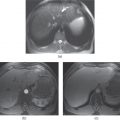
Figure 6.5 Transverse T2-weighted fat-suppressed SS-ETSE (a), diffusion weighted image (DWI) (b), T1-weighted fat-suppressed 3D-GE (c), T1-weighted postgadolinium hepatic arterial dominant phase (d) and hepatic venous phase (e) fat-suppressed 3D-GE images demonstrate multiple hypervascular metastases secondary to breast cancer. The lesions show mildly high signal on T2-weighted image (a) and high signal on DWI (b). The lesions demonstrate progressive enhancement on postgadolinium images and most of them appear isointense to the liver parenchyma on the hepatic venous phase.
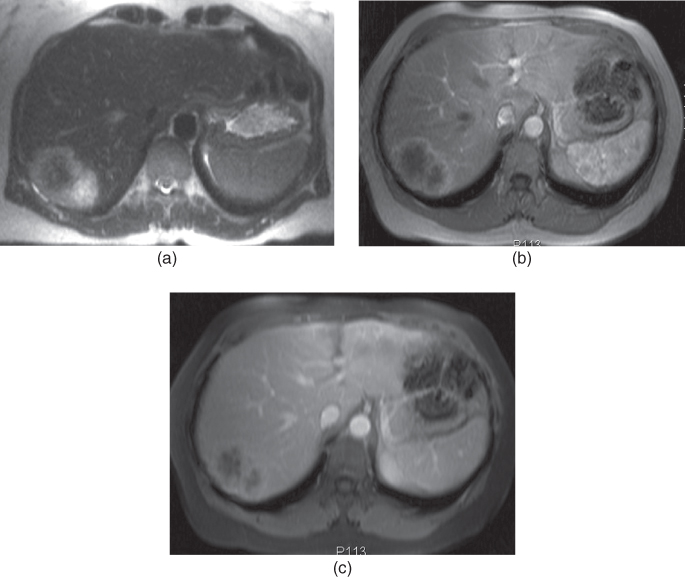
Figure 6.6 Transverse T2-weighted SS-ETSE (a), postgadolinium T1-weighted hepatic arterial dominant phase 2D-GE (b), hepatic venous phase fat-suppressed 3D-GE (c) images show a single metastasis from colon adenocarcinoma. The lesion shows halo sign on T2-weighted image with central low signal and peripheral high signal. The lesion shows typical cauliflower shape and predominant peripheral enhancement, with progressive stromal enhancement on postgadolinium images. Source: Semelka 2010. Reproduced with permission of Wiley.
- Enhancement of metastases on CT and MRI
- Enhancement characteristics of metastases are better defined on MRI than CT, reflecting that MRI is more sensitive to gadolinium contrast than CT to iodine contrast, and MRI is generally performed multiphase, whereas CT with only 1 postcontrast phase, or with fewer phases than MRI, because of radiation concerns.
- The enhancement of metastatic lesions is frequently peripheral (ring type of enhancement) and limited to the outer margins of the lesion (Figure 6.7).
- Perilesional Enhancement
- However, perilesional enhancement may also be seen not uncommonly. The enhancement occurs beyond the margins of the lesion delineated on precontrast images. This is observed most frequently in colon cancer and pancreatic ductal adneocarcinoma.
- Perilesional enhancement may develop due to hepatic parenchyma compression, associated peripheral desmoplastic reaction, inflammatory infiltrates, and neovascularization.
- More common in hypovascular metastases and uncommon in hypervascular metastases.
- Perilesional enhancement may be
- Circumferential:
- May be observed in colon adenocarcinoma metastases (Figures 6.8 and 6.9).
- Wedge-shaped:
- May be seen in metastases from pancreatic ductal adenocarcinoma (Figures 6.9 and 6.10).
- Circumferential:
- Enhancement characteristics of metastases are better defined on MRI than CT, reflecting that MRI is more sensitive to gadolinium contrast than CT to iodine contrast, and MRI is generally performed multiphase, whereas CT with only 1 postcontrast phase, or with fewer phases than MRI, because of radiation concerns.
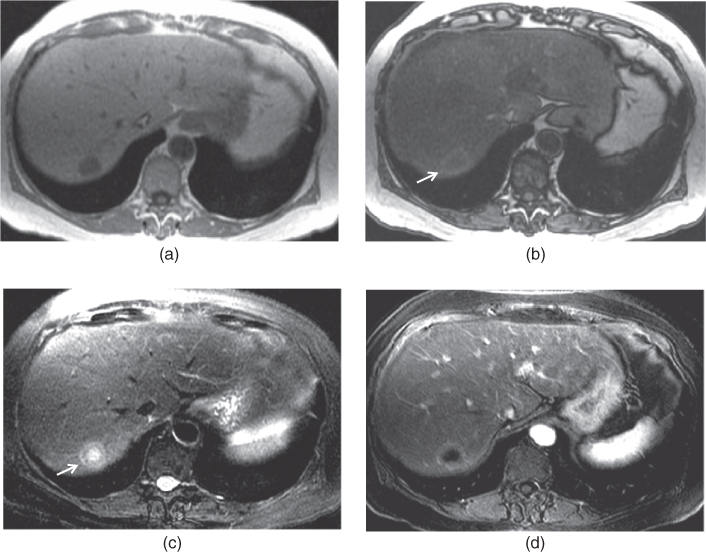
Figure 6.7 Transverse T1-weighted in-phase (a) and out-of-phase (b) 2D-GE, T2-weighted SS-ETSE (c) and T1-weighted postgadolinium (d) images demonstrate a solitary metastasis from breast cancer. The lesion shows target sign on T2-weighted image with a central high T2 signal and peripheral low signal intensity. However, please note that an outer high signal intensity layer is also present around this lesion on T2-weighted image, representing the compressed liver parenchyma. This compressed liver parenchyma appears as a hyperintense halo surrounding the hypointense lesion on out-of-phase image. Although the liver is fatty, the compressed liver parenchyma around the lesion appears as hyperintense halo as it is not capable of depositing fat.
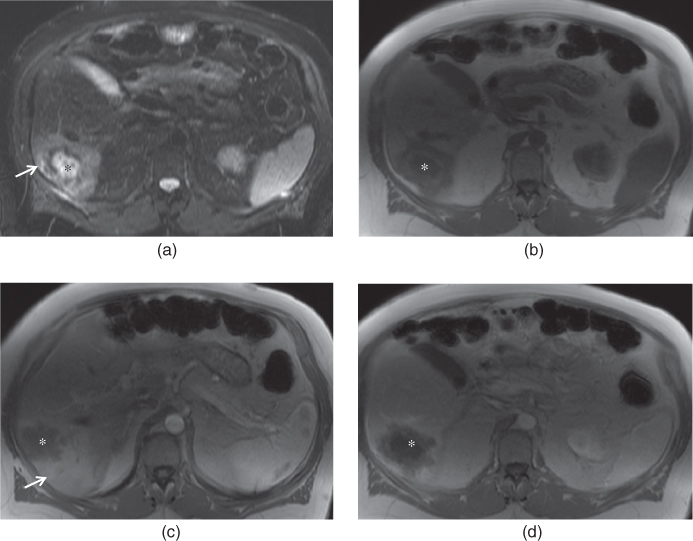
Figure 6.8 Transverse fat-suppressed T2-weighted SS-ETSE (a), T1-weighted 2D-GE (b), postgadolinium T1-weighted hepatic arterial dominant phase (c) and hepatic venous phase (d) images show a liver metastasis (*) from colon adenocarcinoma. The lesion shows target sign on T2 (a) and T1-weighted (b) precontrast images. Perilesional edema (arrow, a) is also noted around the lesion on T2-weighted image. Circumferential parenchymal enhancement (arrow, c) is also seen around the lesion on postgadolinium images.
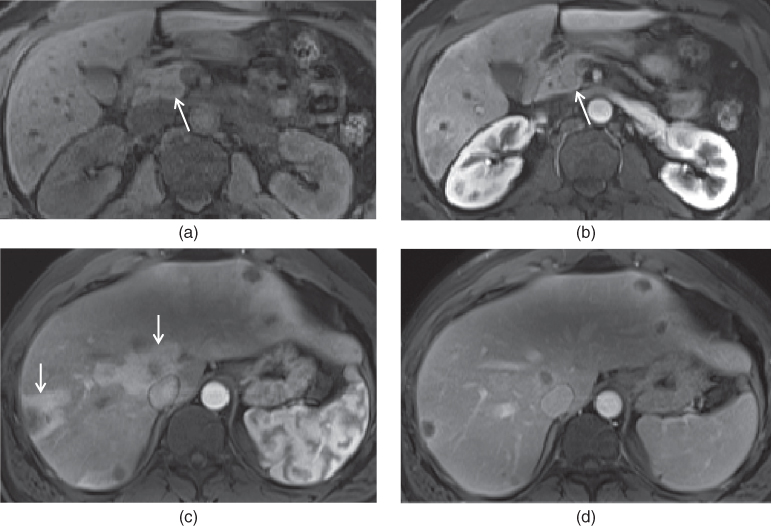
Figure 6.9 Transverse T1-weighted fat-suppressed 3D-GE (a), postgadolinium hepatic arterial dominant (b, c) and hepatic venous phase (d) images demonstrate a small pancreatic adenocarcinoma (arrows; a, b) and multiple liver metastases (c, d). The pancreatic adenocarcinoma is located in the pancreatic head (arrows; a, b). Circumferential and wedge-shaped transient perilesional enhancements are noted around the hypointense metastases on the hepatic arterial dominant phase (c).
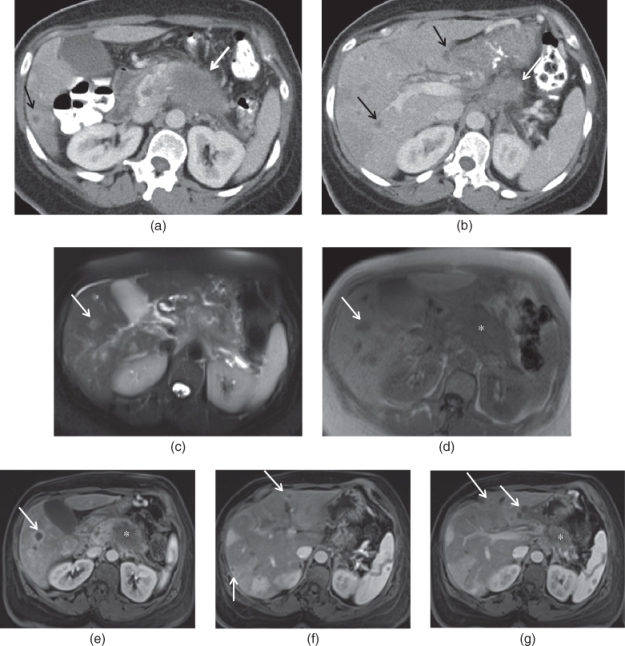
Figure 6.10 Transverse postcontrast hepatic arterial dominant phase CT images (a, b) show a large adenocarcinoma involving the body of the pancreas (white arrows; a, b) and multiple liver metastases (black arrows; a, b). Transverse fat-suppressed T2-weighted SS-ETSE (c), T1-weighted 2D-GE (d), postgadolinium T1-weighted fat-suppressed hepatic arterial dominant phase 3D-GE images (e–g) demonstrate multiple liver metastases (arrows) showing peripheral enhancement and associated wedge-shaped and circumferential enhancement. The pancreatic body adenocarcinoma (*) is seen (d, e, g).
- The pattern of lesional enhancement of liver metastases has a strong association with the size of the lesion.
- Ring enhancement:
- Is the most characteristic appearance of liver metastases.
- Usually seen when the lesion is > 1.5 cm.
- On hepatic arterial dominant phase images, the outer margin of the metastasis (the most vascularized portion) enhances prominently and the inner portion has negligible enhancement (Figures 6.1, 6.2, 6.4–6.8).
- On interstitial phase images, there is an equilibration of enhancement as the contrast gradually reaches the less vascularized central tumor and its interstitial compartment (Figures 6.2 and 6.6).
- The outer margin demonstrates a decrease in the degree of enhancement that may appear as heterogeneous fading to near isointensity (isodensity on CT) or wash-out, and the inner area shows an increase in the degree of enhancement in later phases (Figure 6.11).
- The centripetal enhancement with the wash-out of the outer margin observed in the interstitial phase is highly suggestive of malignancy, and most typical of hypervascular metastases such as carcinoid and neuroendocrine tumors such as gastrinoma (Figure 6.12).
- Is the most characteristic appearance of liver metastases.
- Homogeneous enhancement:
- Usually when the lesion is <1.5-cm (Figures 6.13–6.15).
- Heterogeneous:
- Uncommon.
- Usually when the lesion is >1.5 cm (Figure 6.16).
- Usually reflects necrosis or hemorrhage within the metastases.
- Uncommon.
- Ring enhancement:
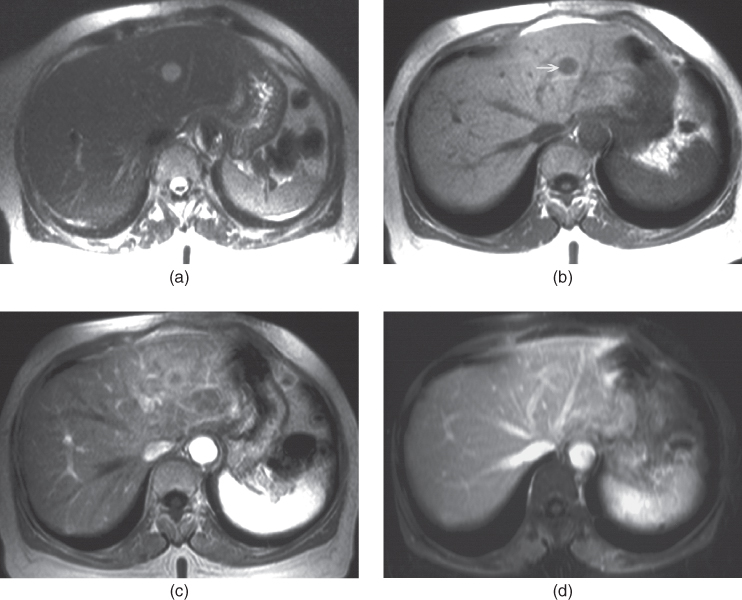
Figure 6.11 Transverse T2-weighted SS-ETSE (a), T1-weighted 2D-GE (b), postgadolinium T1-weighted hepatic arterial dominant phase (c) and hepatic venous phase (d) images show a liver metastasis from colon adenocarcinoma.
Related posts:
Stay updated, free articles. Join our Telegram channel

Full access? Get Clinical Tree


