Fig. 10.1
Arterial Doppler ultrasound waveform showing both early and highest systolic peaks (early and highest systolic peaks may be coincident or not coincident, as represented in this instance)
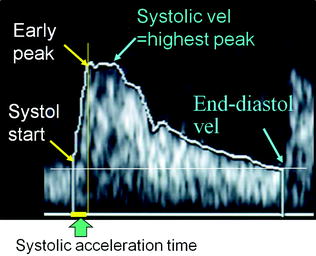
Fig. 10.2
US arterial wave with representation of early and highest peaks. For the measurement of systolic acceleration time, the early peak is to be used. For the measurement of Resistance Index (RI, i.e., systolic velocity minus end-diastolic velocity/systolic velocity), the highest peak is to be used
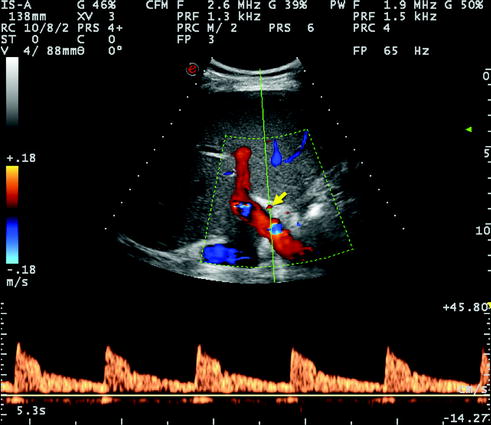
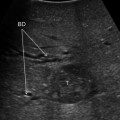
Fig. 10.3
Normal Doppler US waveform of the right hepatic artery detected at its entrance into the right liver lobe, alongside and anteriorly to the right portal branch. The systolic acceleration time is clearly normal (corresponding to a rapid rise of systolic velocity) and the RI is not decreased, namely the end diastolic velocity is relatively low with respect to peak velocity (numeric data not measured in this image)
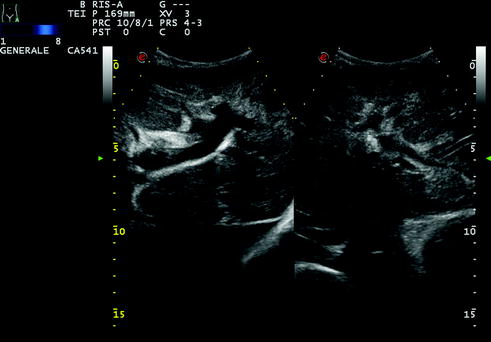
Fig. 10.4
A case of cholangitis with mild bile duct dilatation and inhomogeneous liver echotexture, particularly in the left lobe, visualized through a subcostal epigastric scan. The patient presented with fever and malaise
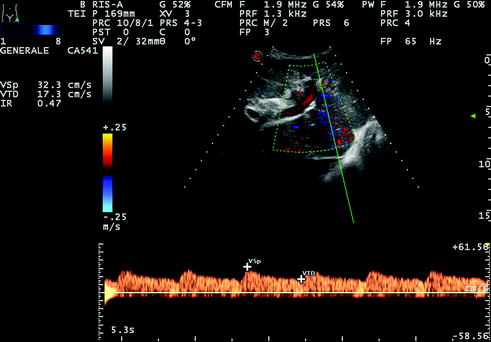
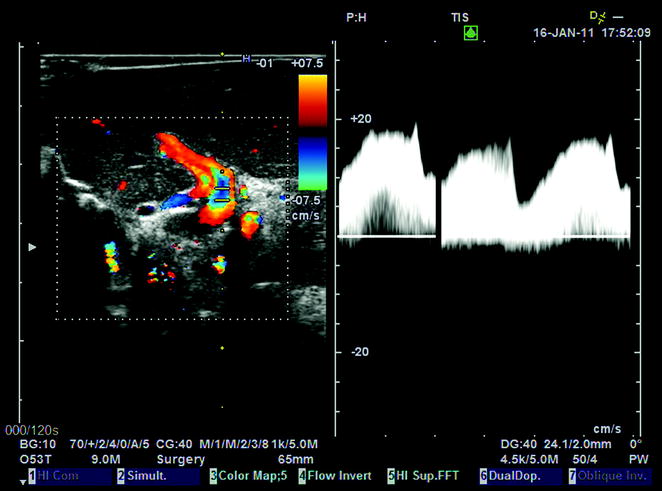
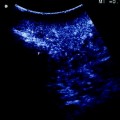
Fig. 10.5
Same case as Fig. 10.4. Right hepatic artery was detectable at both color and pulsed wave Doppler, but showed a ‘‘tardus parvus’’ flow trace, corresponding to a low RI (below 0.50, in this instance RI = 0.47) and prolonged systolic acceleration time (over 100 ms, in this instance 128 ms; data not shown)
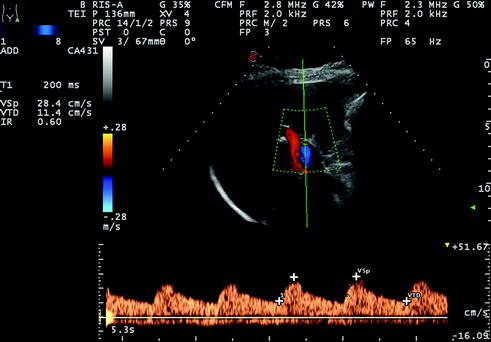
Fig. 10.6
Hepatic artery tracing with normal RI (0.60) but prolonged acceleration time (T1 = 200 ms) detected12 years after LT
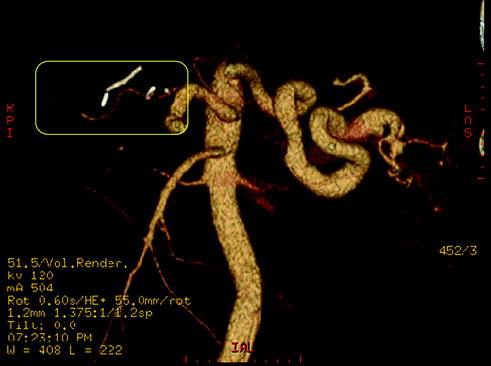
Fig. 10.7
Same case as Fig. 10.6. Angio CT shows elongated narrowing of the proper hepatic artery due to atherosclerosis (yellow frame)
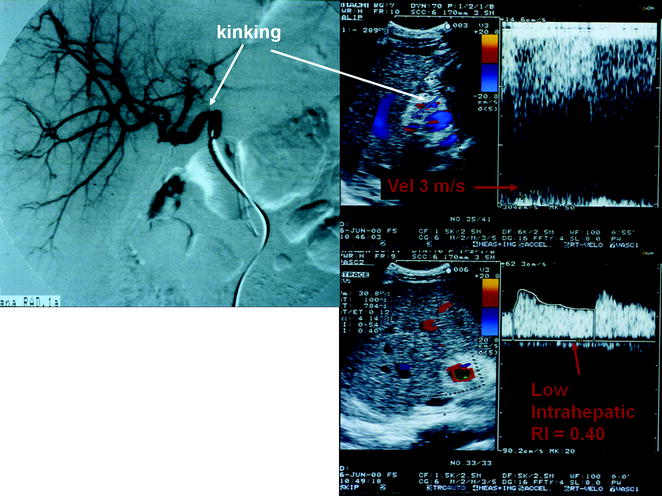
Fig. 10.8
A case of kinking of the hepatic artery shown by angiography (on the left) determining a hemodynamic stenosis indicated by Doppler US (on the right), with downstream tardus parvus waveform (RI = 0.40), and markedly turbulent and accelerated flow at the site of kinking (peak flow velocity approximately 3 m/s)
10.1.1 Thrombosis
Absent arterial flow in all arteries on a technically adequate Doppler imaging study is nearly always indicative of thrombosis. False positives may occur due to severe hepatic edema, systemic hypotension, or in a suboptimal ultrasound study. Reduced flow, whether secondary to spasm or to low cardiac output, can also cause non visualization of flow at Doppler US. A loss of diastolic flow or diastolic flow reversal has been suggested as a sign of impending thrombosis [5, 6], especially if it occurs in the main HA.
Microbubble contrast material-enhanced US may help to improve flow visualization in the HA [7]. In patients in whom no flow is identified in the HA, angiography, computed tomography (CT), or magnetic resonance (MR) angiography are usually required to definitely diagnose thrombosis. The treatment of HA thrombosis usually consists of emergent thrombectomy or retransplantation.
10.1.2 Stenosis
HA stenosis occurs in 2–11 % of transplantations [8, 9]. The most common site of stenosis is the anastomosis, which is often difficult to detect by US, being frequently obscured by bowel. In the very early postoperative period (<72 h after transplantation), increased HA RI (>0.8) is frequently observed, although it usually returns to normal within a few days [10]. Increased RI is associated with fibrotic livers and a prolonged period of ischemia [10]. HA stenosis may be treated with percutaneous angioplasty or surgical intervention [11].
10.1.3 Pseudoaneurysms
HA pseudoaneurysm is an uncommon complication and can be classified as either extrahepatic or intrahepatic. Extrahepatic pseudoaneurysm most commonly occurs at the arterial anastomosis or arises as a complication of angioplasty, whereas intrahepatic pseudoaneurysm may result from percutaneous biopsy, biliary procedures, or infection [12, 13].
A pseudoaneurysm is identified on US as a cystic structure in communication with the HA with a disorganized ‘‘to and fro’’ color and spectral Doppler pattern as the arterial blood flows into and out of the pseudoaneurysm (Fig. 10.9).
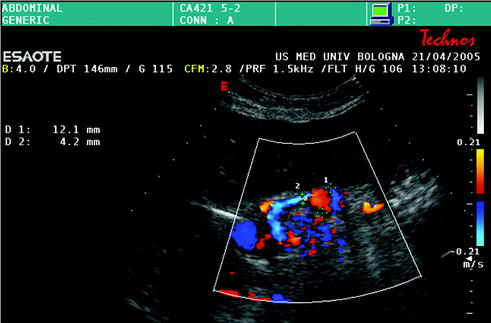
Fig. 10.9
Hepatic artery aneurysm, close to the anastomotic site (diameter of the hepatic artery = 4 mm, maximum diameter of the dilated tract = 12 mm)
US detection of a fluid collection near the arterial anastomosis requires further evaluation with pulsed Doppler US to rule out pseudoaneurysm. Contrast-enhanced CT demonstrates a focal lesion with central enhancement that follows arterial blood-pool attenuation. Treatment consists of embolization for both types of aneurysms, as well as stent placement or surgical resection for an extrahepatic pseudoaneurysm [13, 14]. A ruptured intrahepatic pseudoaneurysm can lead to a portal or biliary fistula.
10.1.4 Arterioportal Fistula
Intrahepatic arterioportal fistula is usually secondary to liver biopsy of other invasive procedures. On US, the inflowing hepatic arterial RI will be lower than the contralateral normal vessel on the opposite side. In addition, reversed flow in particular portal vein (PV) radicals (considered a rare finding), arterialized PV waveform as well as a focus of turbulence with aliasing at the site of the arterioportal fistula can also be seen [12, 15–17].
10.2 Portal Vein Complications
In orthotopic whole LT, the PV anastomosis is usually performed in an end-to-end fashion between the donor and the recipient portal trunks (Fig. 10.10). In split grafts, the anastomosis is usually performed between the donor and recipient right or left portal branches. In the case of preoperative PV thrombosis and/or portal hypoplasia, PV thrombectomy (Fig. 10.11) and anastomosis on different recipient sites are possible solutions. In this latter case, the anastomosis can be performed on enlarged tributaries of the PV, on the superior mesenteric vein through a donor vascular graft, on the left renal vein or on the recipient inferior vena cava (IVC) (cavoportal hemitransposition). PV complications are less common than arterial complications. They occur in 1–13 % of whole transplantations, and include thrombosis and stenosis [18]. Technical errors, insufficient thrombectomy, discrepancy between the sizes of the donor and recipient PVs, hypercoagulable state, and insufficient flow due to spontaneous portosystemic shunts are the main causes of complications [18]. Intraoperatively, a scarce portal flow can be increased with ligation of collaterals of PV or of the left renal vein, in order to reduce the flow through portosystemic shunts. Postoperatively, angioplasty, thrombolysis, thrombectomy, redo anastomosis or retransplantation can be required.
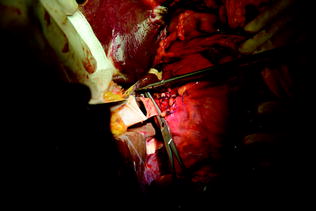
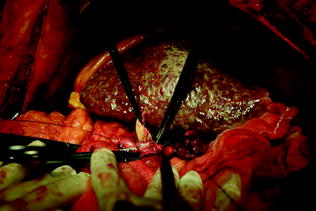
Fig. 10.10
End-to-end portal vein anastomosis in orthotopic whole LT
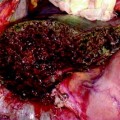
Fig. 10.11
Thrombectomy for partial occlusion of the portal vein during LT
In split LT, the use of small-for-size grafts (especially left-sided grafts) is often associated with liver congestion and dysfunction. This condition is attributable to excessive portal flow in relationship with the reduced hepatic mass, causing endothelial disruption, and secondarily parenchymal injury with cholestasis. The portal flow can be reduced with splenic artery ligation, splenectomy, or creation of a hemi-portocaval shunt (Figs. 10.12, 10.13, 10.14).
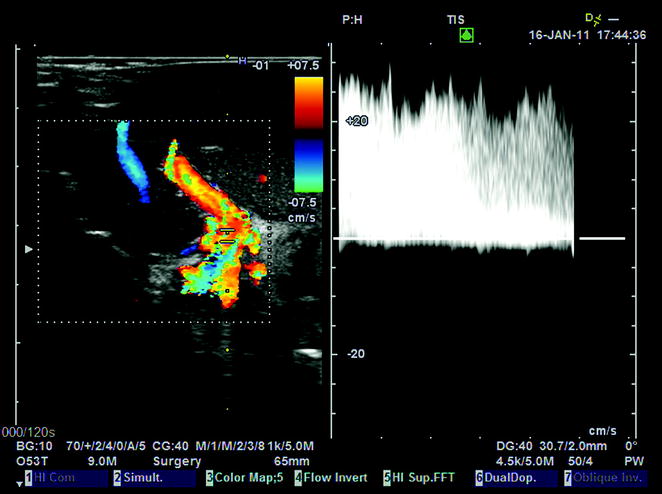
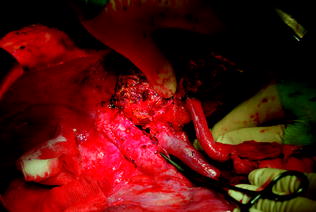
Fig. 10.12
Portal flow of 25 cm/s, associated with congestion of a left lobe graft (segments II–III), a few minutes after portal reperfusion, due to portal hyperflow in a small-for-size graft
Fig. 10.13
Same case as Fig. 10.12. A hemi-portocaval shunt between the recipient right branch of the portal vein and the inferior vena cava (IVC) is shown in this surgical field. The creation of the shunt was mandated following persistence of graft congestion and excessive portal flow not withstanding the attempt to resolve this circulatory abnormality by splenic artery ligation
10.2.1 Thrombosis
On US, there is either total absence of flow in the PV on color Doppler, or a mass filling in a portion of the PV and partially occluding it. Contrast-enhanced CT or MR appearance is similar. In the acute phase, the vessel is distended. Subsequently, PV tends to narrow and scar, while the thrombus becomes more echogenic. Hematoma or fluid collections can cause the PV compression, with symptoms similar to thrombosis and absence of PV visualization on US.
10.2.2 Stenosis
PV stenosis usually occurs at the anastomosis [19] (Figs. 10.15, 10.16, 10.17). US findings include peak anastomotic velocity higher than 125 cm/s or an anastomotic-to-preanastomotic velocity ratio of 3:1 [20] (Figs. 10.16, 10.17). Focal narrowing of the PV on US, CT, or MR may represent discrepancy between donor and recipient PV vein size, or may indicate a true stenosis [19].
Get Clinical Tree app for offline access
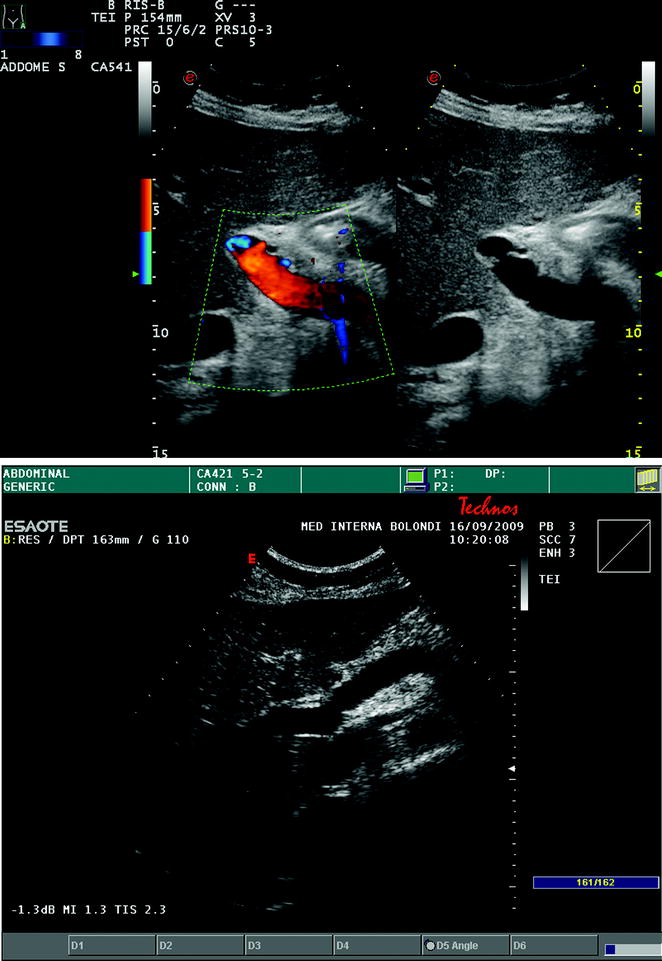
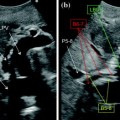
Fig. 10.15
Visualization of the end-to-end portal vein anastomosis after LT through an intercostal transcutaneous approach, which appears as white indentations along the main portal trunk at conventional gray-scale US (a frame on the right), and not producing any change in flow velocity, as depicted by color Doppler US (b frame on the left). In another case, the portal anastomosis is visualized through a right upper abdominal quadrant subcostal approach (b)
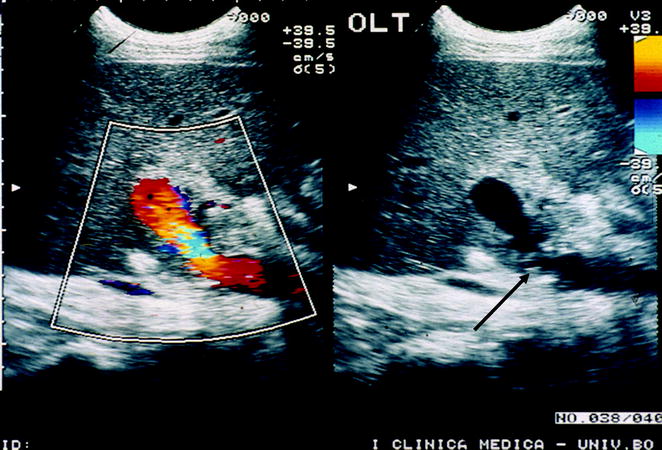
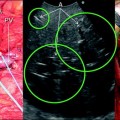
Fig. 10.16
Flow disturbance with turbulences (indicated by the aliasing phenomenon, corresponding to the mixture of blue, yellow, and red colors at color Doppler in the left frame) at the site of lumen narrowing at the portal anastomotic site (black arrow, right frame) and immediately downstream from it. In this instance, a pulse Doppler flow trace sampling is mandatory to ascertain whether a focal acceleration occurs (over × 3–4 the upstream velocities), suggesting a hemodynamic stenosis
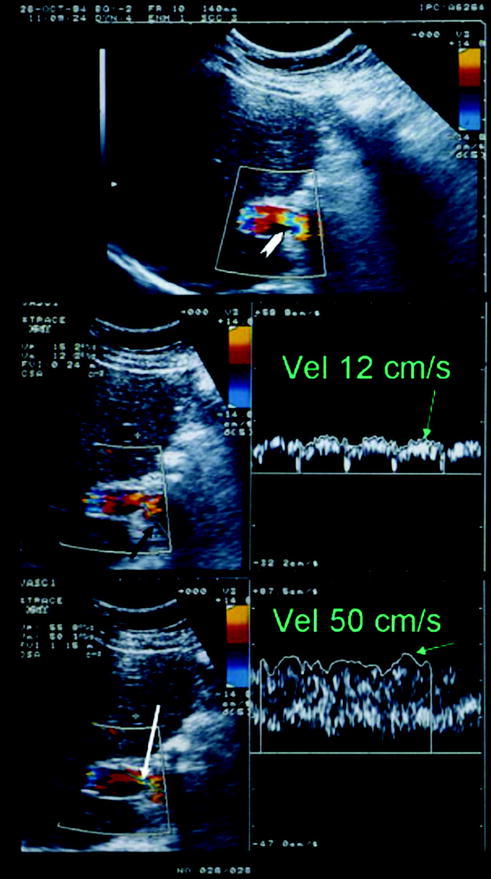
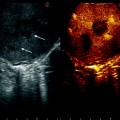
Fig. 10.17
Portal vein flow in the case of hemodynamic stenosis. White arrow
 Liver Transplantation from Living Donors
 Technical Tricks to Start Exploring the Liver with Ultrasound
 Diagnosis and Staging: Contrast-Enhanced Intraoperative Ultrasound (CEIOUS) Using Intravascular Contrast Agents
 Intraoperative Cholangio Ultrasound in the Study of the Biliary Tree
 Technological Requirements for Ultrasound-Guided Liver Surgery
 Exploring the Liver by Ultrasound Along its Anatomy


Related posts:
Liver Transplantation from Living Donors
Technical Tricks to Start Exploring the Liver with Ultrasound
Diagnosis and Staging: Contrast-Enhanced Intraoperative Ultrasound (CEIOUS) Using Intravascular Contrast Agents
Intraoperative Cholangio Ultrasound in the Study of the Biliary Tree
Technological Requirements for Ultrasound-Guided Liver Surgery
Exploring the Liver by Ultrasound Along its Anatomy
Stay updated, free articles. Join our Telegram channel
Full access? Get Clinical Tree
