Fig. 8.1
Automated CT volumetry. (a) The entire outline of the liver can be automatically drawn by computer-aided liver segmentation, attributed to the attenuation difference between the liver and the surrounding structures on portal venous phase CT. The liver volume then can be calculated by the summation of the enclosed areas multiplied by slice interval. However, whereas the blood volume is included on CT volumetry, the blood-free liver weight is of interest to assess the functioning hepatic mass in the clinical setting. (b) Liver vessel can be also identified by interactive optimized thresholding to include the vessels identified on axial CT scans as much as possible while excluding the parenchyma. (c) After inputting the resection lines, blood-filled and blood-free (red color) volumes of right hepatic lobe can be automatically calculated
8.5.2 Estimation of Hepatic Steatosis
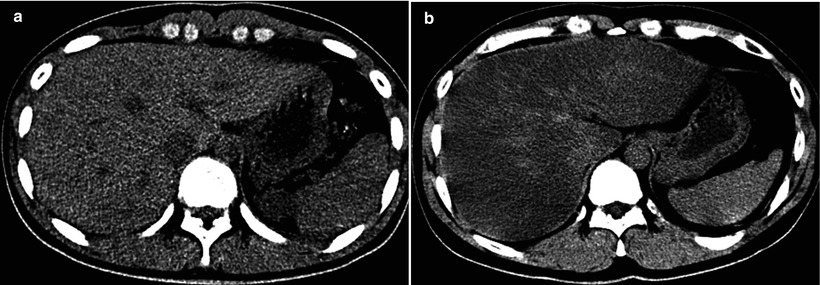
Fig. 8.2
Estimation of hepatic steatosis. (a) On unenhanced CT scan, the attenuation of the hepatic parenchyma is apparently higher than that of hepatic vessels. The degree of macrovesicular and microvesicular steatosis was less than 5 % on histopathologic examination of the liver biopsy specimen. (b) In contrast to (a), the attenuation of the hepatic parenchyma is apparently lower than that of hepatic vessels on unenhanced CT scan. The degree of macrovesicular steatosis was more than 30 % on histopathologic examination of the liver biopsy specimen
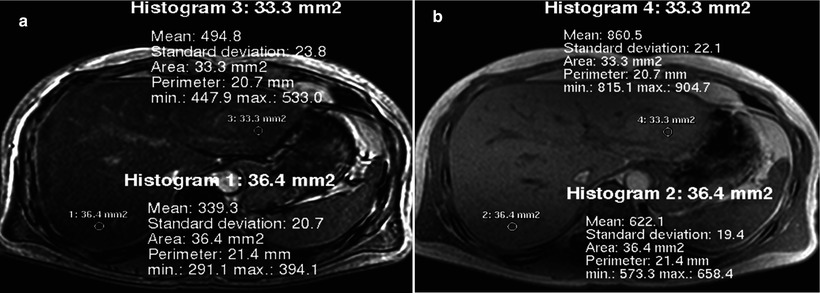
Fig. 8.3
Estimation of hepatic steatosis. (a, b) Opposed-phase (a) and in-phase (b) MR images obtained at 1.5 T show diffuse signal intensity loss on opposed-phase image compared with in-phase image, due to cancellation of fat signal (Sfat) and water signal (Swater). Because of the phase interference between Sfat and Swater, the in-phase signal (SI) and out-of-phase signal (SO) can be summarized with the following equations: SI = |Swater + Sfat|, SO = |Swater − Sfat|. Fat signal fraction, defined as Sfat divided by sum of Swater + Sfat, can be calculated with the following equation: Fat signal fraction = SI − SO/2SI; in this case for right lobe, (622 − 339) ÷ (2 × 622) = 23 %. The degree of steatosis in the right lobe was 40 % in total and 30 % of macrovesicular steatosis on histopathologic examination of the liver biopsy specimen
8.5.3 Evaluation of Vascular and Biliary Anatomy
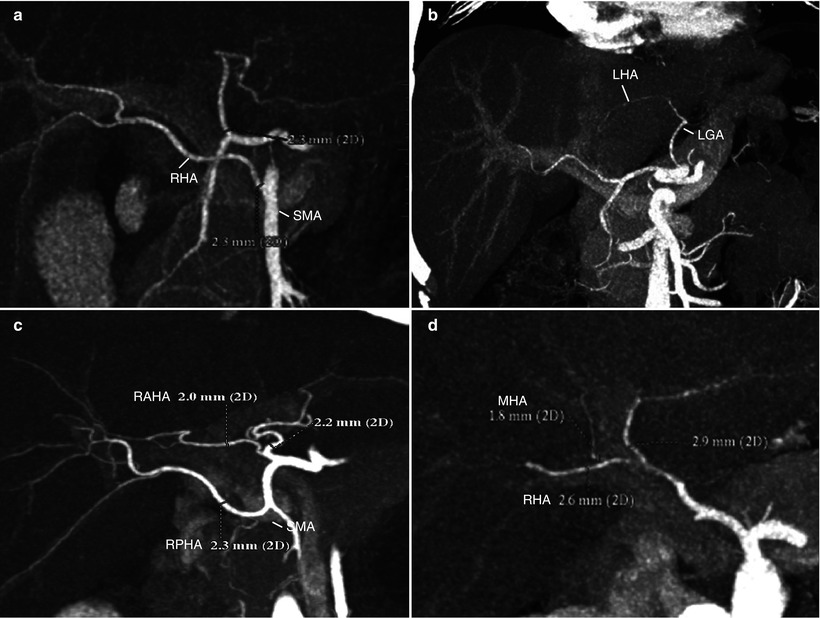
Fig. 8.4
Evaluation of vascular anatomy: hepatic artery (HA) variations. (a, b) The two most common HA variations are aberrant origin of right HA (RHA) from superior mesenteric artery (SMA) (a) and aberrant of left HA (LHA) from left gastric artery (LGA) (b). A single graft arterial trunk can be created on the back-table for anastomosis to the recipient HA in case of cadaveric whole liver transplantation. They have little significance in live liver donors because neither right nor left hemihepatectomy is affected by these variations. (c) If a donor has HA variation with separate origin of right anterior HA (RAHA) and right posterior HA (RPHA), two HA anastomoses may be made unless there is evidence of intrahepatic communication between the HA’s. (d) A care must be taken when there is middle HA (MHA) originating from the RHA, not to disrupt arterial supply to the left medial segment (S4) during the right lobe procurement
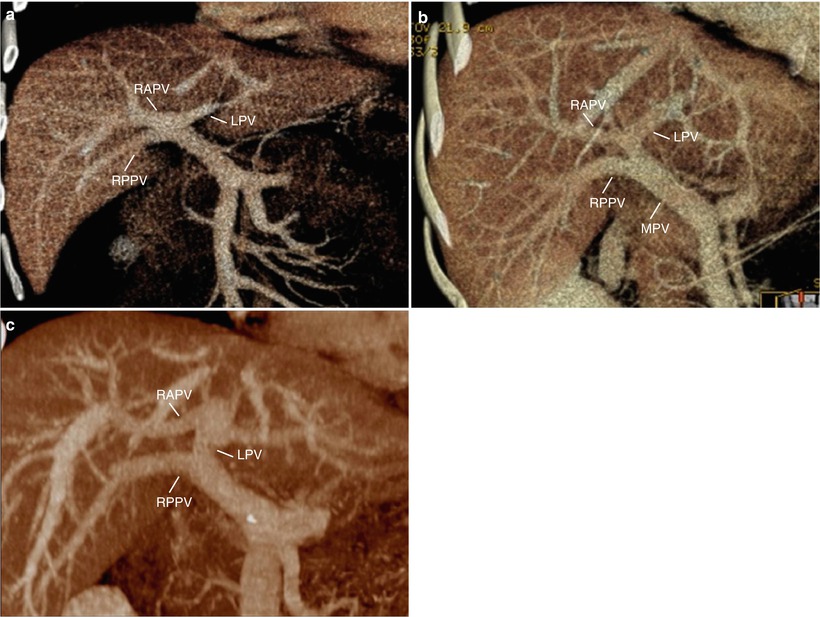
Fig. 8.5
Evaluation of vascular anatomy: portal vein (PV) variations. (a–c) Volume-rendered CT images during the portal venous phase show trifurcation of right anterior PV (RAPV), right posterior PV (RPPV), left PV (LPV) (a), early branching of RPPV from main PV (MPV) (b), and suprahilar branching of RAPV from LPV (c). While these variations have no effect on PV anastomosis in whole liver transplantation from cadaveric donor, in living donor transplantation using right-lobe graft, surgeons have to try separate division of the RPPV and the RAPV, discoid patch excision, or common orifice excision at PV confluence in live donors. Then, in recipients, surgeons may try either two separate anastomoses or interposition of Y-graft through the back-table preparation. In these circumstances, the selective stenosis of RAPV or RPPV anastomosis is possible to occur
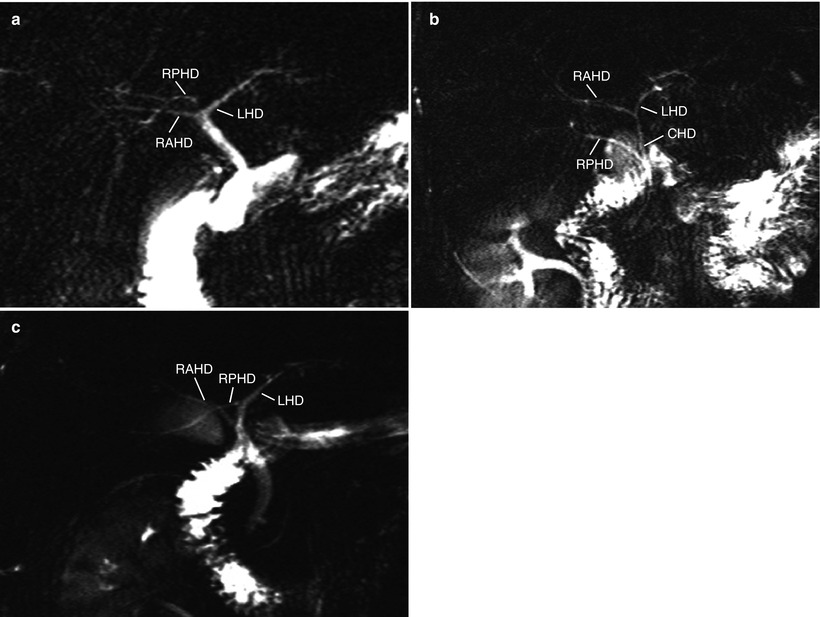
Fig. 8.6
Evaluation of biliary anatomy: bile duct variations. Variations are common in bile duct anatomy, and most of them are related to the aberrant drainage of right posterior hepatic duct (RPHD). (a–c) MRCP images show aberrant drainage of RPHD into the bifurcation, so-called trifurcation (a), common hepatic duct (CHD) (b), and left hepatic duct (LHD) (c). RAHD = right anterior hepatic duct. These cases result in two bile duct openings at the right lobe procurement. Surgeons may conduct multiple duct-to-duct anastomoses or hepaticojejunostomy in such cases
8.5.4 Intraoperative Cholangiography
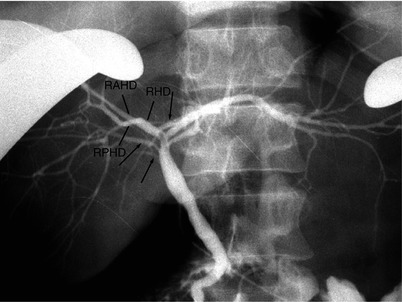
Fig. 8.7
Intraoperative cholangiography, with direct injection of the contrast through the cystic duct after cholecystectomy. In addition to the main right posterior hepatic duct (RPHD) that joins with right anterior hepatic duct (RAHD) to form the right hepatic duct (RHD), intraoperative cholangiogram shows multiple accessory RPHDs (arrows). Although MRCP is helpful for noninvasive evaluation of biliary system, fine accessory bile ducts are often missed with this method, and intraoperative cholangiography still has a role for biliary evaluation
8.5.5 Intraoperative Ultrasound
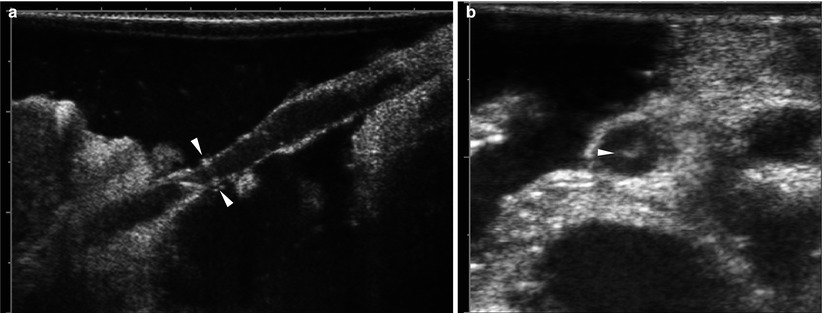
Fig. 8.8
Intraoperative ultrasound. (a) On grayscale US using linear-arrayed, 8–12 MHz transducer after filling the abdominal cavity with a warmed saline irrigation solution for ultrasonic path, hepatic artery anastomosis is localized in virtue of short linear artifactual echoes encircling the lumen (arrowheads), as a landmark, produced by stitches. (b) Grayscale US shows small thrombus (arrowhead) within the hepatic artery
8.5.6 Bleeding After Liver Transplantation
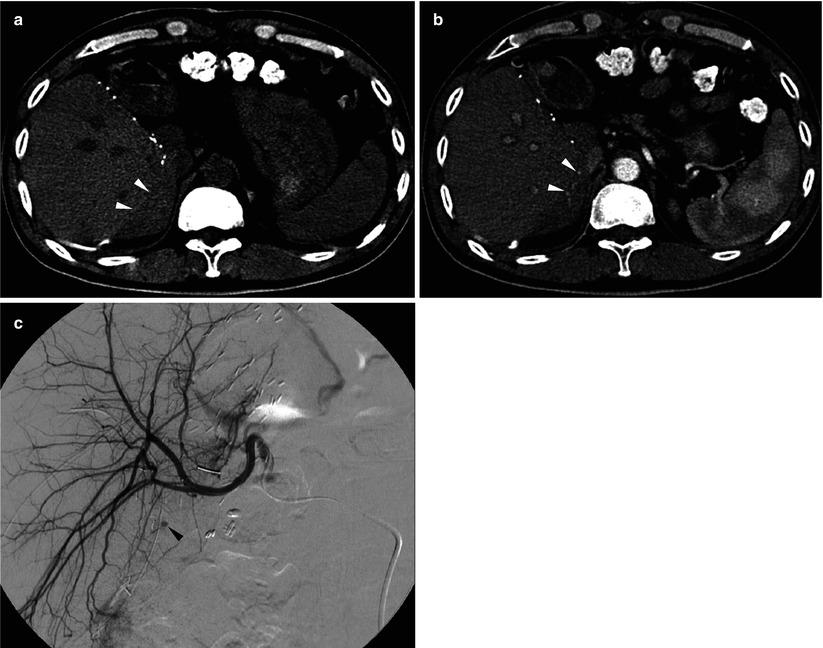
Fig. 8.9
Bleeding from hepatic cut surface in a 48-year-old man who underwent living donor liver transplantation using right-lobe graft. (a) Unenhanced CT scan shows acute hematoma in the perihepatic space (arrowheads). (b) Postcontrast CT scan during the arterial phase shows small amount of active extravasation around the liver (arrowheads). (c) Hepatic arteriography confirms small focus of extravasation (arrowhead) from the liver cut surface
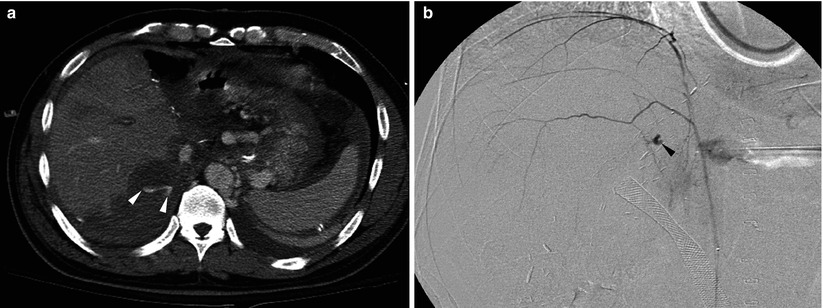
Fig. 8.10
Bleeding from posterior abdominal wall in a 57-year-old man who underwent living donor liver transplantation using right-lobe graft. (a) Postcontrast CT scan shows large amount of hematoma and active extravasation of the contrast material (arrowheads) around the liver. (b) Focus of extravasation (arrowhead) is demonstrated by right inferior phrenic arteriography
8.5.7 Hepatic Artery Stenosis/Thrombosis
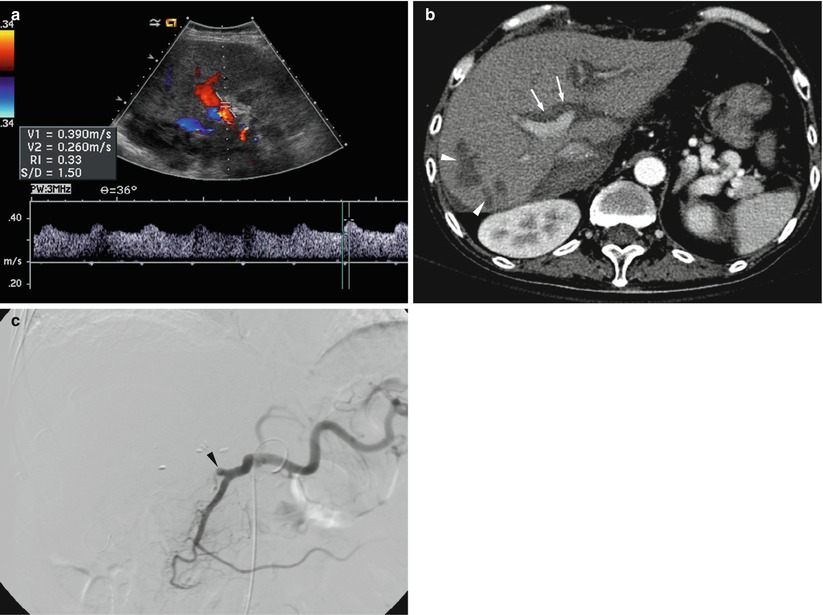
Fig. 8.11
Hepatic artery stenosis/thrombosis in a 54-year-old man who underwent whole liver transplantation from cadaveric donor. (a) Doppler spectrogram obtained at intrahepatic artery shows tardus parvus waveform (resistive index <0.5 and systolic acceleration time >80 ms) suggestive of hepatic artery stenosis/thrombosis. (b) Hepatic arterial phase CT scan obtained next day of Doppler US shows nonopacification of intrahepatic artery (arrows) and multiple patch infarctions (arrowheads) in the right lobe. (c) Hepatic arteriography confirms total occlusion of hepatic artery (arrowhead)
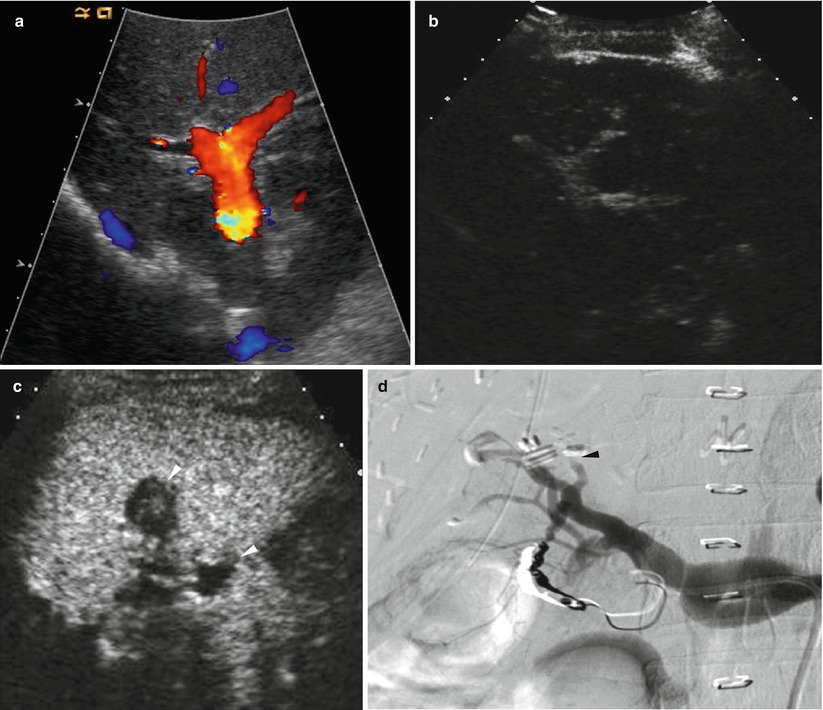
Fig. 8.12
Hepatic artery stenosis/thrombosis in a 38-year-old woman who underwent living donor liver transplantation using left-lobe graft. (a) Color Doppler US shows no discernible signal from hepatic artery around portal vein. (b) Contrast-enhanced US using microbubble contrast agent shows nonopacification of intrahepatic artery during the vascular phase. (c) Contrast-enhanced US using also shows small infarctions (arrowheads) of the liver graft during the parenchymal phase. (d) Hepatic arteriography confirms total occlusion of hepatic artery (arrowhead)
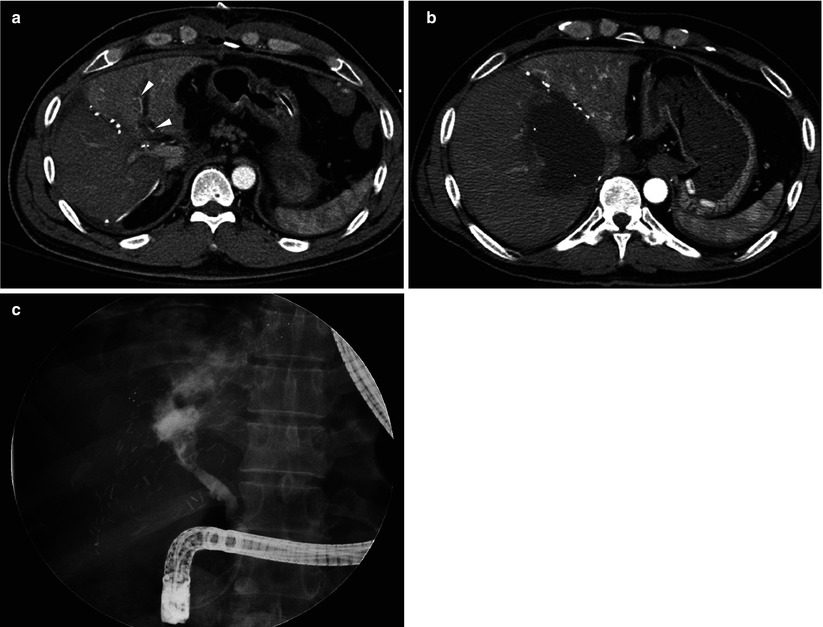
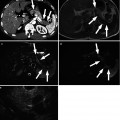
Fig. 8.13
Hepatic artery stenosis/thrombosis in a 49-year-old man who underwent living donor liver transplantation using dual grafts. (a) On hepatic arterial phase CT scan, enhancement of right graft is relatively poor, compared with that of left graft. Also, opacification of intrahepatic artery is noted in left graft (arrowheads), but not in right graft. Doppler US failed to find signal from intrahepatic artery in right graft. (b) Follow-up CT scan shows large biloma in right graft. (c) Direct cholangiograms shows bile duct necrosis and extravasation of contrast into the huge cavity noted on CT scan
8.5.8 Hepatic Artery Pseudoaneurysm
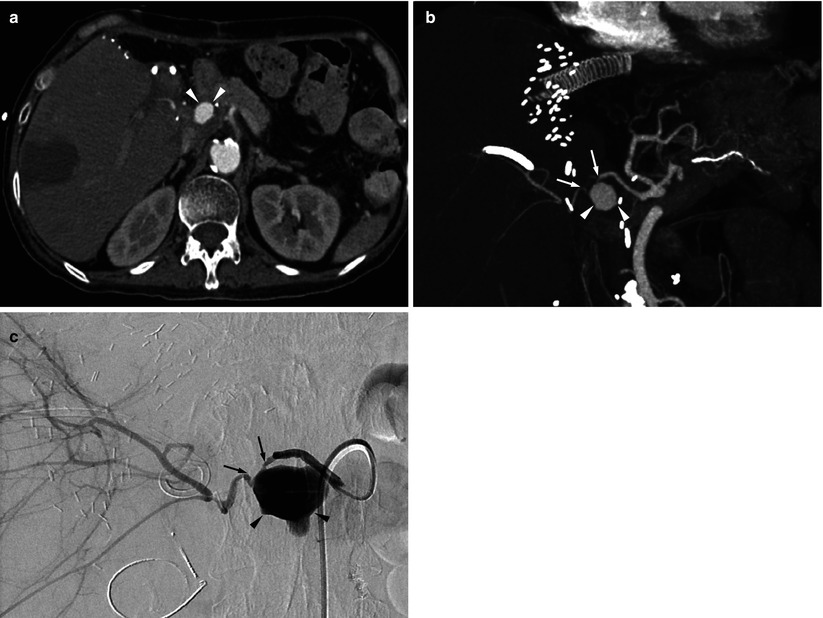
Fig. 8.14
Hepatic artery pseudoaneurysm in a 60-year-old woman who underwent living donor liver transplantation using right-lobe graft. (a


Related posts:


Stay updated, free articles. Join our Telegram channel
Full access? Get Clinical Tree
