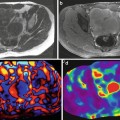
Fig. 7.1
a: Anatomical image of the vastus medialis (VM) muscle. b: Phase image with a black profile drawn along the propagation of the shear waves. c: Amplitude image resulting from the amplitude value of the first temporal harmonic extracted at the driven frequency 90 Hz along each pixel. d: Shear wave along the profile
To further characterize the micro structural changes occurring in muscle tissue, the viscoelastic (μ, η) properties of the muscles as well as the subcutaneous adipose tissue can be determined with multifrequency MRE and different rheological models (Voigt, Zener, and springpot) [10].
In addition, the attenuation coefficient (α) is calculated from the shear wave displacement amplitude in function of the distance. An exponential fitting curve.
Ae−(αd) is used to determine the attenuation coefficient, with A and d representing the displacement amplitude value and the distance along the profile, respectively.
A map of the shear modulus (Fig. 7.2) is generated from the wave displacement image using the Linear Frequency Estimate (LFE) algorithm [11] providing a spatial distribution of the muscle tissue stiffness. Assuming that muscle tissue is locally homogeneous, only the region of interest (ROI) around the prescribed profile may be analyzed.
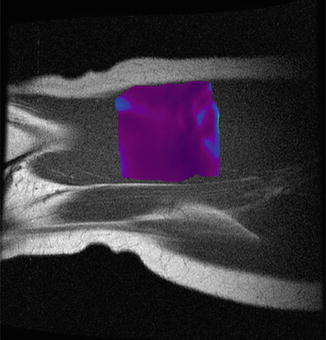
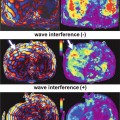
Fig. 7.2
Cartography of the muscle stiffness
Experimental Setup for Ultrasound Imaging
For comparative evaluation ultrasound can also be performed. Ultrasonic images are performed with B-mode using a standard ultrasound machine with suitable probe on the subject’s thigh who lays supine on the same previous leg press and with the same position as for the MRE test [12]. To visualize the anatomical structure located in the same area as the shear wave’s propagation, the tube wrapped around the thigh is used as a reference in order to localize its indentation observed on the MRI anatomical image (Fig. 7.3a). Then, the ultrasound transducer is placed perpendicularly and moved around the tube until the visualization of the vastus medialis (VM) and sartorius (Sr) muscles (Fig. 7.3b). Marks are done with a pen on the skin, to identify the placement of the probe which is the same for all experiments. Longitudinal ultrasonic images (resolution 960 × 720 mm) showing the parallel-oriented pattern of fascicles are recorded in both relaxed and contracted (10 and 20 % MVC) conditions for each subject. Wave angle (α_MRE, Fig. 7.3a) and ultrasound fascicle angles (α_US, Fig. 7.3b) are calculated between the subcutaneous adipose tissue-muscle interface and the shear wave propagation, and the path of the fascicle, respectively. The accuracy of the measurement is 0.5° and the reproducibility is about 6 %.
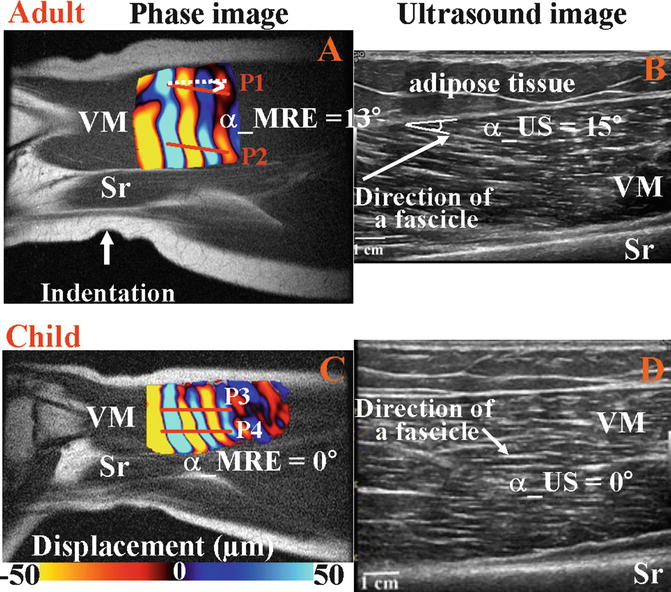
Fig. 7.3
Propagation of shear wave and fascicle angles obtained with MRE (a–c) and ultrasound (b–d) techniques for adult and child muscle at rest. Profiles (P) were placed in the upper part (P1, P3) of VM and close to the aponeurosis (P2, P4) membrane
Database of Thigh Muscle Stiffness Using MRE
A stiffness database of the vastus lateralis (VL), vastus medialis (VM), and sartorius (Sr) muscles has been established for adults volunteers (mean age = 25.2 ± 1.78) and the shear modulus measured at rest for VL, VM, and Sr are 3.73 ± 0.85, 3.91 ± 1.15, and 7.53 ± 1.63 kPa, respectively [1]. The higher stiffness found for the sartorius indicates that the propagation of the waves is related to the muscle architecture or orientation of the muscle fibers. Indeed, vasti’s muscles are composed of oblique muscle fibers while the sartorius has longitudinally oriented muscle fibers. In contraction, the stiffness of both vasti increased with the level of contraction, compared to the sartorius stiffness which remained the same, due to the applied isometric contraction which solicits only the knee extensors while the sartorius flexes the knee. Bensamoun’s study (2006) has demonstrated that MRE technique is able to determine the stiffness of different thigh muscles reflecting the muscle architecture (unipennate, longitudinal) and the muscle fiber composition (type I, II).
Effects of Muscle Conditions (Relaxed and Contracted) and Age on the Shear Modulus and Attenuation Coefficient
Analysis of the shear modulus (Fig. 7.4a) showed progressive muscle fibers recruitment with the degree of contraction for young adults (24-29 years) whereas middle-aged adults (52-59 years) and children (8-12 years) have already reached their maximum recruitment (maximal stiffness) at 10 % of MVC.
Fig. 7.4
a: shear modulus and b: attenuation coefficient for children, young, and middle-aged adults when the muscle is relaxed and contracted
After 50 years of age, structural changes, such as increase of collagen cross-link and percentage of slow fibers, force the muscle into developing a high stiffness to perform 10 % of MVC. Then, at 20 % of MVC the slight decrease of muscle stiffness may be also due to the ageing process, i.e. decline of the size and number of muscle fibers with a fatty tissue infiltration. At rest, muscle in children had a significant lower shear modulus compared to those in adults which have similar stiffness [13]. The unorganized muscle structure in the young children (fibers growing and ongoing structural organization) may explain this result which is also confirmed with the high attenuation coefficient (Fig. 7.4b) reflecting a less compact media. However, at 10 % MVC children revealed the highest muscle stiffness showing randomized muscle fibers recruitment.
The attenuation coefficient represents the texture of the medium through which the shear waves are traversing. For instance, subcutaneous adipose muscle tissue had lower shear modulus (μ_fat = 1.73 ± 0.17 kPa) and higher attenuation coefficient (α_fat = 62.71 ± 4.52 m−1) compared to the ones of muscle tissue (μ_muscle = 2.94 ± 0.20 kPa and α_muscle = 50.14 ± 3.08 m−1).
Cartography (Mapping) of Stiffness
Related posts:

Stay updated, free articles. Join our Telegram channel

Full access? Get Clinical Tree


