Fig. 11.1
A typical conventional compressive breast MRE setup. 1—MRI scanner bore, 2—patient in prone position, 3—breast RF coil, 4—compressive MRE driver, 5—patient table. The compressive breast MRE driver requires contact and compression of the breast tissue to maintain a good mechanical coupling for transmitting acoustic waves into breast tissues. The driver can be positioned on the right, left, superior, inferior, or/and anterior part of one or both breasts. If both breasts are contacting the driver, then they can be imaged by MRE at the same time
In one of the first in-vivo breast MRE studies, nine healthy female volunteers were studied and demonstrated that MRE is feasible and can adequately illuminate the breast tissues with shear waves and can characterize biomechanical properties of glandular tissue (2.45 ± 0.2 kPa) and fat tissue (0.43 ± 0.07 kPa) [18]. In another MRE patient study, six healthy volunteers and six patients with biopsy-proven palpable breast malignancies (infiltrating ductal carcinoma, n = 5; infiltrating lobular carcinoma, n = 1) were scanned with conventional MRE. The average shear stiffness of the tumors was 33 kPa (range = 18–94 kPa), which was about four times greater than that of adipose tissue (mean = 8 kPa, range = 4–16 kPa) in breast cancer patients. In the healthy volunteers, the mean value for adipose tissue was 3.3 ± 1.9 kPa, which is less than their fibroglandular tissue (7.5 ± 3.6 kPa) [19].
In addition to the shear modulus of breast tissue, Sinkus et al. [20, 21] have extended MRE to measure the eigenvalues of elasticity tensor of breast tissues in patients with breast carcinoma and found that carcinoma exhibits an anisotropic elasticity distribution while the surrounding benign tissue appears isotropic. It is well known to physicians that some malignant lesions feel stiff while others feel soft. Additional information about the anisotropy of the lesion has the potential to increase the diagnostic accuracy of MRE in the detection of breast malignancy [20].
Xydeas et al. [15] studied viscosity and elasticity of breast tissues in 5 patients with 6 malignant lesions, 11 patients with benign lesions, and 4 patients with no lesions using MRE. The mean viscoelastic parameters were: breast cancer (elasticity = 3.1 ± 0.7 kPa, viscosity = 2.1 ± 1.2 Pa∗s), fibroadenoma (elasticity = 1.4 ± 0.5 kPa, viscosity = 1.7 ± 0.8 Pa∗s), fibrocystic changes (elasticity = 1.7 ± 0.8 kPa, viscosity = 1.7 ± 0.9 Pa∗s), and surrounding tissue (elasticity = 1.2 ± 0.2 kPa, viscosity = 1.0 ± 0.31 Pa∗s). In terms of elasticity values, malignant lesions were significantly stiffer than fibroadenoma (P < 0.0004), fibrocystic changes (P < 0.04), and overall breast surrounding tissues (P < 0.0005), while for viscosity values, there were no significant differences between them. Two patients with fibroadenoma had a dynamic breast MR imaging score (in accordance with the BI-RADS system) of 3 out of 4, and small elasticity values. MRE correctly identified these as benign lesions which would have been diagnosed as malignant tumors based on contrast-enhanced MRI features.
It is known that tissue elasticity and viscosity are reflected by directly measured complex shear modulus, E = Er + i∗Ei, with Er and Ei being the real and imaginary part respectively. However, complex values are not straightforward to understand in practice; therefore, different rheological models (Voigt model, Maxwell model, and spring pot model) have been tested to explain the breast tissue biomechanical behavior, but none of them fits perfectly [22]. Therefore, Sinkus et al. followed a pure physically motivated approach, power law model, to study the viscoelastic behavior of breast lesions in the perspectives of solid/liquid duality (y = 0 for pure solid, y = 0.5 for pure liquid) and attenuation (α 0, at 1 Hz) [22]. This study included 68 female patients with breast tumors (benign: n = 29, malignant: n = 39), and revealed that malignant lesions tend to have high y (more liquid-like) values and low α 0 values (less attenuation), which is opposite to the behavior of benign lesions. The interpretation of complex shear modulus in terms of y and α 0 now provides an understanding of the underlying physics: malignant lesions are characterized by an enhanced liquid-like (greater y values) behavior and a decreased scale of attenuation (small α 0 values) [22]. When y approaches to 0.5 (pure liquid), the power law model suggests a loosely connected network formed in tissue. This is consistent with the macroscopic alterations such as stromal reaction induced by the tumor, which leads to the remodeling of the normal extracellular matrix and changes in cell density. Angiogenesis, tumor invasion, and metastasis all require a degradation of the extracellular matrix [22]. Finally, when combined with contrast-enhanced MR mammography, the study showed that MRE significantly increased the specificity by 20 % (from about 40 % to about 60 %) at 100 % sensitivity for diagnosing malignancy (AUROC = 0.96 ± 0.02) [22]. In another similar study with 57 patients, MRE increased the specificity of CE-MRI from 75 to 90 % and sensitivity of 90 % and combined AUROC of 0.96 [23].
New Developments of Breast MR Elastography: Noncompressive 3D Technique
With the conventional MRE setup, all breast drivers contact and compress the breasts for efficient mechanical wave transmission. This can cause significant biomechanical property change because of the nonlinearity of biological tissues [21]. The compression is difficult to control and measure in practice, which leads to the question of the impact of compression on the accuracy of breast elastography methods, including ultrasound elastography and MRE. A recent human study has shown that for adipose and fibroglandular tissues, 10 % tissue compression approximately doubled the observed shear wave speed, which represents about a four-fold increase in stiffness. Adipose tissue was observed to increase in stiffness with the amount of compression; so did breast cancers at a much slower rate. The stiffness difference between adipose tissue and malignant lesions became smaller as the compression level increased, and eventually disappeared when the compression level was about 40 % [24]. This compression effect partly explains the inconsistencies in the reported stiffness values of breast tissues from different elastography methods in the literature [8, 10, 19, 23, 24].
A novel noncompressive breast MRE technique has been developed to eliminate the effect of driver compression on tissue stiffness change [25]. Figure 11.2 shows the diagram of the noncompressive breast MRE setup. Compared with the conventional compressive breast MRE setup, the noncompressive setup has the following advantages. (1) does not add tension or change the shape of the breasts, which avoids the biomechanical property change and geometry/boundary condition change; (2) the driver-breast mechanical coupling is not affected by the size of the breasts; (3) The breast RF coils does not require any modification or customization to accommodate the driver and is automatically compatible to CE-MRI setup, thereby promoting their use in clinical practice; (4) the driver does not interfere with MRI-guided breast biopsy, and (5) both breasts can be imaged by MRE at the same time. A typical 3D GRE MRE imaging sequence and inversions used in the noncompressive breast MRE are detailed in [26], with the following parameters. A 1.5-T MRI scanner (GE, Signa, Wisconsin, USA) and a MRE active driver system (Resoundant, Rochester, MN) were used. Imaging parameters: vibration frequency = 40 Hz; vibration power level = 20 %; FOV x/y/z = 30-34/30-34/14.4-18 cm; four phase offsets; motion-encoding gradient (MEG) amplitude = 2.8 G/cm; TR = 31.3 ms; TE = 27.2 ms (fat/water in-phase echo time); flip angle = 15°; BW = 31.25 kHz; axial imaging plane covering both breasts in the SI direction; acquisition matrix = 96 × 96 × 40; reconstruction matrix = 256 × 256 × 36; NEX = 1; SENSE acceleration factor = 2 (RL direction); total scan time = 9′54″ (free breathing). Inversion parameters: the vector curl of the measured wave data was calculated using 3 × 3 × 3 derivative kernels on the wrapped phase data acquired in three orthogonal directions [27]. A 3D local frequency estimation (LFE) inversion was performed on the curl data with 2D directional filters (cut-off frequencies of 2 and 128 cycles/FOV) to calculate the volumetric elastograms of the two breasts [28].
Fig. 11.2
A novel noncompressive breast MRE setup. 1—MRI scanner bore, 2—patient in prone position, 3—breast RF coil, 4—noncompressive MRE driver, 5—patient table. Instead of compressing breast tissue, the noncompressive breast MRE driver is only in contact with the patients’ sternum to transmit acoustic waves into breast tissues through the chest wall. The driver is automatically compatible to CE-MRI setup. Both breasts can be imaged by MRE at the same time
A preliminary study was performed with seven healthy normal female volunteers without known breast disease and a 41-year-old female patient with a biopsy-proven invasive ductal carcinoma. Bilateral noncompressive MRE with the above parameters was performed in all subjects, and the patient also underwent a CE-MRI study. In Fig. 11.3, CE-MRI shows that in the left breast of this patient, there is a heterogeneously enhancing mass in the right subareolar breast tissue corresponding to the biopsy-proven malignancy, with a size of 3.2 × 2.0 × 2.4 cm (Fig. 11.3a, arrow). No abnormal indications were seen in the right breast. The breast MR elastogram shows that the glandular tissue is heterogeneous in stiffness, and the carcinoma is much stiffer than the surrounding breast tissue (Fig. 11.3b, arrow). The x, y, and z curl components of the measured wave displacement show adequate wave propagation in both breasts (Fig. 11.3c, d, e). For this patient, the stiffness of adipose tissue was 0.41 ± 0.10 kPa, glandular tissue was 0.90 ± 0.18 kPa, and the invasive ductal carcinoma was 1.42 ± 0.17 kPa. In the seven normal volunteers, the stiffness of adipose tissue ranged from 0.25 to 0.41 (mean = 0.33) kPa and glandular tissue ranged from 0.46 to 0.9 (mean = 0.64) kPa [29]. The invasive ductal carcinoma is about 3 times stiffer than the adipose tissue and 1.5 times stiffer than the glandular tissue.
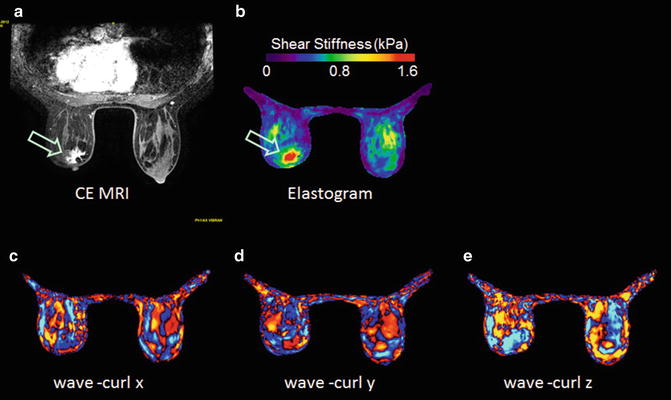
Fig. 11.3
Example MRE images of a 41-year-old-female patients with invasive ductal carcinoma. (a): CE-MRI; (b): MR elastogram; (c), (d), and (e): x, y, and z component of curl displacement respectively
Conclusions
Breast cancer can be treated more effectively in early stages than in late stages, and accurate diagnosis diagnostic methods are desired to detect breast cancer early. MRE is a promising for differentiating malignant from benign breast lesions. A recently developed noncompressive MRE technique can complement the CE-MRE setup, can image both breasts at the same time, and applies no compression to the breasts, which avoids the tissue biomechanical property change due to its nonlinearity. Future work will include recruiting a larger number of breast cancer patients to evaluate the noncompressive MRE to diagnose breast cancer as a single technique and in conjunction with CE-MRI for improving its specificity.
MRE of the Spleen
The spleen is situated in the left upper abdomen below the diaphragm and performs the function of hemopoiesis and acts as a reservoir of blood in acute stress. The spleen is intimately related to the portal circulation and splenomegaly in a patient with chronic liver disease and cirrhosis is suggestive of portal hypertension. Therefore, spleen has been evaluated both clinically and by imaging for an increase in size as an evidence for portal hypertension. However there is poor correlation between spleen size and severity of portal hypertension [30] and splenomegaly may be related to tissue hyperplasia and fibrosis in addition to congestion [31]. Evaluation of splenic stiffness may provide further insights into the pathophysiology of splenomegaly and the complex relationship between liver fibrosis, portal hypertension, and spleen. Several studies have focused on the evaluation of spleen stiffness with MRE.
MRE of the spleen can be performed by placing a passive driver over the spleen [32, 33]. Custom made pillow-like passive actuator flexible drivers (Fig. 11.4) that are made of a soft inelastic fabric cover around a porous, springy mesh core [34] can be easily placed on the curved lateral abdominal wall. In a preliminary study [33], a significant difference in measured splenic stiffness was found when performed with the driver placed over the liver on right abdomen and with the driver over the spleen on left side of the abdomen. MRE of the spleen is best performed with the driver over the left side (over the spleen) to ensure through plane propagation of shear waves in the spleen.
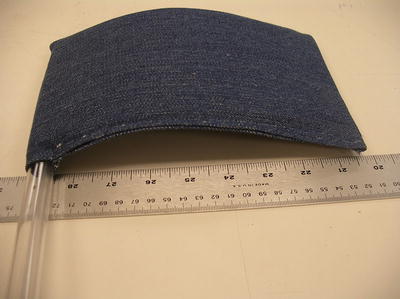
Fig. 11.4
A ergonomic flexible pillow passive driver. The flexible driver can be easily applied to curved surfaces like abdomen and chest walls which ensure good contact with the surface and better transmission of shear waves
The mean stiffness of normal spleen tissue measured in healthy volunteers ranges from 2.35 to 5.6 kPa with an average value of 3.6 kPa. No significant correlation was demonstrated between splenic stiffness and age, sex, body mass index and arterial mean blood pressure [32, 33].
Evaluation of splenic stiffness in chronic liver disease and portal hypertension has been the subject of interest in many studies including those with transient elastography. In a large animal model, Nedredal et al. showed significant correlation between spleen stiffness with MRE and measured direct portal vein pressure gradient [35]. In another well-controlled in-vivo porcine model study, spleen stiffness and liver stiffness were shown to correlate with measured portal pressure [36].
In a preliminary human study with 38 patients with chronic liver disease, Talwalkar et al. showed significant correlation between liver stiffness and spleen stiffness (r 2 = 0.75; p < 0.001) and a systematic increase in spleen stiffness with increasing liver fibrosis stages (Fig. 11.5). A mean spleen stiffness of ≥10.5 kPa was associated with esophageal varices (Fig. 11.6). In another study, Morisaka et al. [37] demonstrated strong association of splenic stiffness with severe gastroesophageal varices with a cut-off value of 10.1 kPa similar to the Talwalkar study.
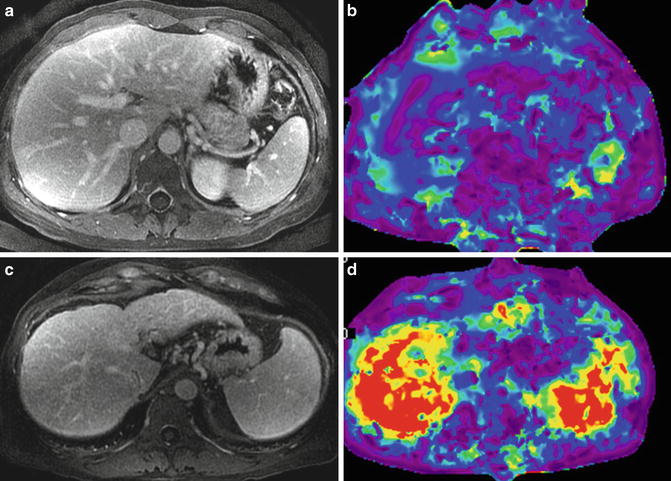
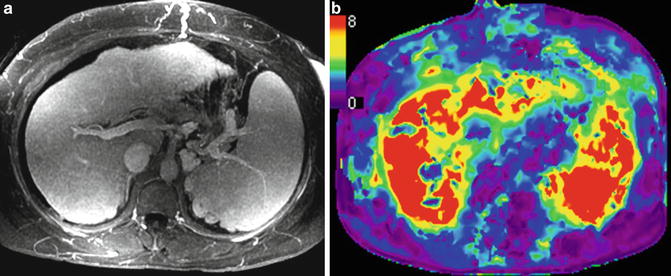
Fig. 11.5
Splenic stiffness in chronic liver disease. Post contrast enhanced images (a,c) and stiffness maps (b,d). An example of simple fatty liver only (top row) with normal liver stiffness of 1.9 kPa and spleen stiffness of 3.2 kPa. A case of chronic hepatitis C with cirrhosis (bottom row) shows elevated liver stiffness of 8.2 kPa and that of spleen to 9.1 kPa consistent with portal hypertension
Fig. 11.6
Splenic stiffness can predict esophageal varices. An example of NASH with cirrhosis and portal hypertension. Contrast-enhanced MR image (a) showing nodular liver, splenomegaly, splenic and gastric collaterals, and dilated anterior abdominal veins. Stiffness map (b) shows severely elevated splenic stiffness to 11 kPa and that of the liver to 10.5 kPa. Endoscopy confirmed esophageal varices
Shin et al. [38] using a 3D echo planar MRE technique showed that both hepatic and splenic stiffness had positive linear correlations with the endoscopic grade of esophageal varices. The diagnostic performance of hepatic and spleen stiffness in predicting high-risk varices was comparable to that of dynamic contrast-enhanced (DCE) MR imaging and DCE + MRE had higher sensitivity in predicting esophageal varices and high-risk varices. In a recent study, Ronot et al. [39] showed significant correlation of hepatic venous pressure gradient (HVPG), with liver and spleen loss modulus assessed with MRE. Severe portal hypertension and high-risk varices were best identified with spleen loss modulus.
Assessment of splenic stiffness is useful in the evaluation of portal hypertension for the prediction of esophageal varices and high-risk varices. In the future, spleen stiffness may also serve as a quantitative parameter for the assessment of response to treatment of portal hypertension.
MRE of the Pancreas
The pancreas is a midline retroperitoneal organ situated in a roughly transverse orientation in the upper abdomen. The location of the pancreas makes propagation of shear waves challenging. However it is possible to introduce propagating shear waves by placing a modified large driver in the midline of the upper abdomen [40]. Due to the small size of the gland and complex shape, a three-dimensional (3D) analysis of the wave field would be required. Ideally the patient should be fasting to ensure an empty stomach so that distance between the driver and pancreas is reduced as much as possible to ensure good propagation of waves. This is also reduces possible compression by a full stomach.
In an initial study of healthy volunteers by Yin et al. [41], the mean shear stiffness of the pancreas was 2.0 ± 0.4 kPa at 60 Hz. Recently Yu et al. [40] showed that MRE was feasible in normal volunteers using an ergonomic soft pillow driver to deliver vibrations to the pancreas. In this study with 20 healthy volunteers, the propagating shear waves were imaged with a 2D multi-slice echo planar imaging based MRE pulse sequence and at 40 and 60 Hz. The mean stiffness of pancreas was 2.09 ± 0.33 kPa at 60 Hz and similar to liver, whereas at 40 Hz, it was 1.15 ± 0.17 kPa, significantly lower than the liver. The stiffness in different regions of the pancreas was similar with no significant differences (Fig. 11.7). The initial studies have provided motivation for application of MRE in evaluation of pancreatic diseases. MRE of the pancreas may be useful in the assessment of chronic pancreatitis as well as focal lesions in the pancreas such as adenocarcinoma.
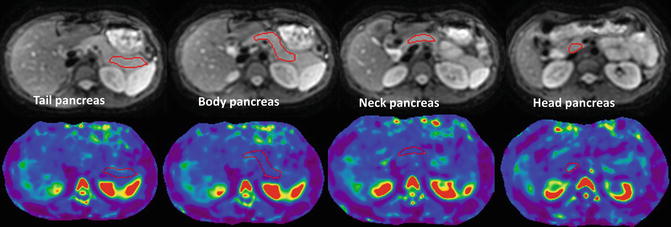
Fig. 11.7
MRE of the pancreas. Anatomical MR images (top row) and stiffness maps (bottom row) through different regions of pancreas in a normal healthy volunteer. A manual region of interest has been drawn in different parts for measurement of stiffness (red outlined areas). The mean stiffness of the pancreas was 2.08 ± 0.3 kPa (color figure online)
MRE of the Kidney
Related posts:
 Introduction
Impact of Magnetic Resonance Elastography on Liver Diseases: Clinical Perspectives
Introduction
Impact of Magnetic Resonance Elastography on Liver Diseases: Clinical Perspectives
 Magnetic Resonance Elastography of the Skeletal Muscle
 Clinical Applications of Liver Magnetic Resonance Elastography: Chronic Liver Disease
 Liver Magnetic Resonance Elastography Technique
Stay updated, free articles. Join our Telegram channel

Full access? Get Clinical Tree


