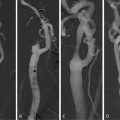
Fig. 9.1
Sequential imaging of bilateral carotid artery stenosis. TOF depicts the area of luminal narrowing. Axial slices depict the full extent of the atherosclerotic process, including expansive remodeling. The atherosclerotic process includes a larger area than seen only by looking at the extent of luminal narrowing. TOF time of flight
Table 9.1
Imaging modalities available to assess atherosclerotic carotid plaque characteristics
Plaque characteristic | MRI | CT | US | PET | SPECT | DSA |
|---|---|---|---|---|---|---|
Active inflammation | ✓ | X | X | ✓ | X | X |
Thin FC with large LRNC | ✓ | ✓ | X | X | X | X |
FC disruption | ✓ | X | X | X | ✓ | X |
Severe stenosis | ✓ | ✓ | ✓ | X | X | ✓ |
Intraplaque hemorrhage | ✓ | X | X | X | X | X |
Expansive remodeling | ✓ | X | ✓ | X | X | X |
Superficial calcified nodules | ✓ | ✓ | X | X | X | X |
Yellow coloring on angioscopy | X | X | X | X | X | X |
Endothelial dysfunction | ✓ | X | X | ✓ | X | X |
3 Magnetic Resonance Imaging
MRI has many advantages, which make it likely to become the investigative modality of choice for imaging carotid disease. It yields images of high spatial resolution, even of soft tissue. Additionally, MRI-derived measurements have been shown to be reproducible and can be used in classifying plaques according to the American Heart Association criteria [33]. It has been shown that imaging plaques in vivo using MRI corresponds well to postoperative histological examination of the excised plaques. It is noninvasive and does not entail patient exposure to ionizing radiation. These particular benefits mean that MRI can safely be used sequentially on the same patient to assess disease progression or response to treatment.
The disadvantages of MRI include its costs; it is an expensive technology requiring skilled staff, trained in imaging carotid vessels and using specialist equipment. Furthermore, MRI involves long-image acquisition times and this can pose problems for patients suffering with impaired neurological status, which is often encountered in patients following stroke. MRI is absolutely contraindicated in an important subsection of the patient population with metallic implants, especially those with concomitant coronary atherosclerotic disease who might have implanted cardiac devices. Different techniques using MRI have been used to investigate the key characteristics of “vulnerable” plaques. In the subsequent sections we will outline recent research studies that demonstrate how MRI is being used to investigate each of those characteristics.
4 Fibrous Cap
As discussed earlier, the fibrous cap overlying the lipid core of an atherosclerotic plaque is implicated as the thrombo-embolic component which, when ruptured, leads to TIA or stroke. Indeed, a number of histological studies have shown that a thin fibrous cap overlying a large lipid-rich necrotic core is a common feature of plaques prone to rupture [15, 21, 34, 35].
High resolution MRI using a 3D “multiple overlapping thin slab angiography” sequence was employed in a study by Hatsukami et al. to assess the feasibility of differentiation types of FC depending on thickness into thin FC, thick FC, and ruptured FC [36]. Their results had an 89% agreement with ex vivo histological assessment of the imaged plaques. In a study by Trivedi et al., the authors were able to quantify both fibrous cap and the lipid-rich necrotic core using 2D, blood-suppressed, fast spin echo, T2W MRI sequences with high interobserver agreement [37]. The fibrous cap/lipid-rich necrotic core ratio was introduced. Similar results were later confirmed by other authors, who also found good agreement of the MRI measurements with histological specimens [38]. The specific sequence employed included double inversion recovery, T1W, time of flight, and proton density weighted, which were statistically more accurate than T2-weighted MRI.
These studies demonstrate that fibrous cap identification and measurement can reliably be achieved using specialized high-resolution MRI sequences with reliable comparison to the histological measurements from the same plaques postoperatively. These results suggest that the imaging techniques could be used sequentially to assess disease progression. Additionally, there is wide scope for the morphological parameters visualized with MR to be used for the assessment of therapeutic interventions aimed at stabilizing the plaques and their fibrous caps.
5 Lipid-Rich Necrotic Core
Larger sized LRNC in atherosclerotic plaques have been postulated as inferring greater risk of plaque vulnerability owing to the increased likelihood of hypoxia and necrosis in the LRNC and the increased fragility of neovascularization leading to intraplaque hemorrhage; all of which perpetuate atherosclerotic disease progression. Recent studies have used various different MRI techniques to reliably image and measure the LRNC in vivo.
Echo-planar diffusion-weighted imaging (DWI) was used alongside high resolution MRI to generate apparent diffusion coefficient (ADC) maps in 26 patients with moderate to severe carotid stenosis to distinguish between LRNC and FC. They report a significant difference between the ADC values for the FC and LRNC (p < 0.0001) as well as a significant correlation (p = 0.005) between ADC values and histology post CEA; lower ADC values matched with heavier lipid staining in the excised specimens.
Underhill et al. [39] used multicontrast MRI in a prospective observational study in 108 asymptomatic individuals with carotid stenosis, imaging at baseline and at 3 years to assess for new ulceration or plaque disruption. Regression analysis revealed that the proportion of wall volume occupied by the LRNC was the strongest predictor of subsequent “surface disruption” and that a new surface disruption was associated with a significant increase in percentage LRNC volume. This particular target step in the pathophysiology may be of special relevance as the point where a stable plaque becomes unstable. The use of high resolution MRI to assess therapy effects on LRNC at this stage is likely to be of great clinical importance.
In a randomized, double-blind, placebo-controlled prospective study over 3 years, [40] used high resolution, multicontrast bilateral carotid MRI scans at baseline and annually in 33 patients to assess the effect of lipid lowering therapy on LRNC volume and as percentage of the diseased wall. They report significant LRNC volume reduction (p < 0.001) and significant reduction in LRNC percentage of arterial wall (p < 0.001) over 3 years with intensive lipid lowering therapy. The statistically significant reduction in LRNC percentage of the arterial reduction over the first 2 years precedes “plaque regression”; although longer term follow-up would be required to verify whether this change in imaged LRNC will translate into a lower incidence of stroke or TIA in the future.
6 Fibrous Cap Disruption
Histopathological studies have shown that fibrous cap disruption is more frequently found in patients who have suffered from a transient ischemic attack or stroke in the past [26, 41]. Specific assessment of the FC has been shown to be able to detect with good accuracy situations of disrupted fibrous caps, suggestive of plaque rupture (Figs. 9.2 and 9.3). This has been obtained using high resolution MRI with multicontrast protocols [38]. A case series study has demonstrated it possible to use multisequence, cross-sectional MRI with black and bright blood sequences to identify carotid plaques with disrupted fibrous caps [42]. However, the spatial resolution of conventional scanners is approximately 250 μm, which is the dimension of a thin fibrous cap. This demonstrates the existing pitfalls of imaging of carotid atherosclerosis with conventional MRI scanners.
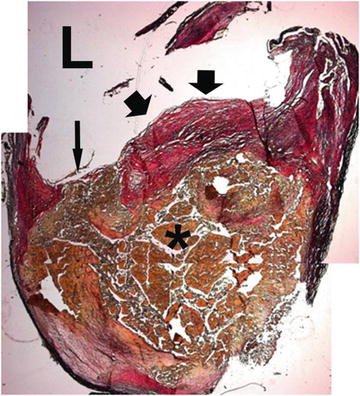
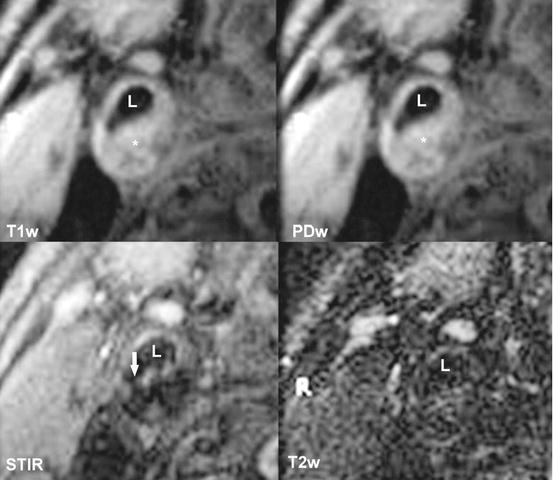
Fig. 9.2
Histological specimen of a atherosclerotic carotid artery. A thin fibrous cap is seen (short arrow), with a rupture at one of the edges (long arrow). Below the fibrous cap the lipid-rich necrotic core can be seen (asterisk). L signifies arterial lumen
Fig. 9.3
T1w, PDw, STIR, T2w images of the same plaque as in Fig. 9.2. Ruptured fibrous cap is visible in the STIR sequence (long arrow). L signifies arterial lumen, asterisk signifies the lipid-rich necrotic core. T1w T1-weighted sequence, PDw proton density-weighted sequence, STIR short T1 inversion recover sequence, T2w T2-weighted sequence
7 Intraplaque Hemorrhage
Fragile neovascularization in the inflammation-ridden atherosclerotic plaque is prone to hemorrhage. Current thinking suggests that hemorrhage within the atherosclerotic plaque perpetuates the inflammatory processes and induces further necrosis. All these increase the risk of ipsilateral stroke.
As with imaging of the lipid-rich necrotic core, a variety of recent studies have used different MRI techniques to successfully investigate intraplaque hemorrhage in carotid atherosclerotic lesions (Fig. 9.4).
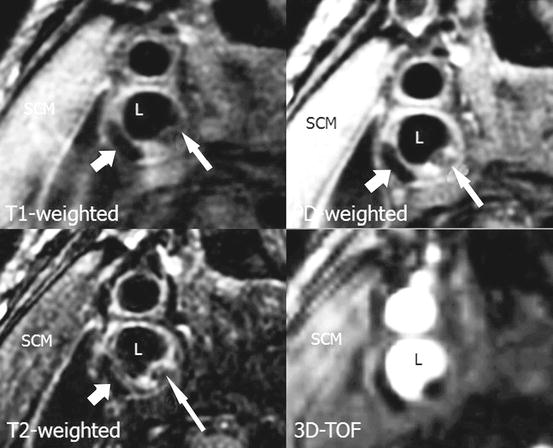
Fig. 9.4
MRI image with T1w, PDw, T2w, and 3D-TOF demonstrating thrombus within a carotid artery plaque (short arrow). Additionally thrombus with partial calcifications is seen in adjacent area (long arrow). L indicates arterial lumen. T1w T1-weighted sequence, PDw proton density-weighted sequence, T2w T2-weighted sequence, 3D-TOF 3-dimensional time of flight
One study compared contrast-enhanced MR angiography (CE-MRA) with time-of-flight (TOF) MRA sequences in 15 patients and validated their accuracy with histological findings from the ex vivo post-CEA plaque specimens. They report a 94% accuracy with CE-MRA over 84% using TOF sequences, with excellent intra and interobserver agreement [43].
Improvements in the technique for imaging intraplaque hemorrhage have been made. One study reported the use of a novel technique to improve on IPH identification, which has previously relied on methemoglobin detection with T1-weighted sequences and blood suppression [44]. They report their novel technique “slab-selective phase-sensitive inversion-recovery” (SPI) optimizes IPH detection and is validated against histology, with significantly improved intraplaque hemorrhage-wall contrast-to-noise ratio (p < 0.01) and blood suppression efficiency (p < 0.01) when compared with recently used 3D rapid acquisition gradient echo sequences.
8 Wall Thickness
As the focus has shifted from vessel lumen stenosis to the arterial vessel wall, the relationship between the overall wall thickness and the percentage of the wall occupied by the LNRC has also been emphasized as a risk-stratifying characteristic. In the Carotid Atherosclerosis Score (CAS) [39], maximal vessel wall thickness (VWT) and the percentage of the wall occupied by the LRNC were the strongest predictors of FC disruption and IPH.
VWT and vessel wall area (VWA) have been used as surrogate markers of expansive remodeling, whereby the plaque progression occurs by enlarging the vessel wall outwards rather than encroaching on the lumen size. Black-blood fast spin-echo sequences were used in a prospective clinical trial of the effects of 12, 18, and 24 months of simvastatin lipid lowering therapy on VWT and VWA [45, 46]. Changes in both VWT and VWA at all the predefined times were statistically significant; the reduction in VWA size at 24 months compared to baseline (p < 0.0001) and VWT (p < 0.001). This feasibility study showed that MRI can be used in clinical trials to evaluate treatment efficacy, by means of assessing the change in wall characteristics rather than the degree of lumen stenosis in a longitudinal manner.
9 Inflammation
The inflammatory process within the plaque itself plays a major role in all aspects of atherosclerosis, i.e., plaque initiation, plaque progression, and plaque rupture. Systemic markers of inflammation, such as C-reactive protein (CRP) have been correlated with the cardiovascular events due to atherosclerotic disease [47]. Furthermore, inflammation has become a target of new therapies for atherosclerosis. While the exact mechanisms of inflammation related to atherosclerosis are beyond the scope of this chapter, macrophage infiltration of the plaque and neovascularization are of the plaque are two aspects, which have been recognized as potential markers of plaque vulnerability. MRI using a specific, macrophage-directed contrast agent, such as ultrasmall superparamagnetic iron oxide (USPIO) and dynamic contrast-enhanced MRI (DCE-MRI) using traditional gadolinium-based contrast agents have been used [48–51].
10 USPIO-Enhanced MRI and Macrophage Content
Ultrasmall superparamagnetic iron oxide (USPIO) is a non-gadolinium-based contrast agent that has been shown to be useful in MRI. The USPIO particle consists of a microcrystalline magnetite core, within dextran coating. Typically the diameter of USPIO is around 30 nm [52]. The particles are absorbed by the reticuloendothelial system (RES) of the liver and spleen and are subsequently nonselectively absorbed by activated macrophages. Activated macrophages accumulate in areas of active inflammation, such as atherosclerotic plaques, but not only, and thus can be visualized using MRI [53, 54].
The effect of USPIO on MRI imaging has been described by Bulte et al. [55]. Briefly, USPIO particles create a large dipolar magnetic field, which acts on water molecules thus reducing the T2 relaxation times. USPIO acts as a negative contrast is on T2-weighted (T2W) sequences [55] (Fig. 9.5).
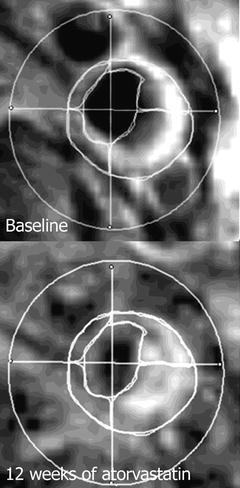
Fig. 9.5
USPIO-enhanced MRI at baseline and after 12 weeks of atorvastatin therapy. Note the increased enhancement in the right upper and lower quadrant signifies a lower USPIO accumulation, thus, reduced inflammatory process
The uptake of USPIO particles by macrophages has been demonstrated in experimental studies [53] and later confirmed in plaques from carotid arteries of humans [49, 54, 56, 57]. Later, Trivedi et al. described the temporal relationship of the magnitude of signal loss following USPIO administration, establishing an optimal window for imaging between 24 and 36 h following administration of contrasting medium [57].
Interestingly no relationship between USPIO uptake of carotid plaques and luminal narrowing was demonstrated [58]. On the other hand, a relationship between inflammation as seen using USPIO-enhanced MRI and biomechanical stress has been demonstrated [59]. These results suggest the degree of inflammation may be an independent factor in determining the risk of plaque progression and subsequent risk of cerebrovascular events. Such findings prompted the question whether inflammation can be used as a surrogate end-point in clinical trials aimed at medical reduction of plaque burden.
The first use of USPIO-enhanced MRI for this purpose was published by Tang et al. in the ATHEROMA trial [60]. Forty-seven patients with asymptomatic carotid atherosclerosis (≥40% stenosis) were randomized into two groups of high-dose (80 mg/day) and low-dose (10 mg/day) atorvastatin. While a significant reduction in USPIO uptake was demonstrated in the high-dose atorvastatin group as early as 6 weeks after initiation of treatment, no such effect was noted in the low-dose group. Previously interventional studies aimed at reducing plaque burden have focused on morphological characteristics [15, 45, 46, 61, 62]. Similarly, these studies showed that improvements in gross morphological parameters such as vessel wall thickens and vessel wall area, precede changes in luminal stenosis. However, the earliest changes were visible after 12 months of treatment. In contrast using USPIO-enhanced MRI quantifiable changes were demonstrated as early as 6 weeks following start of therapy. These results demonstrate the potential of novel imaging techniques in the rapid assessment of plaque vulnerability and therefore patient risk stratification. It needs to be noted that only patients with baseline uptake of USPIO particles were included in the ATHEROMA study, potentially limiting the generalization of the results to a wider population [60]. However, the potential of imaging inflammation has been demonstrated giving incentive for further development in this area.
11 Dynamic Contrast-Enhanced MRI
Gadolinium-based contrast media are used for their T1-shortening ability. The accumulation of the contrast causes T1 hyperintensity. With the implementation of gadolinium chelates, investigation of the late-phase enhancement is possible. Late enhancement is used as a surrogate marker of contrast diffusion into the extracellular compartment. In order to visualize the vessel wall, sufficient suppression of the blood signal is essential, hence the choice of image acquisition is essential when DCE-MRI is used. Commonly black blood T1W sequences with either double inversion-recovery (DIR) [63] or even, quadruple inversion-recovery (QIR) are used [64].
Studies have shown that the extent of microvasculature within a plaque corresponds to the risk of intraplaque hemorrhage and subsequent rupture [30, 65]. Neovascularization is induced by the chronic inflammatory process occurring in the plaque. Dynamic contrast-enhanced MRI (DCE-MRI), a method, which was originally developed for in neuro-oncology to determine the extent of tumor neovascularization, has been recently implemented in the study of carotid atherosclerosis. The main advantage of this method is that it can utilize routinely available contrasting media [66]. The first human observation of enhancement of atherosclerotic plaques was observed by Aoki et al. [67]. However, two separate aspects of plaque enhancement have been noted. In the first reports a hyperintense rim surrounding the diseased vessel was reported [67]. This was thought to represent vasa vasorum in the adventitia of the artery. However, direct enhancement within the plaque, in particular the FC was also noted [51, 68].
Kinetic modeling plays the role in the image analysis today [48, 69, 70]. Two parameters which are considered for analysis are fractional plasma volume (V p) and transfer constant of the contrast agent (K trans) and represent the two compartments: intravascular space and extravascular, extracellular space. V p is thought to represent the actual microvascular volume [48]. It was found to be a good marker of plaque neovasculature when compared with histology (r = 0.68, p < 0.001) [48, 70]. K trans, on the other hand, is used to estimate the permeability of the microvasculature. Interestingly, it was K trans which was found to correlate with macrophage content within the plaque suggesting that there may be distinct features of the neovascular bed which are associated with inflammation [48].
One major pitfall of MRI-contrasting agents is the nonspecific enhancement, which may unfavorably alter results. MRI contrasting media development is currently concentrating on designing new markers, which would bind to specific targets in the atherogenic process. This progress is being done on the molecular and cellular level. Contrast media that bind to lipid [71, 72], thrombus [73], specific inflammatory mediators [74–76], apoptotic cells [77], and proteolytic enzymes, which could contribute to plaque destabilization [77], are currently under investigation and have the potential to obtain similar binding specificity as the one found in nuclear medicine.
12 Biomechanical Stress Modeling
The biomechanical forces acting on diseased arterial walls with atherosclerotic plaques prone to rupture have also been successfully modeled using MRI techniques [78]. As the inflamed endothelial layers are subject to biomechanical stress from hyperkinetic and turbulent blood flow, the structural integrity becomes progressively compromised which may lead to plaque rupture [78]. Such stresses can be measured using finite elements analysis (FEA) [79].
Trivedi et al. have used MRI-derived 2D geometrical arterial models to perform FEA to predict the differences in plaque tensile stress between symptomatic and asymptomatic patients with carotid atherosclerosis [80]. They reported a substantial difference in principal tensile stress calculated between the two groups.
A recent study used MRI-derived FEA, in a series of 45 patients with carotid atherosclerosis, to demonstrate that plaques with IPH had significantly higher stress than non-hemorrhagic plaques (p = 0.003) [81]. Furthermore, biomechanical stress has been used to determine the effect of lipid lowering therapies on carotid atherosclerotic plaques [82]. A reduction in arterial wall strain following aggressive lipid lowering therapy was determined using MR-based modeling. Maximum arterial wall strain at 12 weeks of treatment was significantly lower in the high dose Atorvastatin (80 mg) patient group versus the low dose (10 mg) group [82].
13 Recent Trends and Future Directions
The described studies illustrating how different MR techniques have been used to evaluate the individual “high risk” components of atherosclerotic carotid plaques are by no means the only research employing MR for this purpose. MRI-derived measurements have been shown to be reproducible and that they can be used in classifying plaques according to the American Heart Association criteria [33]. Furthermore, it has been shown that imaging plaques in vivo using MRI corresponds well to postoperative histological examination of the excised plaques [34, 51]. The efficacy and feasibility of MRI in imaging vulnerable carotid plaques has been repeatedly demonstrated [32, 33, 37, 39, 42, 48, 83]. MRI is increasingly being adopted as the imaging tool in prospective studies. It has been successfully used in longitudinal studies [46, 61, 84], as well as clinical intervention trials [60, 85, 86] (Table 9.2).
Table 9.2
Summary of recent longitudinal studies and clinical trials using MRI measures as primary or secondary end points
Author | Design | n | Intervention | Time | Imaging | Results |
|---|---|---|---|---|---|---|
Long. | 18 | Simvastatin | 24 months | DIR, FSE PDw, T2w | VWA: decrease of 15% and 18% at 12 and 24 months; VWT: decrease of 11% and 19% at 12 and 24 months; LA: increase of 5% at 24 months | |
Lima (2004) [87] | RCT | 27 | 20 vs. 80 mg/day simvastatin | 6 months | DIR, FSE PDw, T2w | PV: decrease of 12% from baseline; PA: decrease of 12% from baseline; no difference between groups |
Corti et al. [61] | RCT | 51 | 20 vs. 80 mg/day simvastatin | 24 months | DIR, FSE PDw, T2w
Related posts: Relationship Between Plaque Echogenicity and Atherosclerosis Biomarkers Relationship Between Plaque Echogenicity and Atherosclerosis Biomarkers
 Quantitative Computed Tomography Analysis in the Assessment of Coronary Artery Disease Quantitative Computed Tomography Analysis in the Assessment of Coronary Artery Disease
 Quantitative MR Analysis for the Assessment of Carotid Atherosclerosis Quantitative MR Analysis for the Assessment of Carotid Atherosclerosis
 Carotid Angioplasty and Stenting Carotid Angioplasty and Stenting
 Segmentation of Carotid Ultrasound Images Segmentation of Carotid Ultrasound Images
 Carotid Plaque Stress Analysis: Issues on Patient-Specific Modeling Carotid Plaque Stress Analysis: Issues on Patient-Specific Modeling
Stay updated, free articles. Join our Telegram channel
Full access? Get Clinical Tree
 Get Clinical Tree app for offline access

|