Fig. 1
Masses encroaching on epidural space of the spinal canal. Mass results in spinal stenosis and, atleast in (a, b), spinal cord compression. Epidural components of the masses are demarcated with yellow dots. a, b Osteolytic lesions can extend into epidural space. c, d Neural foramina, indicated by an arrow, can serve as another avenue for canal invasion
A vast majority of tumors that encroach on the epidural spaces originate from the intravertebral foramina or the vertebral bodies surrounding the spinal canal [3]. In other words, the masses always extend contiguously from the radiopaque bony regions of the spine into the soft tissue and can be discriminated as an intermediate tissue existing between bone and soft tissue. In this work, these spatial constraints are incorporated into conventional intensity based Gaussian mixture model (GMM) as a spatially-constrained Gaussian mixture model (CGMM) [4] for epidural mass detection. A large number of Gaussians is used per tissue in the spinal canal to capture the local spatial feature. The intensity of a tissue is considered a global feature and is modeled by parameters linking all associated Gaussians.
2 Methods
Our method involves the segmentation of the spinal canal and vertebral components of the spine, expansion and refinement of the spinal canal, a mass candidate detection phase, and feature computation and selection phase for support vector machine (SVM) classification. Within the detection phase of the protocol, intensity based K-means clustering is used for initial classification of tissues in the spinal canal, including the epidural masses. Then a CGMM framework is implemented to refine the tissue classification for accurate mass detection. Figure 2 shows the workflow of our procedure.
Fig. 2
Workflow
2.1 Region of Interest Detection
Segmentation of the spinal canal proceeded first with whole spine segmentation, using the watershed algorithm followed by a directed graph search [5]. A four-part vertebra model was then used to locate the vertebral bodies, spinous processes, and left/right transverse processes, with rib structures used to separate vertebral segments. Curved planar reformations were then employed to segment the spinal canal, using the centerline as a backbone [5]. One example of segmented spinal canal is shown in Fig. 3b.
The segmentation of the spinal canal, however, suffers from the ambiguity in discriminating between hyper-attenuating bony and spinal lesion regions within the canal. As a result, many cases under-segment the region of interest within which we expect to detect epidural masses. To contend with this complication, we modified the initial segmentation of the spinal canal by dilating (by 7 mm), thresholding (by 250 HU), and performing connect component analysis to extend the segmentation so that it encompasses the epidural masses. The expansion is demonstrated in Fig. 3c. Expansion of the canal ensured hyperintense masses were included within our search region as were the intravertebral foraminae, which often serves as a source point for epidural masses [3].
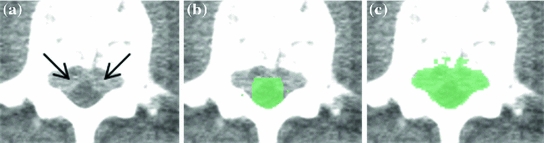
Fig. 3
Epidural mass (a) is not included in initial segmentation of the spinal canal (b), but is included in modified canal segmentation (c)
2.2 K-Means Clustering for Initial Classification
Classification by clustering the intensities of the voxels within the region of interest into  different classes, or K-Means clustering, makes full use of our prior understanding of the arrangements of constituent tissues of the spinal canal. Selecting four different classes allowed us to delineate classes representative of normal intradural soft tissue, hypo-attenuating fatty tissue and vasculature [3], epidural masses, and the partial volume between the bone and soft tissue. An additional fifth class was included to contain bony voxels that had not been successfully removed.
different classes, or K-Means clustering, makes full use of our prior understanding of the arrangements of constituent tissues of the spinal canal. Selecting four different classes allowed us to delineate classes representative of normal intradural soft tissue, hypo-attenuating fatty tissue and vasculature [3], epidural masses, and the partial volume between the bone and soft tissue. An additional fifth class was included to contain bony voxels that had not been successfully removed.2.3 CGMM for Tissue Classification Refinement
The CGMM framework was modified from a method [4] employed to detect multiple sclerosis lesions from MRI images of the brain. To accommodate the spatial feature, we model an image as if its voxels were drawn independently from a mixture of many Gaussians:
where  is the 3D position information included in the spatial vector (spatial parameters),
  is the intensity vector (intensity parameters) associated with the voxel in position
  ,
,  is the number of Gaussians components in the mixture model,
  and
and  are the mean and the covariance of the
  th Gaussian components
  , and
, and  is the
  th mixture coefficient. The spatial feature is incorporated into the probabilistic model. Each Gaussian component in the CGMM represents a probabilistic model for a specific small area in the CT image, therefore
  . Each Gaussian component is linked to a single tissue class and all the Gaussian components related to the same tissue class share the same intensity parameters. Assuming the intensity and spatial features are uncorrelated, we have
 Monitoring of Syndesmophyte Growth in Ankylosing Spondylitis Using Computed Tomography
 Detection and Labelling in Lumbar MR Images
 of Spinal Deformities Using a Parametric Torsion Estimator
 Spine Disc Herniation Diagnosis with a Joint Shape Model
 Segmentation and Discrimination of Connected Joint Bones from CT by Multi-atlas Registration
 Morphological and Appearance Features for Predicting Physical Disability from MR Images in Multiple Sclerosis Patients


(1)
is the 3D position information included in the spatial vector (spatial parameters), is the intensity vector (intensity parameters) associated with the voxel in position , is the number of Gaussians components in the mixture model, and are the mean and the covariance of the th Gaussian components , and is the th mixture coefficient. The spatial feature is incorporated into the probabilistic model. Each Gaussian component in the CGMM represents a probabilistic model for a specific small area in the CT image, therefore . Each Gaussian component is linked to a single tissue class and all the Gaussian components related to the same tissue class share the same intensity parameters. Assuming the intensity and spatial features are uncorrelated, we have(2)
Related posts:
Spine Disc Herniation Diagnosis with a Joint Shape Model
Stay updated, free articles. Join our Telegram channel
Full access? Get Clinical Tree
