Endocrine disease (hyperparathyroidism, Cushing’s disease, hyperthyroidism, hypogonadism)
Chronic renal failure (secondary hyperparathyroidism, osteomalacia, adynamic bone disease)
Gastrointestinal disease (malabsorption syndrome, inflammatory bowel disease, post-gastric bypass)
Rheumatologic disease (rheumatoid arthritis, systemic lupus erythematosus)
Immobilization (prolonged bed rest or immobility, stroke, spinal cord injury)
Drug-induced (glucocorticoids, heparin, antidepressants, antiepileptics, aromatase inhibitors)
Other (anorexia nervosa, cystic fibrosis)
Prevalence
An estimated ten million people in the United States over the age of 50 years have osteoporosis. Approximately 30 % of women over the age of 75 years have sustained at least one vertebral fracture. It is estimated that the incidence of vertebral fractures is 500,000 per patient-year in the United States each year. The number of hip fractures worldwide is estimated to increase to 6.3 million by 2050.
Clinical Presentation
Vertebral fractures commonly occur in patients with osteoporosis. These fractures are asymptomatic or are misinterpreted as mechanical back pain, so they are often underdiagnosed. Many of these fractures are not associated with a preceding traumatic event. Only about one-third of patients with a vertebral compression fracture evident on radiographs will have clinical manifestations, thus leading to underdiagnosis. Severe back pain and loss of height are the most common events which trigger further investigations. When symptomatic though, these fractures have a significant impact on health-related quality of life and functioning. Hip fractures are commonly symptomatic, and have a devastating effect on functioning and quality of life, and are associated with a significant risk of mortality.
Imaging
Plain Radiographs
Plain radiographs are the most commonly utilized modality to assess for fractures in osteoporotic patients. Many of these fractures may be found incidentally, especially vertebral fractures given the asymptomatic symptoms in many cases. Radiographs in osteoporotic patients demonstrate a decrease in radiodensity of the bone with thinning of the bone cortex. Cortical thinning arises as a result of bone resorption in the endosteal, periosteal, and intracortical bone surfaces. On radiographs, these changes are most evident in both the axial skeleton and in the long bones (Fig. 11.1). The trabecular bone, especially is the most common area involved and most evident on radiographs. The earliest changes evident on radiograph are noted within the vertebrae and in the proximal long bones; both are usually not evident unless a significant amount of bone density is lost; thus radiographs are not very sensitive in early disease. As disease progresses there is increase in radiolucency of the vertebral bodies. In addition there is thinning or loss of the normal trabecular pattern of the vertebra bodies. This loss of transverse trabeculae leads to a vertical radiodense “bar” appearance, which is caused by a relative accentuation of remaining vertical trabeculae.
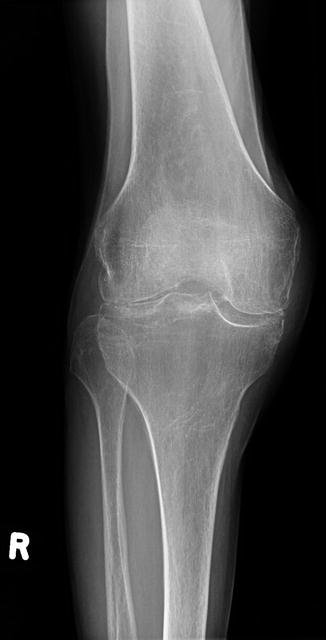
Fig. 11.1
AP radiograph of the right knee with marked osteoporosis with increased radiolucency, diminished cortical thinning, and loss of trabecular pattern
As stated earlier, the risk of fracture increases with progressive disease. Vertebrae are a very common site of fractures, and vertebral fractures are most commonly seen in the thoracic and thoracolumbar regions. Fractures result in a change of the shape of the involved vertebrae (Fig. 11.2). The most classical type of fracture seen in osteoporosis is a vertebral compression fracture, whereby the nature of mechanical forces involved causes a wedged or compressed appearance. This appearance is seen because the anterior portion of the vertebral body is unable to withstand the same degree of compressive force that the posterior portion is able to withstand, thus leading to the anterior wedging appearance. Normally, the posterior height of the thoracic and lumbar vertebrae should measure 1–3 mm more than the anterior height. A vertical height difference greater than 4 mm is considered a true vertebral compression. Vertebral fractures can be graded by their severity on radiographs, judged by the degree of deformity seen. A grade 1 (mild) vertebral fracture involves greater than 20 % but less than 25 % deformity. A grade 2 (moderate) vertebral fracture involves 25–40 % deformity, while a grade 3 (severe) vertebral fracture involves greater than 40 % deformity (Fig. 11.3). Higher-grade vertebral fracture correlates with significant clinical implications, as the risk for sustaining a future vertebral or hip fracture increases with a higher grade of vertebral fracture.
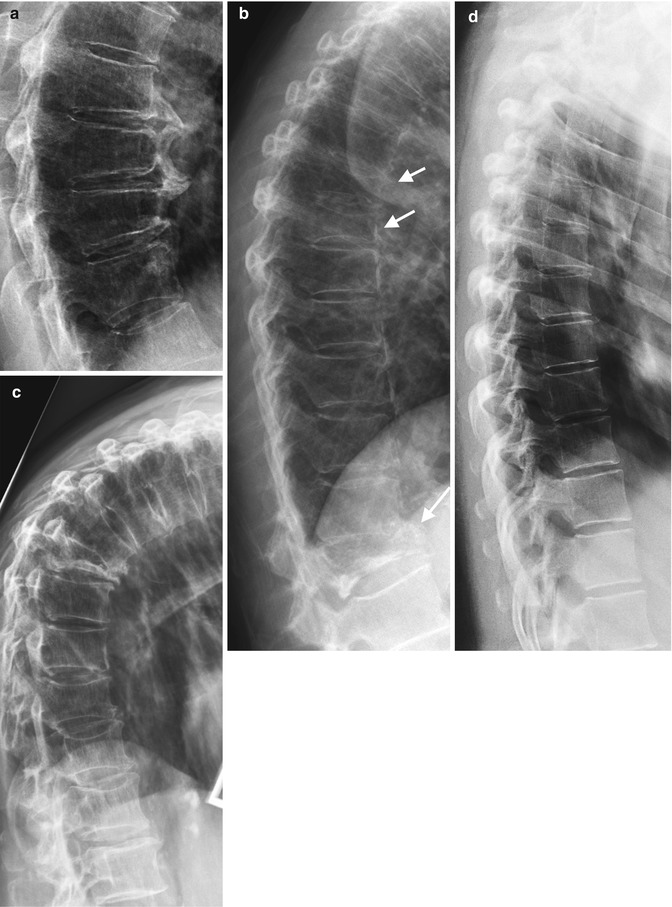
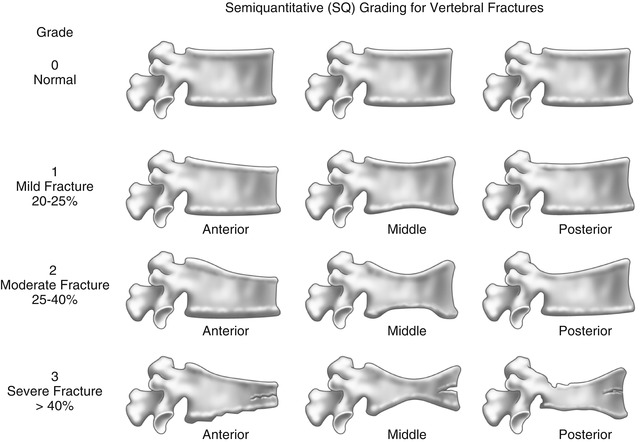
Fig. 11.2
(a) Osteoporotic lower thoracic vertebra on lateral radiography with anterior wedge compression fractures (b) Grade 2 and 3 anterior compression fractures (arrows) (c) Gibbus deformity secondary to compression fractures (d) normal lateral radiograph thoracic spine
Fig. 11.3
Semiquantitative grading (SQ) for vertebral fractures
Aside from an anterior wedged appearance, other vertebral body shapes are seen as a result of fractures that arise from different mechanical forces. One appearance is a pancake vertebra where the vertebral body has lost both its anterior and posterior height; thus it has a flattened appearance reminiscent of a pancake. Another appearance is the codfish vertebra (also known as a fish vertebra), which describes a biconcave appearance of the vertebral body. A codfish vertebra appearance can also be seen in osteomalacia, Paget’s disease, and hyperparathyroidism.
Radiographs of the hands in osteoporotic patients may also reveal characteristic findings. The thinning of cortical bone secondary to endosteal resorption is often seen in osteoporotic patients. The thinning of the cortex of the midportion of the non-dominant second metacarpal is involved, but this is often a late finding. The metacarpal index (MCI), the combined thickness of both cortices at the mid-metacarpal level divided by the with bone at the same level, can be measured for the index finger or as a combined measurement of the second to fourth digits (Fig. 11.4). It is a useful tool in the diagnosis of osteoporosis, can provide a computed BMD DXR measurement, and has been shown to correlate with risk of hip fracture. This is a useful tool that is readily available particularly for longitudinal assessment.
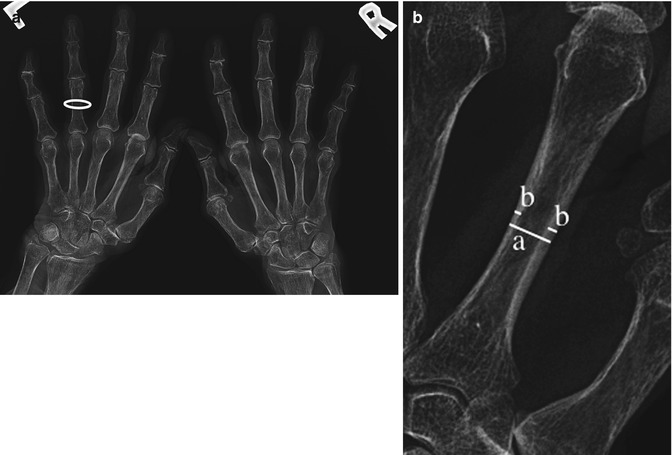
Fig. 11.4
Metacarpal index. (a) PA radiograph of hands with osteoporosis and (b) calculation of metacarpal index of the non-dominant second metacarpal, mid-diaphysis, measure width bone{a} and combined cortical thickness {b}, Index = a/b. References are available for different age groups and ethnicity
In the proximal femur, patterns of trabecular bone loss correlate well with the severity of underlying osteoporosis. Ward’s triangle is an area of diminished trabecular bone seen in the femoral neck of hip radiographs. In osteopenia, when early trabecular resorption occurs, this results in an enlargement of the Ward’s triangle, but it also becomes more indistinct due to loss of trabeculation. This is one of the methods that bone density can be assessed utilizing plain radiographs. With increasing severity of osteoporosis, there is further resorption of all trabecular groups, including the principal compressive group, which contains the most densely packed trabeculae and is seen only in the late stages of osteoporosis (Fig. 11.5).
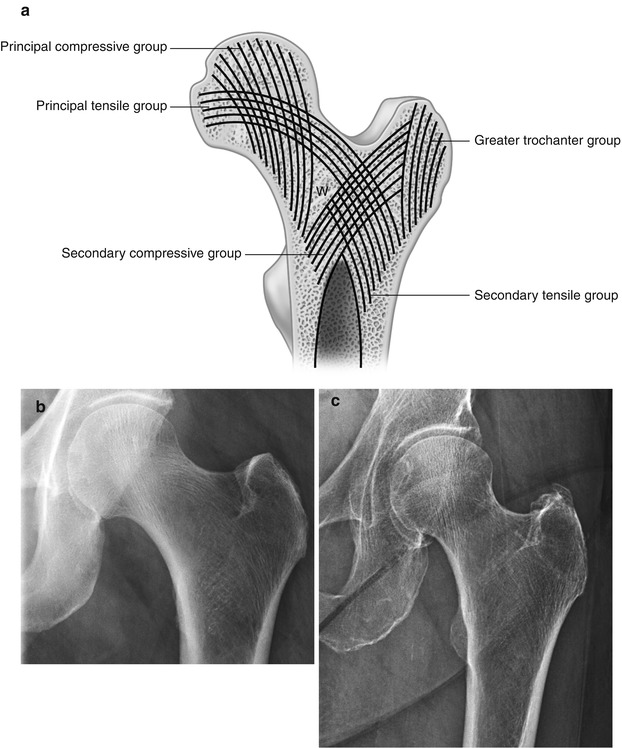
Fig. 11.5
Ward’s triangle. (a) Illustration of trabecular pattern of left femoral head and neck, (b) corresponding normal radiograph, and (c) osteoporotic patient
Similar radiographic changes of cortical thinning and loss of trabeculae can also be seen in other bones of the peripheral skeleton, especially in areas rich in trabecular bone. Insufficiency microfractures may also develop in osteoporotic patients. Common sites of these insufficiency fractures include the symphysis pubis, sacrum, supra-acetabular, pubic rami, calcaneus, pelvis, femoral neck, and sternum (Figs. 11.6 and 11.7). Areas of osteosclerosis may be seen if there are multiple underlying insufficiency fractures with subsequent development of callus in the reparative process.
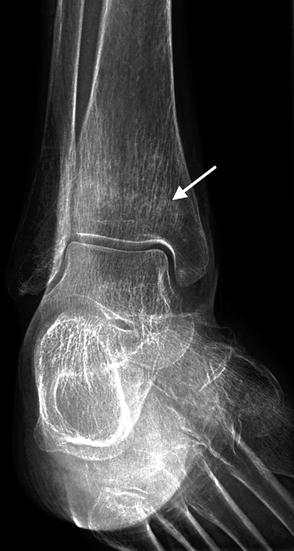
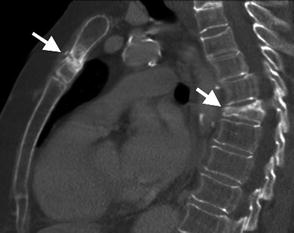
Fig. 11.6
An 80-year-old female with osteoporosis and severe ankle pain, AP ankle radiograph demonstrates diffuse osteoporosis and an ill-defined band of sclerosis (arrow) of the distal tibia in keeping with an insufficiency fracture
Fig. 11.7
Sag reformatted CT of the chest in a 68-year-old female with grade 3 osteoporotic fracture T6 (short arrow) and insufficiency fracture of the manubrium (long arrow)
Dual X-Ray Absorptiometry (Fig. 11.8)
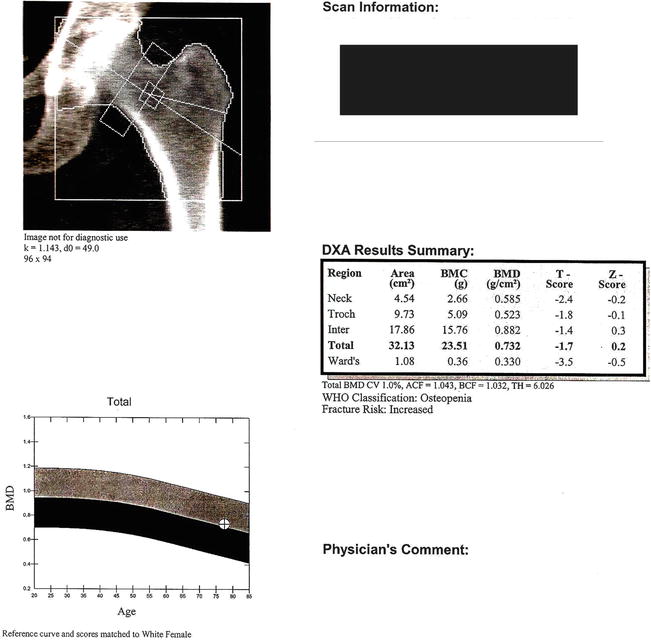
Fig. 11.8
Example of a DEXA scan report, femoral neck
Dual x-ray absorptiometry (DXA) is the gold standard tool for quantifying bone mass and to determine the bone mineral density (BMD). Measurements of BMD are reported as standard deviation units relative to the means of young, healthy reference population (T-score). Measurements are also reported as a standard deviation from age-matched BMDs (z score). The World Health Organization (WHO) uses specific BMD cutoffs for their definition of osteoporosis and osteopenia (Table 11.2). BMD measurements at the lumbar spine (L1 to L5), total hip, and femoral neck are the most common areas utilized. BMD assessment of the distal radius can be acquired if a BMD of the spine or hip cannot be obtained. Distal radius BMD assessments are particularly useful in certain patient populations, such as chronic renal failure patients on hemodialysis and those with severe obesity.
Table 11.2
World Health Organization (WHO) diagnostic categories for osteoporosis based on bone mineral density (BMD)
Category | WHO definition |
|---|---|
Normal | A BMD T-score of −1.0 or better |
Osteopenia | A BMD T-score between −1.0 and −2.5 |
Osteoporosis | A BMD T-score of −2.5 or lower |
Epidemiological studies have demonstrated that BMD is a strong predictor of sustaining an osteoporotic fracture, and this relationship is independent of patient age. BMD measured by DXA accounts for about 70 % of the estimated bone strength. As the BMD declines, there is a corresponding increase in fracture risk. In general, each standard deviation decline in BMD increases the risk of fracture by 1.5- to 3-folds. A meta-analysis found that for each standard deviation decrease in femoral neck BMD, there is an associated 2.6-fold increase risk in sustaining a hip fracture. There is also an inverse relationship between BMD decline and the severity of fractures sustained, with an increased risk of sustaining malunion and early instability seen in patients with severely low BMDs. The majority of women under age of 50 years have a normal BMD unless there is a secondary cause of bone loss. However, with aging, BMD assessed by DXA gradually declines. By age 80, about 27 % of women will have a BMD in the osteopenic range, and 70 % will have a BMD in the osteoporotic range in at least one site.
Quantitative Computed Tomography
Quantitative computed tomography (QCT) is another imaging modality to quantify bone density. QCT can reliably measure the BMD at the spine, proximal femur, and forearm. However, the benefit of QCT over standard DXA assessment is the ability to provide a true volumetric measurement of BMD rather than the areal measurement provided by DXA. This allows QCT to provide a more accurate measurement of bone density than what the DXA measurements allow. QCT can also differentiate between the densities of cortical and trabecular bone. QCT measurements are usually performed on the vertebrae, but there is a growing availability of peripheral QCT scanners (pQCT), which allows for the analysis of the forearm, tibia, and other sites. In addition, pQCT measurement of BMD at the tibia has been shown to provide highly reproducible measurements of total, cortical, and trabecular bone density. The pQCT scans have also been shown to provide accurate measurements of the muscle and fat cross-sectional area of the calf. In addition to having a low BMD as a risk factor for fracture, a newer concept is to assess for sarcopenia, which is the loss of skeletal muscle mass. Muscle density assessed by pQCT at the calf has been shown to be an independent risk factor for a history of fragility fractures in postmenopausal women.
MR Imaging
Magnetic resonance imaging (MRI) has become an increasingly useful tool in the management of patients with osteoporosis. The microstructure of bone can be assessed using micromagnetic resonance imaging (μMRI) and high-resolution magnetic resonance imaging (hrMRI). Therefore, it allows for the assessment of bone quality, in addition to just bone quantity, which is the bone density. These MRI imaging techniques have been established for peripheral imaging assessment of the distal radius, tibia, and calcaneus. The trabecular architecture derived on MR imaging correlates well with the underlying bone architecture seen on bone histology, thus providing an excellent assessment of underlying bone quality. In addition to providing a bone density measurement, MR imaging also provides additional information which can identify patients who sustained a fragility fracture. These MRI studies however are not widely available clinically.
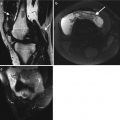
Another clinically important utility of MR imaging in the setting of osteoporosis is its role in assessment of vertebral compression fracture (Fig. 11.9). MR imaging can help differentiate between a fracture related to osteoporosis versus a pathological fracture related to skeletal metastasis. In normal vertebrae, there is high signal intensity on T1-weighted images and an intermediate signal intensity on T2-weighted images in keeping with hemopoietic marrow mixed with normal fatty marrow SI. In the setting of bone metastasis, there is variable localized change in SI, dependent in turn on the mineralization of the metastatic deposit, e.g., osteoblastic metastatic deposit is low SI on T1 and T2, whereas an osteolytic metastatic deposit is high SI on T2 and intermediate to low on T1. Usually in the presence of a metastatic-related pathological fracture, the vertebral lesion is obscured by the acute edema related to vertebral collapse; however other deposits in the remaining vertebrae should be sought out to help arrive at a diagnosis (Fig. 11.10). Marrow infiltration with myeloma and lymphoma are also common etiologies of pathological fractures and demonstrate loss of normal marrow SI. In general 25 % of vertebral fractures in osteoporotic patients are pathological, and approximately 33 % of fractures in patients with known malignancy are benign. Helpful differentiating features suggesting a pathological fracture include the following: metastatic deposits or marrow infiltration within other vertebra, diffuse edema vertebral body with extension into the posterior elements, convex posterior cortex, paravertebral/epidural soft tissue mass, poorly formed fracture line, and persistent abnormal SI on follow-up imaging.
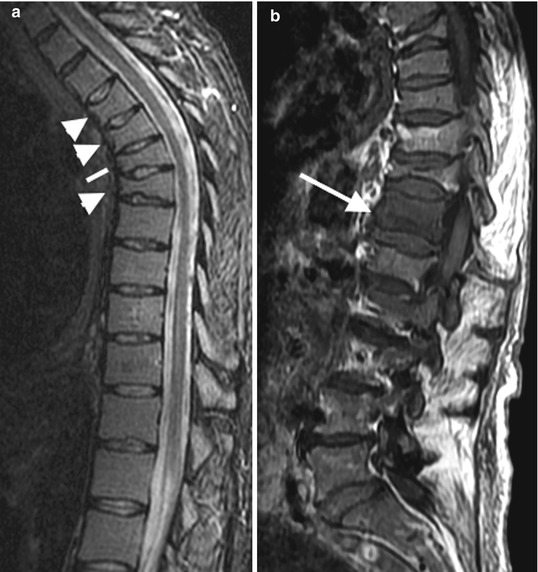
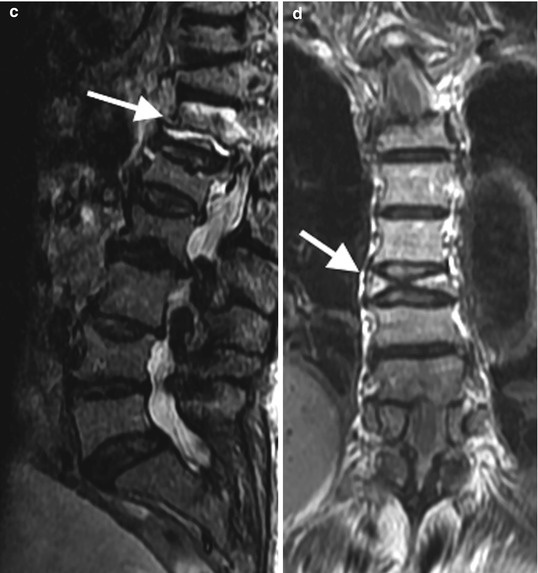
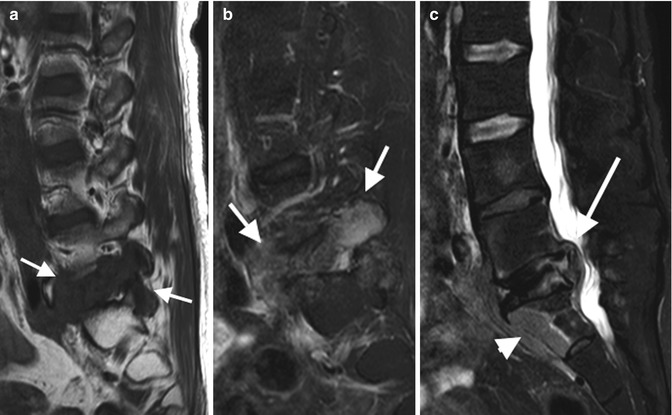
Fig. 11.9
(a) Benign compression thoracic fractures (arrowheads and line) of a 76-year-old female with history of osteoporosis. Low SI on Sag T2FS and normal marrow SI on T1 (not shown). (b) & (c) A 75-year-old female with history of OP vertebral fractures and acute lower thoracic pain demonstrates low-SI marrow diffusely at T12 on T1 and high SI on T2FS (arrows) and low T1 and high T2 SI fracture line paralleling the inferior endplate (arrow). (d) Cor T1 demonstrating a benign biconcave compression fracture
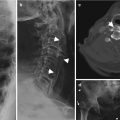
Fig. 11.10
A 49-year-old female with previous cervical carcinoma, presenting with metastatic disease with low-SI lesion at L5 on T1 (a) and high SI on T2 (b) (arrows), vertebral plana of L5 with posterior displacement of vertebral and soft tissue into spinal canal with secondary canal stenosis (c) (long arrow), on Sag T2FS paravertebral soft tissue thickening, and metastatic deposit at S1 (arrowhead)
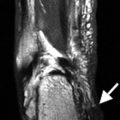
MR imaging is also a useful tool in detecting insufficiency fractures at extra-spinal sites. Bone marrow edema seen on MR is an early change associated with insufficiency fractures (Fig. 11.11). This edema has a low signal on T1-weighted images and a high signal on T2-weighted images. MR has a high sensitivity and specificity in detecting insufficiency fractures, especially in the pelvic bones, femoral neck, and intertrochanteric region. MR is a superior modality compared to either CT or plain radiographs in detecting insufficiency fractures and remains the modality of choice when an insufficiency fracture is in question.
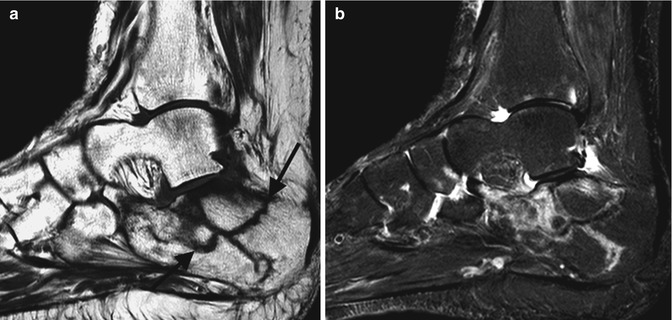
Fig. 11.11
Insufficiency fractures, acute and chronic, of the calcaneus. MRI of a 69-year-old female. (a) Sag T1 and (b) T2FS with low-SI fracture lines on T1 (black arrows) and surrounding bone marrow edema and high SI on T2
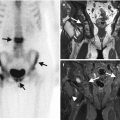
Nuclear Imaging
Bone scintigraphy can be a useful nuclear medicine test which can assess bone lesions and the underlying bone metabolic status. These properties allow for it to be a useful tool in the assessment of metabolic bone diseases. It has little role in the diagnosis of uncomplicated osteoporosis. However, it is a useful tool to diagnose vertebral fractures and is useful in assessing the age of a vertebral fracture. However, MR imaging remains the modality of choice when the goal is to differentiate an acute vertebral fracture from a chronic one. In addition, bone scintigraphy can also be utilized to identify fractures at other sites, including the ribs, pelvis, and hips.
Summary
Osteoporosis is a common form of metabolic bone disease primarily seen in the elderly population, but can be seen in younger patients if a secondary cause is present. A decline in BMD subsequently increases the risk of sustaining a fracture. Osteoporotic fractures have been shown to increase patient morbidity and have a significant impact on patient health-related quality of life. Hip and vertebral fractures are also associated with increased mortality rates. Since many patients with osteoporosis are asymptomatic, even many with a prevalent vertebral fracture, screening strategies for the high-risk population are required. BMD assessment with DXA remains the gold standard. However, newer modalities including QCT and MR imaging provide insight into the underlying bone microarchitecture which provide important information into the underlying bone quality instead of just bone quantity. These modalities also provide insight into muscle and fat interactions, which may also play an important role in predicting those at high risk for fractures.
Related posts:

Stay updated, free articles. Join our Telegram channel

Full access? Get Clinical Tree


