Primary site
Percentage of all brain metastases
Median interval (mo) Dx to brain metastases
Lung cancer
51
2–9
Non-small cell
44
Small cell lung cancer
7
Breast cancer
15
24–40
Melanoma
11
15–41
Renal cell carcinoma
7
12–27
Gastrointestinal cancers
5
22–33
Other
11
2 Prognosis
2.1 Natural Course and Cause of Death
If brain metastases are not treated, the median survival is expected to be approximately 10 weeks (Horton et al. 1971). With steroids and whole brain radiation, the median survival is 4–6 months (Patchell et al. 1990; Noordjik et al. 1994; Mintz et al. 1996; Andrews et al. 2004). Clinical trials over the past 50 years have demonstrated a gradual shift in the cause of death from neurologic to non-neurologic. The early RTOG trials (Borgelt et al. 1980; Kurtz et al. 1981) showed approximately 50 % of patients died of neurologic causes whereas the most recent trials show less than 20 % of patients with brain metastases die from neurologic causes (Sperduto et al. 2013). This reflects not only the improvements in treatment for brain metastases as well as the refractory nature of systemic disease.
2.2 Prognostic Indices
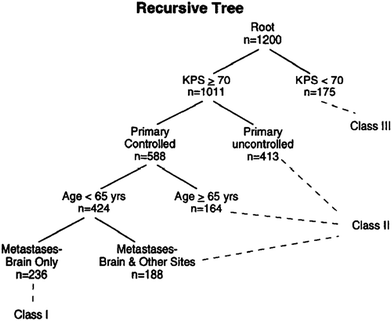
As recently as 1997, a radiation oncology textbook recommended the following rudimentary functional scale be used to assess prognosis in patients with brain metastases: Level I—fully functional, able to work; Level II—fully functional, not able to work; Level III—stays in bed, needs help half the time, and; Level IV—requires help all the time (Kagan 1997). The original work on more formal prognostic indices for patients with brain metastases dates back to 1997, when Gaspar et al. published a seminal manuscript on a prognostic index for patients with brain metastases, the Radiation Therapy Oncology Group‘s Recursive Partitioning Analysis (RTOG-RPA) (Fig. 1) (Gaspar et al. 1997). The RTOG-RPA was based on age, Karnofsky performance status (KPS), whether the primary tumor was controlled, whether extracranial metastases were present or absent. The median survival for patients with RPA class I, II and III were 7.1, 4.2 and 2.3 months, respectively. The index was validated and quickly adopted for purposes of stratification in clinical trials (Gaspar et al. 2000). (Weaknesses of the RTOG-RPA are that it is not diagnosis-specific and the determination of both primary tumor control and the presence of extracranial metastases can vary widely based on the type, technique and timing of restaging studies. Other previously published indices (Score Index for Radiosurgery (SIR) and the Basic Score for Brain Metastases (BSBM)) share the same weaknesses (Weltman et al. 2000; Lorenzoni et al. 2004) (Tables 2, 3). The SIR was found to be more predictive of survival in radiosurgery patients than the RPA. The median survival for patients who scored from 1–3, 4–7, and 8–10 was 2.91, 7 and 31.38 months, respectively (p = 0.0001) Similarly, the BSBM was more predictive of survival following radiosurgery than the RPA but was proposed as a simpler method than SIR. The median survival for patients who scored 3, 2, 1 or 0 was more than 32, 13.1, 3.3, and 1.9 months, respectively (p < 0.0001).


Fig. 1
Recursive partitioning analysis (RPA)
Table 2
Score index for radiosurgery (SIR)
0 | 1 | 2 | |
|---|---|---|---|
Age (years) | >60 | 51–59 | <50 |
Karnofsky performance status | <50 | 60–70 | >70 |
Systemic disease status | PD | PR-SD | CR-NED |
Largest lesion volume (cc) | >13 | 5–13 | <5 |
Number lesions | >3 | 2 | 1 |
Table 3
Basic score for brain metastases (BS-BM)
0 | 1 | |
|---|---|---|
KPS | 50–70 | 80–100 |
Control of primary tumor | No | Yes |
Extracranial metastases | Yes | No |
The graded prognostic assessment (GPA) is a newer prognostic index for patients with brain metastases (Sperduto et al. 2008). This prognostic index was originally developed from a database of 1,960 patients accrued to four Radiation Therapy Oncology Group (RTOG) protocols for patients with brain metastases treated with whole brain radiation therapy (WBRT) (Sause et al. 1993; Murray et al. 1997; Komarnicky et al. 1991; Phillips et al. 1994). The diagnosis-specific prognostic indices was then refined based on a second, independent multi-institutional retrospective analysis of 4,259 other patients with brain metastases from breast carcinoma, small cell and non-small cell lung carcinoma, gastrointestinal cancers, melanoma and renal cell carcinoma treated with WBRT and/or SRS (Sperduto et al. 2010). The breast cancer-specific GPA index was then further refined using additional variables, including HER2 and ER/PR status (Sperduto et al. 2012b). In that study, two statistical methodologies, multivariate Cox regression (MCR) and recursive partitioning analysis (RPA), were used to identify and weight the prognostic factors that were significant for each diagnosis. The prognostic factors significant for survival vary by diagnosis and each are weighted in proportion to their regression coefficients. All of the diagnosis-specific GPA scales are set on a 4.0 scale in which a GPA of 4.0 represents the best prognosis and 0.0, the worst. A user-friendly worksheet to calculate a patient’s GPA is shown in Table 4 (Sperduto et al. 2012a). The median survival by diagnosis and GPA is shown in Table 5.
Table 4
Diagnosis-specific prognostic factors and graded prognostic assessment (GPA) worksheet to estimate survival for newly diagnosed brain metastases
GPA scoring criteria | Patient | ||||||
|---|---|---|---|---|---|---|---|
Non-small cell and small cell lung cancer | Prognostic factor | 0 | 0.5 | 1.0 | Score | ||
Age | >60 | 50–60 | <50 | __ | |||
KPS | <70 | 70–80 | 90–100 | __ | |||
ECM | Present | – | Absent | __ | |||
#BM | >3 | 2–3 | 1 | __ | |||
Sum total | __ | ||||||
MST (mo) by GPA: 0–1.0 = 3.0, 1.5–2.0 = 5.5, 2.5–3.0 = 9.4, 3.5–4.0 = 14.8 | |||||||
Melanoma | Prognostic factor | 0 | 1.0 | 2.0 | Score | ||
KPS | <70 | 70–80 | 90–100 | __ | |||
#BM | >3 | 2–3 | 1 | __ | |||
Sum total | __ | ||||||
MST (mo) by GPA: 0–1.0 = 3.4, 1.5–2.0 = 4.7, 2.5–3.0 = 8.8, 3.5–4.0 = 13.2 | |||||||
Breast cancer | Prognostic factor | 0 | 0.5 | 1.0 | 1.5 | 2.0 | Score |
KPS | ≤50 | 60 | 70–80 | 90–100 | N/a | __ | |
Subtype | Basal | N/a | LumA | HER2 | LumB | __ | |
Age | ≥60 | <60 | N/a | N/a | N/a | __ | |
Sum total | __ | ||||||
Subtype: | Basal = Triple negative (ER/PR/HER2-neg) | ||||||
LumA = Luminal A (ER/PR-pos, HER2-neg) | |||||||
LumB = Luminal B (Triple Positive, ER/PR/HER2-pos) | |||||||
HER2 = HER2-pos, ER/PR-neg | |||||||
MST (mo) by GPA: 0–1.0 = 3.4, 1.5–2.0 = 7.7, 2.5–3.0 = 15.1, 3.5–4.0 = 25.3 | |||||||
Renal cell carcinoma | Prognostic factor | 0 | 1.0 | 2.0 | Score | ||
KPS | <70 | 70–80 | 90-100 | __ | |||
#BM | >3 | 2–3 | 1 | __ | |||
Sum total | __ | ||||||
MST (mo) by GPA: 0–1.0 = 3.3, 1.5–2.0 = 7.3, 2.5–3.0 = 11.3, 3.5–4.0 = 14.8 | |||||||
GI cancers | Prognostic Factor | 0 | 1 | 2 | 3 | 4 | Score |
KPS | <70 | 70 | 80 | 90 | 100 | __ | |
MST (mo) by GPA: 0–1.0 = 3.1, 2.0 = 4.4, 3.0 = 6.9, 4.0 = 13.5 | |||||||
Table 5
Median survival time (MST) by graded prognostic assessment (GPA) score
Diagnosis | Overall MST (months) | MST (months) by diagnosis-specific GPA | |||
|---|---|---|---|---|---|
GPA 0–1 | GPA 1.5–2 | GPA 2.5–3 | GPA 3.5–4 | ||
NSCLC | 7.0 | 3.0 | 5.5 | 9.4 | 14.8 |
SCLC | 4.9 | 2.8 | 4.9 | 7.7 | 17.1 |
Melanoma | 6.7 | 3.4 | 4.7 | 8.8 | 13.2 |
Renal cell | 9.6 | 3.3 | 7.3 | 11.3 | 14.8 |
GI | 5.4 | 3.1 | 4.4 | 6.9 | 13.5 |
Breast | 13.8 | 3.4 | 7.7 | 15.1 | 25.3 |
Total | 7.2 | 3.1 | 5.4 | 9.6 | 16.7 |
3 Treatment Options, Outcomes and Toxicity
3.1 General Principles
Recently published evidence-based guidelines reflect the many options and nuances of managing this patient population (Linskey et al. 2010; Tsao et al. 2012; Mehta et al. 2005; Kalkanis et al. 2010). A common problem faced by clinicians when attempting to interpret guidelines is that the term “in selected patients” has become so ubiquitous in guidelines and review articles that it renders them edentulous. This creates a heuristic imbroglio of clinical science, defeating the purpose of the guidelines and suggesting almost any treatment option is acceptable. Only randomized trials provide Level I evidence and are summarized in Table 6. Notably 11 randomized trials of chemotherapy and four randomized trials of radiosensitizers have failed to a survival benefit. (Sperduto 2013, French, Robinet, DeAngelis 1989a, Postmus, Ushio, Antonadou, Mornex, Knisely, Neuhaus, Lee, Aiken, Suh, Mehta, Eyre).
Table 6
Selected randomized trials in patients with brain metastases and summary conclusions
Topic | Author | Year | N | Conclusion |
|---|---|---|---|---|
A. WBRT versus WBRT + S in patients with solitary operable brain metastases | Patchell (NEJM) | 48 | Surgery improves survival from 15 to 40 weeks (p < 0.01) | |
Noordjik (IJROP) | 63 | Surgery improves survival from 6 to 10 months (p < 0.04) | ||
Mintz (Cancer) | 84 | Surgery did not improve survival | ||
B. S versus S + WBRT in patients with solitary operable brain metastasis | Patchell (JAMA) | 95 | WBRT decreases recurrence rate in brain from 70 to 18 % (p < 0.001), not powered to assess survival | |
Kocher (JCO)
Stay updated, free articles. Join our Telegram channel
Full access? Get Clinical Tree
 Get Clinical Tree app for offline access

|


