Model Variables

image descriptor of supervoxel n in subject s

genetic location of minor allele m in subject s

subject-specific topic that generates super-voxel n in subject s, 

subject-specific topic that generates minor allele m in subject s, 

population-level topic that serves as subject-specific topic t in subject s, 
v
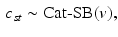
parameter vector that determines the stick-breaking proportions of topics in a population template

parameter vector that determines the stick-breaking proportions of topics in subject s

mean and covariance matrix of image descriptors for population-level topic k

frequency of different locations in genetic signatures for population-level topic k

hyper-parameters of the Beta prior for v

hyper-parameters for the Beta prior for 

hyper-parameters of the Normal-Inverse-Wishart prior for 

hyper-parameters of the Dirichlet prior for 
VB Estimates

mean and covariance of image descriptors for population-level topic k

frequency of different locations in genetic signatures for population-level topic k
2 Model
In this section, we describe the generative model for image and genetic data based on a population-wide common patterns that are instantiated in each subject. Our notation is summarized in Table 1 and the generative process is illustrated in Fig. 1.
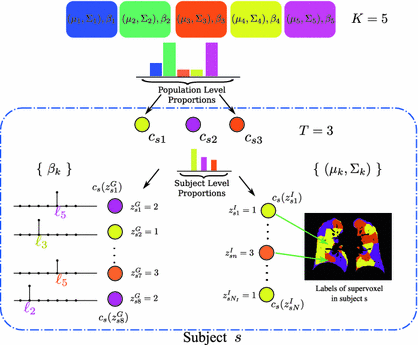
Fig. 1.
Subject s draws a subset of T topics from K population-level topics. Indices of the subject-level topics are stored in  drawn from a categorical distribution. At the subject level, indices of the supervoxels
  and locations of minor alleles
  are drawn from the subject-specific categorical distribution. Vector
  acts as a map from subject-specific topics to the population-level topics (i.e.,
  or
or  ).
).
drawn from a categorical distribution. At the subject level, indices of the supervoxels and locations of minor alleles are drawn from the subject-specific categorical distribution. Vector acts as a map from subject-specific topics to the population-level topics (i.e., or ).Image and Genetic Data. We assume each subject in a study is characterized by an image and a genetic signature for the loci in the genome previously implicated in the disease. Based on the analogy to the “bag-of-words” representation [14], we assume that an image domain is divided for each subject into relatively homogeneous spatially contiguous regions (i.e., “supervoxels”). We let  denote the D-dimensional descriptor of supervoxel n in subject s that summarizes the intensity and texture properties of the supervoxel. The genetic data in our problem comes in a form of minor allele counts (0, 1 or 2) for a set of L loci. Our representation for genetic data is inspired by the commonly used additive model in GWAS analysis [4]. In particular, we assume that the risk of the disease increases monotonically by the minor allele count. We let
  denote minor allele m in genetic signature of subject s. For example, suppose
  , and subject s has one and two minor alleles in locations
  and
and  respectively. This subject is represented by a list of 3 elements
  .
.
denote the D-dimensional descriptor of supervoxel n in subject s that summarizes the intensity and texture properties of the supervoxel. The genetic data in our problem comes in a form of minor allele counts (0, 1 or 2) for a set of L loci. Our representation for genetic data is inspired by the commonly used additive model in GWAS analysis [4]. In particular, we assume that the risk of the disease increases monotonically by the minor allele count. We let denote minor allele m in genetic signature of subject s. For example, suppose , and subject s has one and two minor alleles in locations and respectively. This subject is represented by a list of 3 elements .Population Model. Our population model is based on the Hierarchical Dirichlet Process (HDP) [17]. The model assumes a collection of K “topics” that are shared across subjects in the population. We let  and
and  denote the distributions for the image and genetic signatures, respectively, associated with topic k. Each
  is a Gaussian distribution that generates supervoxel descriptors
  ; it is parameterized by its mean vector
  and covariance matrix
  . Each
  is a categorical distribution that generates minor allele locations
  ; it is parameterized by its weight vector
  .
.
and denote the distributions for the image and genetic signatures, respectively, associated with topic k. Each is a Gaussian distribution that generates supervoxel descriptors ; it is parameterized by its mean vector and covariance matrix . Each is a categorical distribution that generates minor allele locations ; it is parameterized by its weight vector .When sampling a new subject s, at most  topics are drawn from the population-wide pool to determine the image and genetic signature of this subject. We let
  denote the population topic selected to serve as subject-specific topic t (
 ) in subject s. We also use
 ![$$c_s=[c_{s1},\ldots ,c_{sT}]$$](/wp-content/uploads/2016/09/A339424_1_En_3_Chapter_IEq45.gif) to refer to the entire vector of topics selected for subject s.
to refer to the entire vector of topics selected for subject s. ![$$c_{s}[t] = k$$](/wp-content/uploads/2016/09/A339424_1_En_3_Chapter_IEq46.gif) indicates that population-level topic k was selected to serve as subject-specific topic t. The subject-specific topics inherit their signature distributions from the population prototypes, but each subject is characterized by a different subset and proportions of the population-level topics represented in the subject-specific data.
indicates that population-level topic k was selected to serve as subject-specific topic t. The subject-specific topics inherit their signature distributions from the population prototypes, but each subject is characterized by a different subset and proportions of the population-level topics represented in the subject-specific data.
topics are drawn from the population-wide pool to determine the image and genetic signature of this subject. We let denote the population topic selected to serve as subject-specific topic t () in subject s. We also use to refer to the entire vector of topics selected for subject s. indicates that population-level topic k was selected to serve as subject-specific topic t. The subject-specific topics inherit their signature distributions from the population prototypes, but each subject is characterized by a different subset and proportions of the population-level topics represented in the subject-specific data.As  , this model converges to a non-parametric Hierarchical Dirichlet Process (HDP) [17]. Rather than choose specific values for T and K, HDP enables us to estimate them from the data. As part of this model, we employ the “stick-breaking” construction [17] to parameterize the categorical distribution for
  :
:
where  is a categorical distribution whose weights are generated through the stick-breaking process from the (potentially infinite) parameter vector v whose components are in the interval (0, 1). Formally, if we define a random variable
 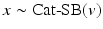 , then
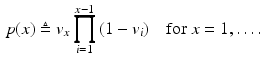
This parameterization accepts infinite alphabets. The stick-breaking construction penalizes high number of topics hence encouraging parsimonious representation of data. A similar construction enables an automatic selection of the number of topics at the population level and at the subject level. We employ a truncated HDP variant that uses finite values for T and K [9]. In this setup,  . In contrast to finite (fixed) models, we set K to high enough value, and the estimation procedure uses as many topics as needed but not necessarily all K topics to explain the observations.
, this model converges to a non-parametric Hierarchical Dirichlet Process (HDP) [17]. Rather than choose specific values for T and K, HDP enables us to estimate them from the data. As part of this model, we employ the “stick-breaking” construction [17] to parameterize the categorical distribution for :(1)
is a categorical distribution whose weights are generated through the stick-breaking process from the (potentially infinite) parameter vector v whose components are in the interval (0, 1). Formally, if we define a random variable , then(2)
. In contrast to finite (fixed) models, we set K to high enough value, and the estimation procedure uses as many topics as needed but not necessarily all K topics to explain the observations.Subject-Specific Data. To generate an image descriptor for supervoxel n in subject s, we sample random variable 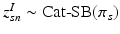 from a categorical distribution parameterized by the vector of stick-breaking proportions
  .
.  indicates that the subject-specific topic t generates image descriptor
  :
:
![$$\begin{aligned} I_{sn} | z^I_{sn}, c_s \sim \mathcal {N} \left( \mu _{c_s[z^I_{sn}]}, \varSigma _{c_s[z^I_{sn}]} \right) \!. \end{aligned}$$](/wp-content/uploads/2016/09/A339424_1_En_3_Chapter_Equ3.gif)
 Stable Overlapping Replicator Dynamics for Multimodal Brain Subnetwork Identification
 PET Reconstruction with Sparse Image Representation and Anatomical Priors
 Gaussian Process-Based Modelling and Prediction of Image Time Series
 Segmentation and Registration Through the Duality of Congealing and Maximum Likelihood Estimate
 Tumor Growth Prediction with Multiplicative Growth and Image-Derived Motion
 Frames for Heart Fiber Reconstruction


from a categorical distribution parameterized by the vector of stick-breaking proportions . indicates that the subject-specific topic t generates image descriptor :Related posts:
Stable Overlapping Replicator Dynamics for Multimodal Brain Subnetwork Identification
PET Reconstruction with Sparse Image Representation and Anatomical Priors
Stay updated, free articles. Join our Telegram channel
Full access? Get Clinical Tree
