Chapter 6 Mitral Stenosis
Introduction
Mitral stenosis is quite uncommon in Western countries, yet it still is a frequent problem worldwide, particularly in developing countries. The low incidence in the United States, in particular, is largely because rheumatic fever resulting in rheumatic heart disease has been largely eradicated; nevertheless, occasional outbreaks do occur. The occurrence of rheumatic fever in Utah in the mid-1980s and early 1990s is notable.1,2 That particular outbreak had two unusual aspects. First, as opposed to previous history of outbreaks typically appearing in lower socioeconomic groups, this outbreak seemed to affect the middle class. Second, there was a distressingly low incidence of a symptomatic streptococcal infection in the group developing rheumatic fever.
Rheumatic heart disease preferentially affects the mitral valve, with the order of involvement being (1) mitral, (2) aortic, (3) tricuspid, and (4) pulmonic. The mitral valve is involved in virtually all cases, whereas the aortic valve is affected in 20% to 25% of cases. Pulmonary valve involvement in rheumatic heart disease is exceedingly rare. Even though the tricuspid valve frequently is involved, tricuspid valvular disease often is clinically silent.3 From a functional standpoint, however, approximately 25% of patients with rheumatic heart disease have pure mitral stenosis and 40% have a combination of mitral stenosis and mitral regurgitation.4 Two thirds of all patients with rheumatic mitral stenosis are female5; however, in my experience, it is almost 90%. In the United States and other Western countries, mitral stenosis develops over a period of decades, with a mean age of onset of 45 years. However, for reasons that are not entirely understood, individuals in developing countries such as India, in Africa, and in Alaskan Inuits, the time from rheumatic fever to onset of clinically significant mitral stenosis can be as little as 10 years. The factors for this rapid onset, however, appear to be more socioeconomic than necessarily related to specific medical care.6,7
Cardiac Imaging and Real-Time Three-Dimensional Echocardiography
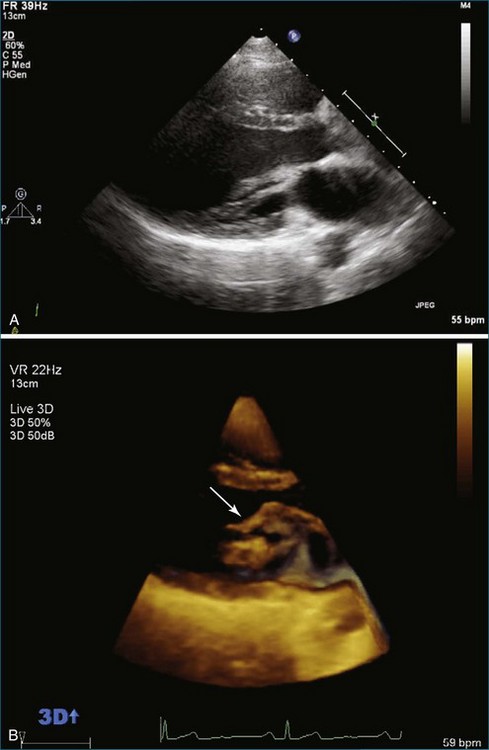
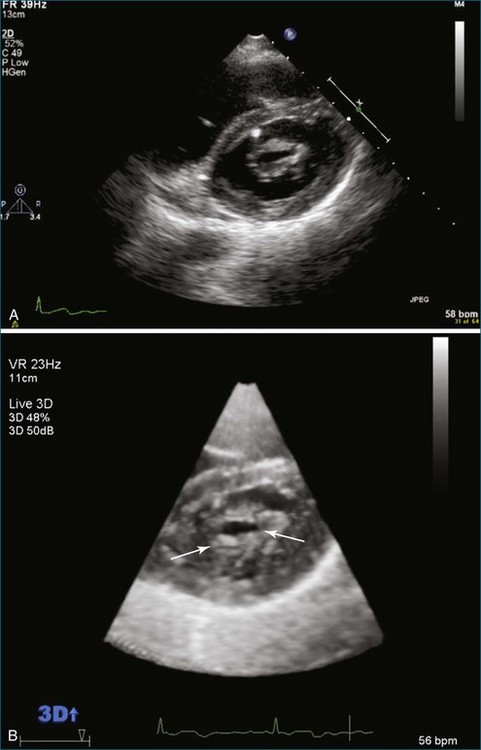
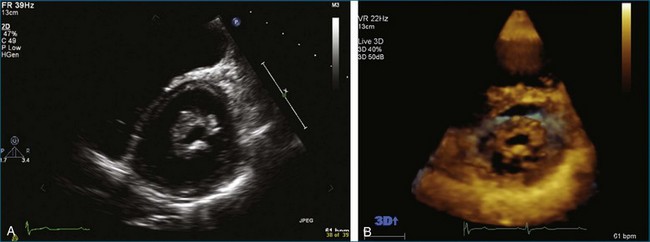
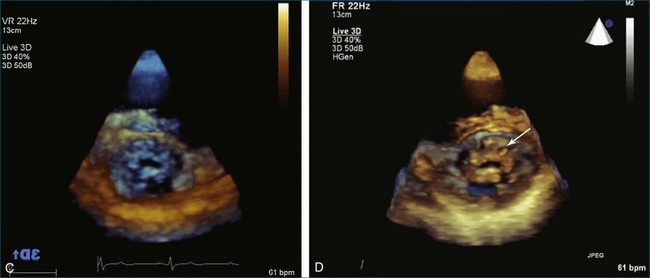
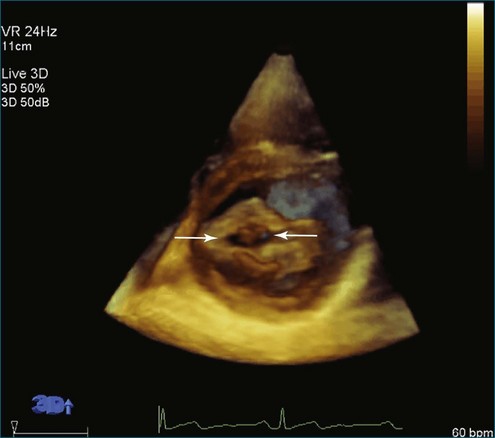
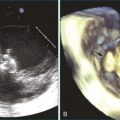
From the standpoint of cardiac imaging, echocardiography is clearly the mainstay for evaluation of mitral stenosis. The extent of mitral valvular deformity traditionally has been evaluated by two-dimensional (2D) echocardiography and graded based on a score of 0 to 4 for each of four factors: (1) valvular thickening, (2) valvular mobility, (3) degree of leaflet calcification, and (4) extent of subvalvular thickening and calcification.8 The Wilkins scoring system does have several drawbacks, however. In particular, some patients with a high Wilkins score still respond well to percutaneous mitral valvuloplasty (PMV). Three-dimensional (3D) echocardiography provides incremental information regarding the status of rheumatic involvement of the mitral valve, particularly regarding the fusion of the commissures. Determination of the status of commissural fusion, particularly the symmetry and length of commissural fusion, is critical information to predict the success of treatment of mitral stenosis with PMV.9 That is, mitral valvuloplasty is most effective when extensive symmetric commissural fusion is present and when such fusion is alleviated at the time of the procedure. 3D echocardiography (3DE) has a particular strength for visualizing the mitral commissures and commissural fusion because of the added dimension of elevation (Figures 6-1 to 6-5; Videos 6-1 to 6-9). The elevation dimension allows clearer assessment of the degree and length of commissural fusion as well as the presence of structures that could inhibit the process, such as rheumatic nodules and subvalvular (typically chordal) thickening. Although in mitral stenosis symmetric commissural fusion is the optimal morphology for PMV success, evidence indicates that if the commissural fusion is accompanied by significant calcification, results are not as satisfactory, which is a predictable finding.10–12
Mitral Valve Area Determination
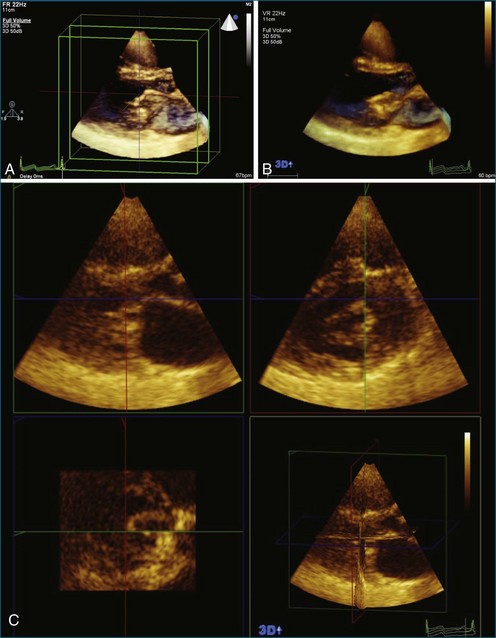
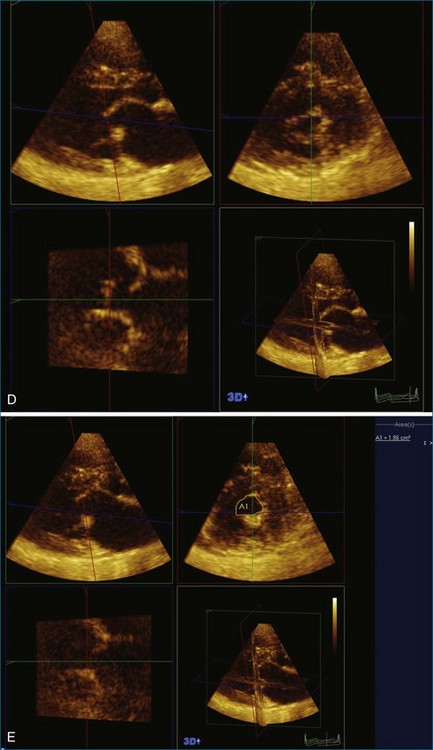
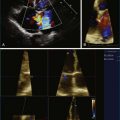
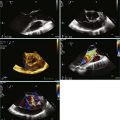
The severity of mitral stenosis can be determined by several echocardiographic measures: peak and mean pressure gradient by Doppler and mitral valve area by (1) Doppler pressure half-time, (2) Doppler-based continuity equation, and (3) direct planimetry of the mitral valve area by 2DE or 3DE. Direct planimetry of the mitral valve orifice by real-time 3DE (RT3DE) has now emerged as the gold standard, thanks to several investigations and publications.13–20 RT3DE quantification of the mitral valve orifice begins with a full-volume RT3D transthoracic echocardiography (RT3DTTE) acquisition obtained in the parasternal long-axis orientation. From this full-volume dataset, the mitral valve can be cropped to obtain an en face view of the mitral orifice. A precise en face image of the stenotic mitral valve is crucial for accurate measurement of the mitral valve area. In addition to being lined up with the tips of the mitral valve leaflets using the orthogonal plane, the en face view can be panned above and below the valve and viewed from the atrial and ventricular sides. The cropping function markedly enhances the confidence in the accuracy of valve area quantification because multiple plane cropping ensures that the orifice area is traced in a plane that is (1) at the tips of the mitral valve and (2) perpendicular to the inflow through the valve. The progression shown in Figure 6-3 demonstrates the sequential plan for procurement of an accurate mitral valve area using planimetry of an RT3DE dataset. Note that such a dataset could be obtained using either RT3DTTE or RT3D transesophageal echocardiography (RT3DTEE).
Related posts:
 Integration of Three-Dimensional Echocardiography in Routine Clinical Practice
 Three-Dimensional Transesophageal Echocardiography Systems
 Evaluation of the Aortic Valve
 Guidance of Catheter-Based Cardiac Interventions
 Historical Perspective on Three-Dimensional Echocardiography
 Evaluation of Intracardiac Masses
Stay updated, free articles. Join our Telegram channel

Full access? Get Clinical Tree


