(11.1)

(11.2)

(11.3)
Or alternatively, if only one hit is tolerable for all the targets for inactivation, it is called the “one-hit multi-target model,” and the corresponding survival curve is:

Some more derivative models such as “multi-hit one-target model,” i.e., a model when only one target exists in a cell nucleus, but a few hits are required to inactivate it, or a combination of “one-hit one-target model” and “one-hit multi-target model” as the “two-component model” are also proposed. The latter survival curve is rather complex:

The first component is called as the “ion kill” as less repairable mode, and the second one is as “gamma kill” as partially repairable mode.
(11.4)
(11.5)
These various target models are, however, not frequently used in the field of modern radiotherapy. The reason would be attributed to the rather complex equation in practical viewpoint and also difficult interpretation of the number of targets dependent on cell lines in mechanistic viewpoint.
11.1.2 Linear-Quadratic Model
Among possible radiation effect on cell nucleus, it was found that a DNA double-strand break (DSB) could be the most severe damage to be strongly related to the fate of the cell. Other types to be of DNA damages such as single-strand break or chemical change are considered leading to neither chromosomal aberration nor cell death at all.
The homologous nature of DSB evokes another model based on microscopic energy distributions. Probability of DSB originating from single radiation trajectory is linearly proportional to the fluence of the radiation, i.e., absorbed dose. Alternatively, even though single radiation breaks one strand of DNA but does not the other, the additional second radiation can break the remaining strand and leading to inactivation. The probability of this composite event obeys to the square of the fluence, i.e., to square of the absorbed dose. As both pathways lead to DSBs and cell inactivation, the overall radiation effect on a cell population can be expressed as the survival probability
![$$ S(D)= \exp \left[-\left(\alpha D+\beta {D}^2\right)\right] $$](http://radiologykey.com/wp-content/uploads/2017/06/A328252_1_En_11_Chapter_Equ6.gif)
with two coefficients α and β for linear and quadratic term, respectively. According to this model, the survival curves indicate shouldered line as a function of dose. This model is called as “linear-quadratic (LQ) model” or sometimes “αβ model.”
(11.6)
Mainly due to its simplicity but adequate reproducibility of biological response in the therapeutic dose range compared with the other classical model, LQ model is still de-facto standard model used for analysis of experimental data or therapeutic estimation.
11.1.3 Model for Therapeutic Application
A biological model should be capable of predicting the biological response of the radiation with some extent of simplicity and robustness to be applicable in routine radiotherapy. True mechanistic approaches can be considered to build a model, which are able to represent the relevant fundamental processes, starting with the details of physical interactions followed by the formation of damages such as DSBs and possible biological response such as repair or apoptosis. At this moment, just a few pathways have been understood quantitatively; therefore, the steps should be very much simplified with vast number of parameters. The solution is strongly affected by small variations of the parameters. In the sense, at least at present, it is still not yet realized to simulate the complete network with a precision sufficient for clinical use. In other words, any model based on first principle has not yet been realized nor utilized, i.e., current models used in radiotherapy must involve adequate assumption, simplification, or approximation therein.
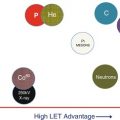
As a crucial issue specific to ion beam radiotherapy, the absorbed dose alone is not sufficient to handle the biological effectiveness. RBE, relative biological effectiveness of the ion beam comparing to X-ray, increases toward the end of its range. This change in RBE enhances the peak-plateau ratio of the Bragg curve in the biological viewpoint, therefore considered advantageous for sparing surrounding normal tissues around while delivering sufficient dose to deep-seated tumor. At the same time, this change in RBE requires biological models to be used in ion beam therapy to handle the change quantitatively; otherwise, it will result in poor tumor control and/or severe normal tissue complication.
11.2 NIRS C-Ion RT Model (Version 1)
11.2.1 Concept of NIRS Model
The first NIRS model developed by Kanai et al. [6] is a kind of straightforward pragmatic extension of the LQ model to handle the RBE issue for carbon-ion radiotherapy.
In the approach, two biological subjects were taken into consideration: biological dose distribution within a spread-out Bragg peak (SOBP) for designing the depth-dose distribution and clinical RBE for determining the dose to be prescribed. Biological dose was introduced to unite absorbed dose with biological effectiveness which can be examined by experiment. Absorbed dose is designed so that the biological dose becomes flat within an SOBP. Here, as mentioned previously, RBE is dependent on the irradiation depth of the carbon-ion beam. More precisely, RBE is known to depend on various factors such as biological materials, endpoints, radiation quality, absorbed dose, and so on. NIRS selected a human salivary gland tumor (HSG) cell line because the initial patients to receive carbon-ion radiotherapy were forecasted as those with salivary gland tumors, which are known to respond well to fast-neutron therapy in the past. The 10 % surviving fraction of the HSG cells was then chosen as the endpoint to measure RBE of carbon ions for single fractional dose.
Then, in order to make use of the experience of fast-neutron therapy in the past to determine clinical RBE of carbon-ion therapy, a “neutron-equivalent point” of carbon-ion beam was exploited. The clinical RBE of neutrons is reported to be 3.0 for 18 fractions in 6 weeks. On the other hand, biological RBE values of neutrons are experimentally obtainable and can be compared with RBE values of carbon ions for HSG-cultured cells after irradiation with 290 MeV/u carbon-ion beams with a 6-cm SOBP (Fig. 11.1). RBE of carbon ions relative to 200 kVp X-rays increased with an increase of dose-averaged LET of carbon ions, and was 2.05 at 85 keV/μm. This RBE was identical to neutron’s RBE for the same endpoint.

Fig. 11.1
Comparison of RBE of HSG cells at 10 % survival level for carbon ions as a function of LET with that for fast neutrons (redrawn from [6])
Another biological endpoint, mouse skin reaction after fractionated irradiation with 290 MeV/u carbon-ion beams with a 6-cm SOBP was also studied. On the endpoint of skin reaction score of 2.5, dry desquamation, RBE of 3.1 which was identical to fast neutrons, was pointed at an LET of 75 keV/μm. This value of RBE is close to that used in the fast neutron therapy. As two LET values thus obtained in vitro and in vivo were close to each other, namely, 75 and 85 keV/μm, the point where the dose-averaged LET is 80 keV/μm of 290 MeV/u carbon-ion beams with a 6-cm SOBP was determined as the “neutron-equivalent point.” This point corresponds to 8-mm upstream of the falloff of the SOBP. At this very point, clinical RBE of the carbon-ion beam is assumed to be 3.0. As the biological dose distribution is designed to be flat within the SOBP, once RBE was clipped at one position, clinical dose distribution is also flat within the SOBP.
11.2.2 Design of Clinical Dose Distribution
In order to design the SOBP, the coefficients (α and β) in the LQ model of the survival curve for HSG cells were experimentally derived and tabulated as a function of the energy the carbon-ion beam. Then, the absorbed dose distribution was designed to achieve a uniform survival probability (10 %) for the HSG cells over the entire SOBP region. The contribution of different energy is treated by taking the dose-averaged coefficients (α mix and β mix) in case of mixed-radiation field, as given below:


The biological responses for the SOBP beam designed by this approach was validated for various biological samples, such as HSG cells, MG 63 human osteosarcoma cells, V79 Chinese hamster cells, and crypt cells of mouse jejunum and confirmed to be uniform throughout the SOBP region. In this framework, it is regarded that the clinical dose distributions calculated with the model primarily reflect the response of acute reactions.
(11.7)
(11.8)
The relationship between biological and absorbed dose distributions, estimated from the responses of the HSG cells, was assumed to hold even in the clinical situation. Then the clinical dose distribution was deduced by multiplying the entire biological SOBP with a constant factor, this factor being the ratio between the clinical and biological RBE value at the point where the dose-averaged LET was 80 keV/μm. The scheme described above is summarized below:
1.
The dose level of the flattop of the biological dose distributions, which corresponds to the prescribed clinical dose to the target, is first given by a radiation oncologist.
2.
The physical dose at the neutron-equivalent position is determined using the RBE value of 3.0.
3.
The physical dose distribution of the SOBP beam is then normalized at the neutron-equivalent position.
4.
The physical dose at the center of the SOBP is obtained and the RBE values at the center of the SOBPs are then obtained by dividing the biological dose by the physical dose.
Figure 11.2 shows schematically the method of determining the RBE at the center of the SOBP for clinical situations. In case a clinical dose of 2.7 Gy (RBE) would be prescribed to the tumor, the corresponding absorbed dose at the 8-mm upstream position is 2.7 Gy (RBE)/3.0 (RBE) = 0.9 Gy. At the middle of SOBP, absorbed dose and clinical RBE are 1.13 Gy and 2.7/1.13 = 2.4, respectively.

Fig. 11.2
Depth-dose distribution of NIRS model for 290 MeV/u of carbon beam of 60-mm SOBP width (redrawn from [6])
Strictly, this approach is valid only for a single field irradiation delivered on 1 day. However, it is assumed that each single field distribution could be added in the case of multi-port irradiation in 1 day. This scheme was used at NIRS broad-beam irradiations with universal depth-dose distributions to all patients, independent of tumor type or dose level. The tumor-specific radiosensitivity was examined with this fixed distribution through dose escalation and hypofractionation clinical trials.
11.2.3 Verification of the NIRS Model
In order to examine the appropriateness of the first NIRS model, the expected clinical RBE was compared with clinical outcome [12]. Miyamoto et al. [13] analyzed the clinical results of non-small cell lung cancer (NSCLC) treated by HIMAC beams. They depicted a very conspicuous dose dependency of the local control rate. A dose escalation study was performed with a treatment schedule of 18 fractions in 6 weeks. Dose dependency of tumor control probability (TCP) with the photon beam was fitted by the following formula:
![$$ \begin{array}{l}\mathrm{T}\mathrm{C}\mathrm{P}={{\displaystyle \sum}}_i\frac{1}{\sqrt{2\pi}\sigma}\left[-\frac{{\left({\alpha}_i-\alpha \right)}^2}{2{\sigma}^2}\right] \exp \hfill \\ {}\left\{-N \exp \left[-n\left({\alpha}_id+\beta {d}^2\right)+\frac{0.693\left(T-{T}_{\mathrm{k}}\right)}{T_{\mathrm{p}}}\right]\right\}\hfill \end{array} $$](http://radiologykey.com/wp-content/uploads/2017/06/A328252_1_En_11_Chapter_Equ9.gif)