Fig. 1.
Schematic diagram of autophagosome formation in mammalian cells. A protein complex, which includes Atg5, Atg12, and Atg16L, associates with the membranes of small membrane sacs, recruits LC3-II to the membrane, and initiates membrane elongation. The membranes grow into the isolation membrane and eventually mature into autophagosomes in approximately 10 min. The Atg5 complex dissociates from the membrane just before or right after membrane fusion yielding the autophagosome, while LC3 remains associated with the autophagosome membrane. Fusion of lysosomes with autophagosomes results in the formation of autolysosomes. Concomitantly, LC3-II sheds form the outer membrane whereas LC3-II and the inner membrane become digested.
1.2 Strategy to Analyze Autophagy
LC3 is the mammalian homologue of yeast Atg8 and the most widely used marker for autophagy. When autophagy is induced, LC3-I forms, which is dispersed in the cytoplasm. Then, LC3-II results from conjugation with phosphatidylethanolamine (PE), which translocates to the isolation membrane and autophagosome membrane (3, 4). Few LC3-positive puncta are found under nutrient-rich conditions, while such puncta increase during starvation following nutrient depletion. Thus, counting the number of LC3 puncta is the first step in assessing autophagy. LC3 puncta can be visualized by immunostaining with anti-LC3 antibody or using a GFP-tagged LC3 (see Subheadings 3.3, 3.4, and 3.5).
If the number of LC3 puncta decreases during autophagy induction, then this potential defect in autophagosome formation could be examined by observing Atg5, Atg12, or Atg16L puncta (see Fig. 2). These Atgs are markers of the isolation membrane (3, 5). Upon nutrient starvation, Atg5 is conjugated to Atg12 and translocated from the cytosol to the isolation membrane. The Atg5-12 conjugate immediately dissociates from membranes after autophagosome formation is complete. Atg5 also interacts non-covalently with Atg16L. Atg16L localizes to the isolation membrane together with the Atg5-12 conjugate during autophagosome formation. The significance of the Atg5-12 and Atg16L complex in autophagosome formation has been shown in studies using knockout cell lines of Atg5 or Atg16L. Therefore, these proteins are reliable isolation membrane markers and can be visualized by immunostaining or expressing GFP-tagged proteins (see Subheadings 3.3, 3.4, and 3.5).
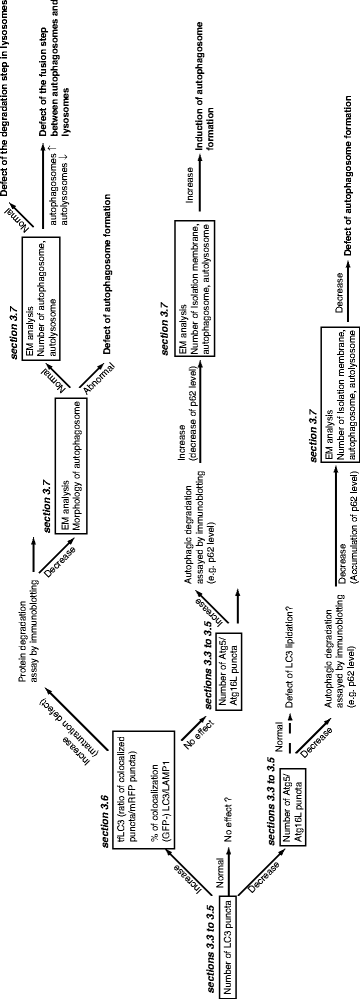
Fig. 2.
Strategy of autophagy analysis by microscopy. To examine the effects of various conditions on autophagy, LC3 puncta or isolation membrane marker proteins can be visualized by immunofluorescence. The methods used to observe LC3 and isolation membrane markers are described in Subheadings 3.3, 3.4, 3.5. The effects of autophagosome maturation can be addressed as discussed in Subheading 3.6. EM is a powerful tool to examine autophagy. Conventional transmission EM (TEM), electron tomography, and immuno-EM techniques are described in Subheading 3.7.
An increased number of LC3 puncta raises two possibilities; one is enhanced autophagy, and the other is disrupted autophagosome maturation or degradation. To examine the latter possibility, one can monitor tandem fluorescent-tagged LC3 (tfLC3) or the colocalization of GFP-LC3 with LAMP1, a lysosomal membrane marker (see Subheading 3.6). Enhanced autophagosome formation can be confirmed by visualizing the isolation membrane with Atg5, Atg12, or Atg16L (see Subheadings 3.3, 3.4 and 3.5). If autophagosome maturation is disrupted, there are three possibilities that can be addressed. First, autophagosome formation may be incomplete. With this possibility, it is likely that incomplete autophagosomes accumulate in cells and are visible by electron microscopy (see Subheading 3.7). The remaining possibilities are a defect in autophagosome–lysosome fusion, and/or lysosomal dysfunction. Electron microscopy is a valuable tool to distinguish these possibilities by examining whether autolysosomes (lysosomes containing autophagic substrates) can be observed in cells (see Subheading 3.7).
1.3 Electron Microscopy
Electron microscopy (EM) is indispensable to study autophagy and its mechanism. Conventional transmission EM (TEM) provides excellent morphological details such as the number of isolation membranes, autophagosomes, or autolysosomes independent of other methods. In addition, electron tomography and immuno-EM have greatly impacted studies on autophagy. Electron tomography is a powerful tool to obtain 3D information on intracellular membrane structures at a high resolution (6, 7). Immuno-EM can combine molecular and ultrastructural studies by detecting protein localization at the nanometer level. For instance, LC3 immuno-EM can clearly discriminate autophagic membranes from other membranes such as endosomes. Here, we describe electron tomography in addition to conventional EM methods. We also briefly introduce immuno-EM using pre-embedding nanogold gold labeling followed by silver intensification. The details of the pre-embedding immuno-EM using nanogold gold and silver intensification method are described elsewhere and will not be covered in this review (8).
2 Materials and Reagents
2.1 Cells
Mammalian cells (e.g., HeLa, A549, MCF7, mouse embryonic fibroblasts (MEFs), and NIH3T3) are maintained in growth medium under 5% CO2 at 37°C.
Negative controls: Atg5 knockout MEFs, Atg7 knockout MEFs, Atg3 knockout MEFs, Atg16L knockout MEFs.
2.2 Cell Culture
1.
Growth medium: Dulbecco’s modified Eagle’s medium (DMEM; D6546, Sigma, St Louis, MO) containing 10% fetal bovine serum supplemented with 4 mM l-glutamine.
2.
Starvation medium: Earle’s balanced salt solution (EBSS; E2888, Sigma, St Louis, MO).
3.
Coverslips: Coverslips (Matsunami glass; 12-mm diameter round, NO. 1 S thickness) are sterilized using a dry-heat sterilizer. If necessary, collagen-coated coverslips are prepared by immersing in 0.1 mg/mL collagen (Nitta gelatin, Cell matrix Type I-C) for 2 h at room temperature (RT) followed by rinses with phosphate-buffered saline (PBS). For electron microscopy, we recommend Cell desk LF1 low autofluorescence 13.5-mm diameter plastic coverslips (Sumitomo Bakelite, Tokyo, Japan) (see Note 1).
2.3 Autophagy Inhibitors
1.
Wortmannin: Stock solution of 100 μM wortmannin is prepared in dimethyl sulfoxide (DMSO). A working solution is prepared by diluting the stock solution 1:1,000 in growth or starvation medium (see Note 2).
2.
E64d and pepstatin A: E64d (4321-v, Peptide Institute, Inc.) and pepstatin A (4397-v, Peptide Institute, Inc.) are prepared as 50 μg/μL or 25 μg/μL stock solutions, respectively, in DMSO. Both inhibitors are added to the growth or starvation medium at a final concentration of 50 ng/μL (see Note 3).
3.
Bafilomycin A1: Bafilomycin A1 is added to the growth or starvation medium at a final concentration of 100 nM (see Note 4).
2.4 Transfection
Cells were transiently transfected using Lipofectamine 2000 Reagent (Invitrogen, Eugene, OR) according to the manufacturer’s protocol.
2.5 Antibody Sources
LC3 antibody: rabbit polyclonal LC3 antibody (PM036, MBL, Naka-ku, Nagoya).
Atg12 antibody: rabbit polyclonal Atg12 antibody (#2011S, Cell Signaling) (see Note 5).
LAMP1 antibody: mouse monoclonal LAMP-1 antibody (H4A3, Santa Cruz).
2.6 Immunofluorescent Microscopy
1.
10× PBS (pH 7.2) (for 1 L): Add 14.4 g of sodium dihydrogenphosphate dihydrate (Na2HPO4), 2.4 g of potassium dihydrogenphosphate (KH2PO4), 2 g of potassium chloride (KCl), and 80 g of sodium chloride (NaCl) to distilled water (dH2O). Bring the volume to 1 L, and then adjust the pH to 7.2. For 1× PBS, dilute the 10× PBS 1:10 with distilled water. Both solutions are stable at RT.
2.
10% (w/v) Paraformaldehyde solution (PFA): Add ∼45 mL of Milli-Q water to 5 g of paraformaldehyde powder (Nacalai Tesque, Kyoto, Japan) and heat to 60°C. Add a few drops of 1.0 N NaOH under stirring in a draft chamber until the solution clears. Adjust the volume of the solution to 50 mL with Milli-Q water. This solution should be used within 24 h (see Note 6).
3.
4% (w/v) Paraformaldehyde solution: Mix 4.0 mL of 10% paraformaldehyde solution with 3.3 mL of PBS (3×) and 2.7 mL of Milli-Q water. This solution should be used within 24 h.
4.
50 mM NH4Cl in PBS: Add 0.27 g of ammonium chloride to 100 mL 1× PBS.
5.
Digitonin stock solution: 50 mg/mL digitonin is dissolved in DMSO and stored at −20°C. For use, dilute the stock solution 1:000 with PBS.
6.
Gelatin/PBS solution: Dissolve 0.1% (w/v) gelatin in PBS and autoclave.
7.
SlowFade Gold antifade reagent: SlowFade Gold antifade reagent (S36936) is purchased from Invitrogen (Eugene, OR).
2.7 Electron Microscopy
2.7.1 Conventional TEM
1.
0.1 M Sodium phosphate buffer, pH 7.4 (PB): prepare 1.0 L of 3× (0.3 M) stock solution with 8.9 g of NaH2PO4·2H2O and 87.0 g of Na2HPO4·12H2O. Autoclave the solution and store at RT. Prepare a working PB solution by diluting one part of the stock solution with two parts Milli-Q water and adjust the pH if necessary with NaOH.
2.
2.5% (w/v) Glutaraldehyde solution: Dilute one part of 25% aqueous glutaraldehyde solution (EM grade) (Electron Microscopy Sciences, Hatfield, PA) with nine parts of 0.1 M PB (see Note 6).
3.
OsO4 (TAAB Laboratories Equipment, Berks, UK): the 2% aqueous stock solution should be stored separately from other reagents (see Note 6).
4.
OsO4-potassium ferrocyanide solution: Dissolve ferrocyanide powder to a final concentration of 1% (w/v) in 1% (w/v) OsO4 in PB immediately before use.
5.
Graded series of ethanol solutions: 30%, 50%, 70%, 90%, and 100% (v/v) ethanol.
6.
Epoxy resin mixture (TAAB Laboratories Equipment, Berks, UK): Mix 24.5 mL of epon 812, 15.0 mL of dodecenyl succinic anhydride (DDSA), 13.5 mL of methyl nadic anhydride (MNA), and 0.75 mL of 2,4,6- tri (dimethylaminomethyl) phenol (DNP-30) (see Note 7).
7.
Silicon rubber flat embedding mould (Dosaka EM Co., Kyoto, Japan).
8.
Bioden mesh cement (0.25% neoprene solution in toluene, Ohkenshoji Co., LTD., Tokyo, Japan).
9.
Veco specimen grid (200 mesh, copper) (Electron Microscopy Sciences Hatfield, PA). The EM grids are coated with Bioden mesh cement by placing the grids on filter paper (Whatman Grade No.2) and dropping the mesh cement onto the grids.
10.
2% (w/v) Aqueous uranyl acetate solution.
11.
Lead citrate solution (Sigma, St Louis, MO).
12.
Diamond Knife (Ultra 45, Diatome AG, Biel, Switzerland).
13.
Ultramicrotome (Ultracut N, Reichert-Jung Optische Werke, Vienna, Austria).
14.
Transmission electron microscope.
2.7.2 Electron Tomography
1.
Formvar solution: Dissolve 1 g of polyvinylformal (Tokyo Kasei Kogyo Co., Tokyo, Japan) in 1,2-dichloroethane (Wako Pure Chem., Osaka, Japan) and bring the volume to 100 mL. Store the solution in a desiccator.
2.
Copper 2 × 1 mm slot grids or reference pattern grids (100 mesh) (Electron Microscopy Sciences, Hatfield, PA) (see Note 8).
3.
Filter paper, qualitative, grade 2 (Whatman, Maidstone, UK).
4.
Glass Coplin staining jar (Electron Microscopy Sciences, Hatfield, PA).
5.
10 nm or 15 nm Colloidal gold (BBInternational, Cardiff, UK).
2.7.3 Immuno-EM Using Pre-embedding Nanogold Intensification
1.
Saponin (Nacalai Tesque, Kyoto, Japan).
2.
Bovine serum albumin (BSA, Sigma-Aldrich, St Louis, MO).
3.
Normal goat serum (Vector Laboratories, Burlingame, CA).
4.
Cold water fish skin gelatin (Sigma-Aldrich, St Louis, MO).
5.
Permeabilization/blocking solution: PB containing 0.1% (w/v) saponin, 10% (w/v) BSA, 10% (v/v) normal goat serum, and 0.1% (w/v) cold water fish skin gelatin.
6.
Primary antibody raised against the protein of interest.
7.
Nanogold Fab′ conjugates (Nanoprobes, Yaphank, NY): IgG Fab′ fragment from goat anti-mouse IgG, anti-rabbit IgG, or anti-rat IgG complexed to 1.4 nm colloidal gold particles.
8.
PBS containing 50 mM glycine.
9.
PBS containing 1% (w/v) BSA.
10.
GoldEnhance EM kit (Nanoprobes, Yaphank, NY).
11.
1% (w/v) Aqueous sodium thiosulfate solution. Prepare this solution immediately before use.
3 Methods
3.1 Cell Culture
The day before the experiment, plate cells on coverslips in 6-well dishes containing growth medium and incubate at 37°C in a CO2 incubator for 18–24 h.
3.2 Autophagy Induction
1.
Remove the culture medium and wash twice with PBS pre-warmed at 37°C.
2.
For amino acid and serum starvation, cells are incubated in EBSS. For nutrient-rich conditions, culture cells in growth medium. These cells are incubated for 1–4 h depending on the cell line (e.g., 1 h for MEFs and 4 h for A549 cells). Add inhibitors to the culture medium as required.
3.3 Immunofluorescence
1.
 Histochemical Detection of Lipid Droplets in Cultured Cells
Environmental Scanning Electron Microscopy Gold Immunolabeling in Cell Biology
Histochemical Detection of Lipid Droplets in Cultured Cells
Environmental Scanning Electron Microscopy Gold Immunolabeling in Cell Biology
 Colocalization Analysis in Fluorescence Microscopy
 Atomic Force Microscopy Functional Imaging on Vascular Endothelial Cells
 A Novel Combined Imaging/Morphometrical Method for the Analysis of Human Sural Nerve Biopsies for Clinical Diagnosis
 Environmental Scanning Electron Microscopy in Cell Biology


Related posts:
Histochemical Detection of Lipid Droplets in Cultured Cells
Environmental Scanning Electron Microscopy Gold Immunolabeling in Cell Biology
Colocalization Analysis in Fluorescence Microscopy
Atomic Force Microscopy Functional Imaging on Vascular Endothelial Cells
Environmental Scanning Electron Microscopy in Cell Biology
Stay updated, free articles. Join our Telegram channel
Full access? Get Clinical Tree
