Pediatric musculoskeletal tumors comprise approximately 10% of childhood neoplasms, and MR imaging has been used as the imaging evaluation standard for these tumors. The role of MR imaging in these cases includes identification of tumor origin, tissue characterization, and definition of tumor extent and relationship to adjacent structures as well as therapeutic response in posttreatment surveillance. Technical advances have enabled quantitative evaluation of biochemical changes in tumors. This article reviews recent updates to MR imaging of pediatric musculoskeletal tumors, focusing on advanced MR imaging techniques and providing information on the relevant physics of these techniques, clinical applications, and pitfalls.
Key points
- •
Diffusion-weighted imaging reflects the tissue cellularity of musculoskeletal tumors, and a low apparent diffusion coefficient value (<1.1) is seen in more cellular and more aggressive tumors, but does not reliably differentiate malignant from benign tumors.
- •
Pharmacokinetic value changes in dynamic contrast-enhanced MR imaging after treatment that reflects decreased vessel permeability (K trans , K ep ) and tumor blood volume (V e and V p ) reflect and correlate with therapeutic response.
- •
High choline peaks and high choline/creatinine ratios are observed in malignant tumors, but are often not specific.
- •
Whole-body MR imaging increases sensitivity in the detection of musculoskeletal metastasis in oncology patients and is recommended in neurofibromatosis type 1 and hereditary cancer predisposition syndromes.
- •
High-intensity focused ultrasound applies targeted acoustic energy to induce tumor necrosis under real-time monitoring with MR thermal imaging using proton resonance frequency shift.
Introduction
MR imaging is the imaging evaluation standard for musculoskeletal tumors in children. The role of MR imaging in musculoskeletal tumors includes identification of tumor origin, tissue characterization, and definition of tumor extent and relationship to adjacent structures as well as therapeutic response in posttreatment surveillance. Conventional MR imaging using T1-weighted images (T1WI) and water-sensitive sequences (T2WI with fat suppression or inversion recovery techniques) has been highly useful in tissue characterization.
Recently, technical advances in MR imaging using quantitative MR techniques have enabled probing of the biochemical information of tumor cells based on tumor cellularity, hemodynamic changes, and altered metabolism. These technical advances were made in diffusion-weighted (DW) imaging, including intravoxel incoherent motion (IVIM), diffusion tensor (DT) imaging, dynamic contrast-enhanced (DCE) MR imaging, noncontrast perfusion MR imaging, such as blood oxygen level dependent (BOLD) and arterial spin labeling (ASL), and proton MR spectroscopy (MRS). Whole-body MR imaging (WB-MR imaging), including DW imaging, is a powerful tool that has enabled scanning of almost the entire body in a short time and has been used for screening in high-risk patients.
In oncology patients, WB-MR imaging has enabled assessment of whole-body tumor burden and extent, which is critical information in therapeutic decision making and monitoring. Combining PET with fluorodeoxyglucose F 18 ( 18 F FDG) with WB-MR imaging for pediatric cancer staging is currently feasible, and it is discussed separately in Neha S. Kwatra and colleagues’ article, “ PET/MRI: Current Updates on Pediatric Applications ”, in this issue of Magnetic Resonance Imaging Clinics of North America . The application of advanced MR techniques has been extended to therapeutic trials. Most recently, MR-guided high-intensity focused ultrasound (MR-HIFU) has been applied in pediatric patients.
In this article, the recent updates to MR imaging and its application in pediatric musculoskeletal tumors are reviewed. The focus is on advanced MR imaging techniques that can be used currently in pediatric patients. These techniques offer the potential to aid in characterization of various musculoskeletal tumors and tumor-mimics, thereby complementing or supplementing the information gleaned from conventional MR imaging sequences. Further discussion includes the relevant physics of these novel techniques, their current role in imaging characterization of tumors, and relevant pitfalls in the pediatric patients.
Pediatric musculoskeletal tumors
Childhood sarcomas, including rhabdomyosarcoma (RMS) and other soft tissue sarcomas, Ewing sarcoma (EWS), and osteosarcoma, comprise approximately 10% of childhood malignancies. Pediatric sarcomas are generally treated with a multimodal therapeutic approach that includes some combination of systemic chemotherapy, surgical resection, and/or radiotherapy. Survival for localized pediatric sarcomas improved dramatically after the introduction of dose-intensive multiagent chemotherapy regimens, but then generally plateaued in the 1980s and 1990s. Prognostic factors for childhood sarcoma include not only clinical parameters but also imaging parameters of tumor volume and number of lung metastases. Unfortunately, the survival for patients with recurrent and metastatic sarcomas remains dismal, indicating a desperate need for innovative therapies.
Recent Advances in Sarcoma Therapy
Although survival of pediatric sarcomas generally trails that of many other common pediatric cancers, several key therapeutic advances have been achieved in recent years. The Children’s Oncology Group (COG) demonstrated success using a combination of vincristine, actinomycin, and cyclophosphamide (VAC) in the treatment of patients with RMS; use of this therapeutic combination led to less hematologic side effects while maintaining the same therapeutic efficacy. As a result of this trial, VAC alternating with vincristine and irinotecan (VI) was considered a reasonable standard of care for intermediate-risk RMS patients. In relapsed RMS, the COG demonstrated benefit from mammalian target of rapamycin (mTOR) inhibition, and the combination of mTOR inhibitors with VAC/VI is currently under clinical trial for intermediate-risk RMS ( NCT02567435 ).
For the treatment of EWS patients, the COG demonstrated that interval compression therapy, combined with chemotherapy courses given every 2 weeks rather than every 3 weeks, improved event-free survival in localized EWS patients. In a randomized trial, the COG also demonstrated that the addition of liposomal muramyl tripeptide-phosphatidyl ethanolamine (or mifamurtide) to standard osteosarcoma chemotherapy agents led to statistically significant superior overall survival. Finally, benign but aggressive fibromatosis or desmoid tumors, which often recur after surgical resection and unpredictably respond to established medical therapies, have recently been demonstrated to respond to gamma secretase inhibitors and receptor tyrosine kinase inhibitors, expanding the therapeutic options available for affected pediatric patients. HIFU has also demonstrated initial evidence of efficacy in desmoid tumors and osteoid osteomas. Moving forward, other areas of interest in sarcoma therapy include the study of poly(ADP-ribose) polymerase inhibitors for EWS, immunotherapy for synovial sarcoma, and RANK ligand inhibitors in osteosarcoma.
Sarcoma Biology
Further insight into the biology underlying various sarcomas is ultimately necessary to develop innovative therapeutic approaches. Genomic tumor analysis has recently shed light on the scope of genetic alterations across the pediatric sarcoma landscape with implications for guiding the development of novel targeted therapies. In general, translocation-associated sarcomas, such as EWS and alveolar RMS, demonstrate a relatively low mutational burden that may limit opportunities for the use of molecularly guided therapies in such tumors. On the other hand, osteosarcomas, which do not carry recurrent translocations, demonstrate chaotic genomes characterized by considerably more complexity. A potential explanation for this finding is that at least some osteosarcoma tumors may undergo chromothripsis, a catastrophic genomic event leading to massive genomic rearrangements.
Ultimately, as the understanding of sarcoma biology expands and therapy evolves, further demands fall upon the field of radiology to improve and optimize the diagnosis, staging, documentation of therapy response, and monitoring for relapse of these tumors.
Role of conventional MR imaging techniques
MR imaging is a primary imaging modality in pediatric musculoskeletal tumors. In pediatric bone and soft tissue tumors, MR imaging starts with large field-of-view studies to include joint to joint using short-tau inversion recovery (STIR) and T1WI sequences and provides information for local staging of the primary tumor (T) and nodal staging (N). According to the American Joint Committee on Cancer staging system, malignant bone tumors are defined as T1 (tumor size ≤8 cm), T2 (tumor size >8 cm), or T3 (discontinuous tumor in the primary bone site known as skip metastases). Local staging of malignant soft tissue tumors is also defined based on size: T1 (tumor size ≤5 cm) or T2 (tumor size >5 cm), with subdivision into superficial (superficial to fascia) or deep (beneath the fascia or superficial to the fascia with fascial invasion). The joint-to-joint images are important in detection of skip metastases. Skip metastases are tumors within the bone marrow of the affected bone, but separated from the primary lesion by normal fatty marrow ( Fig. 1 ). Patients with skip metastases have an increased risk of local recurrence and subsequent metastases after surgery.

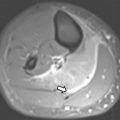
After a large field-of-view study, imaging is focused on the lesion, and field of view is optimized for tumor size using T1WI, water-sensitive sequences, and at least 2 planes of contrast-enhanced T1WI with fat suppression (CE-MR imaging). Most bone tumors have low T1 and high T2 signal changes on fluid-sensitive MR images. T1WI provide excellent contrast between tumors and normal marrow. The presence of a peritumoral fat plane, best seen on T1WI, indicates that the tumor is separable from the adjacent neurovascular bundle and is important for the preoperative plan ( Fig. 2 ). The fluid-sensitive sequences are useful for lesion detection, tissue characterization, and defining tumor extent (see Fig. 2 ). In a small subset of tumors, T1WI and water-sensitive sequences enable tissue characterization; these include cysts with fluid signal (low T1 and high T2 signal), fatty lesions (high T1 and high T2 signal), and fibrous tumors (low T1 and low T2 signal).

Gradient echo sequence is not routinely performed in most tumor imaging, but if applied, it can provide additional information regarding calcifications and hemorrhage by demonstrating “blooming artifact.” Calcifications are characteristic in certain tumors, such as myositis ossificans, chondroid or osteoid matrix forming tumors, and hemangiomas or vascular malformations with phleboliths. Hemosiderin deposition is also seen as a blooming artifact on gradient echo and is observed in tumors with recurrent hemorrhage, such as pigmented villonodular synovitis, giant cell tumor of tendon sheath ( Fig. 3 ), or vascular malformation. Chemical shift MR imaging, both in phase and opposed phase, is a fast imaging technique that can be used to identify a marrow replacing tumor and distinguish it from bone marrow edema or hematopoietic marrow.

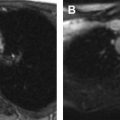
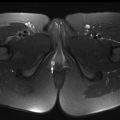
CE-MR imaging differentiates hyperintense solid from fluid-containing lesions, because high T2 signal can be seen in both cystic and solid components. The presence of homogeneous enhancement suggests a solid component mass, which often warrants tissue sampling for definitive diagnosis ( Fig. 4 ). CE-MR imaging also differentiates the tumor itself from peritumoral edema. Peritumoral edema and enhancement are observed in high-grade sarcomas and indicate high-grade over low-grade sarcoma. Therefore, CE-MR imaging is reserved for any lesions raising suspicion for malignancy and can be obtained with high spatial resolution using isotropic volumetric sequences.

Despite the application of different MR sequences and intravenous contrast, differentiation between benign and malignant soft tissue tumors is often challenging, and ultimately, tissue sampling is inevitable. Particularly in soft tissue sarcomas, MR signal intensities and enhancement patterns reflect variable tissue components and characterization, but are often unreliable in differentiating between benign and malignant soft tissue tumors.
The main role of MR imaging in the initial diagnosis or pretreatment plan is to provide preoperative information regarding tumor extension and primary tumor staging. Therefore, the following information should be included in the report: tumor margins and size; tumor extension beyond the anatomic compartment; tumor invasion of bone, epiphysis, joint, muscle, and neurovascular bundle; and tumor location relative to deep fascia.
Neurovascular encasement is important for the surgical plan and is defined when the tumor contact with the neurovascular bundle exceeds 180° in circumference. Lymph node metastasis is an essential part of staging, particularly for RMS, clear cell sarcoma, and epithelioid sarcoma, which have a higher tendency for lymph node spread than other sarcomas. Presence of nodal metastasis is associated with a higher rate of tumor relapse and mortality. Lymph node enlargement more than 1 cm in the short axis is highly suggestive of nodal invasion of tumor. However, nodal invasion is also observed in subcentimeter-sized lymph nodes. In patients with posttreatment follow-up, identification of local recurrence is the main role of MR imaging. MR findings of hypo-/iso-T1 and high T2 signal with enhancement at the surgical bed are highly sensitive for local recurrence (up to 100%), but are not specific and are often seen in postsurgical scars as well.
There are unique challenges for pediatric MR imaging. The need for sedation in infants and young children requires a comprehensive protocol with an effective time limit. In a recent study, Dixon T2-weighted fat-only and water-only imaging provided, in one sequence, diagnostic performance similar to that of the standard combination of morphologic sequences for the detection of probable spinal bone metastases, thereby providing an opportunity to reduce imaging time by eliminating the need to perform T1 sequences ; these efforts are especially relevant in pediatric imaging. In small-sized children, choosing a coil that closely matches the field of view is important to extract the maximum signal from these cases.
Although rarely reported, gadolinium use can be associated with a serious and potentially fatal allergic reaction, and with nephrogenic systemic fibrosis. A higher molecular stability contrast agent is required in children than in adults, given their longer lifetime exposure to the potential risk of delayed adverse events and the potentially multiple examinations with large cumulative doses of contrast agents. Special consideration is needed in neonates and infants up to 1 year of age when using gadolinium-based contrast agents.
Advanced MR imaging techniques and clinical applications
Diffusion-Weighted Imaging
DW imaging exploits the degree of water diffusion (Brownian motion) around the cells, represented by a quantitative variable, the apparent diffusion coefficient (ADC) value (×10 −3 mm 2 /s). As opposed to the free environment, water diffusion is restricted in tissues because of several barriers, including cell membranes, organelles, other proteins, and so forth. Thus, restricted diffusion is observed in highly organized, fibrotic, fatty, proteinaceous, cellular tissues or tumors, whereas increased diffusion or relatively less restriction is seen in less cellular, necrotic tissues or treated tumors.
Technical considerations
DW imaging is generated using 2 monopolar diffusion gradients, which operate at a tissue-cellular level. The subtraction image of these gradients is the DW image. In the setting of high diffusion, the spins are extremely mobile and contribute little to no signal on DW images and the ADC is increased. In lesions with high cellularity, restricted diffusion is observed so the spins are relatively less mobile and contribute to increased signal on DW image and the ADC is reduced. Because the DW images are T2WI that have been sensitized to proton diffusion, areas with excessive stationary fluid can create an artifact known as T2 shine-through. The parametric ADC map is created to enable diffusion quantification without T2 shine-through effects. The strength of the diffusion gradient moment is denoted by its b value. If b = 0 s/mm 2 , the contrast is essentially T2-weighted. The parameters of b = 50, 400, 800 to 1000 s/mm 2 are, respectively, designated low, intermediate, and high values. At least 2 b values are needed to calculate ADC. The more b values that are used, the more representative the curve would be that is used to calculate the ADC values of any tissue. As one increases the b value to minimize the perfusion effects and obtain a truly DW image, the spatial resolution and signal-to-noise ratio (SNR) are correspondingly reduced, but the lesion conspicuity is usually increased with improved background suppression. A minimum, mean, or maximum ADC can be obtained; however, mean or minimum is most commonly used in practice with the minimum value best correlating with histology.
DW imaging can be obtained in a variety of ways; the most commonly used sequence is the gradient echo-based single-shot echo planar imaging (ssEPI). ssEPI produces fast DW imaging at the expense of spatial blurring, susceptibility, and ghosting artifacts, which are more common at tissue interfaces between bone and soft tissue and can degrade image quality in musculoskeletal tumor evaluation.
To obtain the best DW imaging using ssEPI, multiple parameter options are possible, including using shimming for homogeneous fat suppression and superior background fat suppression using spectral adiabatic inversion recovery (or STIR), reducing the echo spacing by increasing the bandwidth and using parallel imaging, increasing voxel size, increasing the number of averages for higher b values, and lowering the echo time as much as possible (close to 50–60 milliseconds). Other recent approaches include read-out segmented and radial imaging-based methods to reduce distortions. The protocol parameters of various advanced MR imaging sequences are outlined in Table 1 ssEPI takes about 4 to 5 minutes for reasonable SNR imaging. To obtain superior SNR and spatial resolution, which come at the expense of long imaging times, one can also use multishot echo planar imaging (EPI; acquisition time increases to 10–15 minutes) or spin echo-based DW imaging. The authors always obtain DW imaging before administration of contrast for consistency purposes.
| Sequences | TR/TE | Base Resolution | Echo Train Length | Voxel (mm) | Distribution Factor (%) | Field of View (cm) | Acquisition Time (min) | Others |
|---|---|---|---|---|---|---|---|---|
| DW imaging | 8500/80 | 120 | 1 | 1 × 1 × 4 | 0 | 10–20 | 4–5 | b: 0, 50, 400, 800 |
| IVIM | 5000/104 | 192 | 192 | 1.8 × 1.8 × 5 | 10 | 10–20 | 2–3 | b: 1, 50, 100, 200, 400, 700, 1000 |
| DT imaging | 8300/74 | 100 | EPI factor- 100 | 2 × 2 × 4 | 0 | 10–20 | 4–5 | b: 0, 600 Diffusion directions: 12 |
| DCE MR imaging | 4.0/1.81 | 160 | 2.19 × 2.19 × 6 | 15–35 | 6 | 4.0/1.81 | ||
| CASL | 2500/12 | 64 | EPI factor- 64 | 4 × 4 × 8 | 25 | 10–25 | 3–4 | Inversion time = 1800 milliseconds, flow limit-100 cm/s |
| PCASL | 6000/21 | 64 | EPI factor- 32 | 4.7 × 4.7 × 6 | 50 | 30 | 4:06 | Inversion time = 3000 milliseconds |
| Proton MRS- single voxel | 1500/30 | — | — | 20 × 20 × 10 | — | — | 3:20 | Axial orientation: 128 averages |
| Proton MRS- multivoxel | 1080/30 | — | — | 10 × 10 × 10 | — | 16 | 2:45 | Axial orientation, 1 average |
| DWIBS | 6000/70 | 108 | 57 | 5 × 5 × 6 | — | Up to 56 | — | Coronal orientation |
Clinical applications
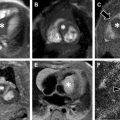
DW imaging has been found to be useful in differentiating benign from malignant soft tissue tumors, with malignancy mostly indicated by ADC less than 1.1 × 10 −3 mm 2 /s. However, the underlying histology has an important bearing on how ADC can be used in practice. Chondroid and myxoid tumors may not significantly restrict diffusion despite underlying high-grade malignancy ( Fig. 5 ). Some benign lesions, such as eosinophilic granuloma, perineurioma, or granular cell tumor, may restrict diffusion due to high cell density and compact connective tissues ( Fig. 6 ). Hematomas also can have low ADC values and mimic solid soft tissue masses.


It is generally agreed in the literature that most aggressive or high-grade malignancies significantly restrict diffusion and produce low ADC values. Highly cellular lesions, such as lymphoma, have restrictive diffusion and ADC values less than 1.5 × 10 −3 mm 2 /s, reflecting high cellularity (>150 cells per high-power field). Benign lesions, such as hemangioma, nonhealed nonossifying fibroma, or enchondroma, exhibit higher ADCs with ranges of 1.5 to 2.5 × 10 −3 mm 2 /s ( Fig. 7 ).

Furthermore, DW imaging aids in determining treatment response. Tumor necrosis results in an increase in diffusion (increase in ADC) due to increased cellular permeability and decreased cellularity and can quantitatively demonstrate the tumor response over time ( Fig. 8 ). Increase in ADC value has been observed after treatment of osteosarcoma. The ADC changes directly reflect the degree of tumor necrosis after neoadjuvant chemotherapy with good correlation between tumor necrosis and diffusion per unit volume. When combining PET/computed tomography (CT) with DW imaging, the maximum standardized uptake value and ADC negatively correlated with each other and were useful to predict histologic response after neoadjuvant chemotherapy in osteosarcoma, even though there was not a significant difference in tumor volume.

DW imaging has been most widely used in neuroimaging and has provided clear differentiation between abscess and tumor necrosis, with a mean ADC of 0.67 ± 0.17 × 10 −3 mm 2 /s versus 2.73 ± 0.34 × 10 −3 mm 2 /s, respectively. In musculoskeletal imaging, markedly restricted diffusion on ADC map can add diagnostic accuracy in the detection of abscesses (92% sensitivity, 80% specificity). In cases of lymph node involvement, an ADC less than 0.94 × 10 −3 mm 2 /s suggests nodal metastasis with 91% accuracy. Whole-body DW imaging has been shown to be useful in pediatric musculoskeletal tumors; however, it is not clear whether T1WI and STIR combination is satisfactory or how much incremental value DW imaging adds in this process. The physical properties and interpretation of various advanced MR imaging sequences are summarized in Table 2 . Whole-body DW imaging is discussed later in the whole-body imaging section.
| Physical Property | Interpretation or Role | |
|---|---|---|
| DW imaging | Random motion of water as microdiffusion | Decreased ADC value in high cellularity, viable tumor portion, tumor recurrence |
| IVIM | Separate diffusion and perfusion using multiple b values | Malignant tumors tend to show lower diffusion (D) and higher perfusion (D*) |
| DT imaging | Use additional gradients to typical DW imaging and identify the predominant directionality of the diffusion | Identify the relationship between major nerves and soft tissue tumors and detecting nerve abnormality |
| DCE MR imaging | Tissue microvasculature, such as tissue perfusion, capillary permeability, and interstitial volume | Qualitative (time-signal intensity curve), semiquantitative, or quantitative (k trans , k ep , v e , and v p ) analyses, change during chemotherapy, viable tumor portion, tumor recurrence |
| ASL | Detect the differences of blood flow in vessels vs stationary tissue using either an inversion pulse or a saturation pulse | Reflect tumor angiogenesis: higher grade or hypervascular tumors show increased ASL blood flows |
| BOLD | Detect the changes in blood and tissue oxygenation before and after oxygen administration using R2* mapping | Assess tissue hypoxia: hypoxic tumors are aggressive and show suboptimal treatment response |
| Proton MRS | Provide biochemical information regarding tissue cellularity and molecular composition | Malignant tumors show elevated choline level due to excessive cellular membrane turnover |
| WB MR imaging | Whole-body imaging with multiple stations | Detection of tumor spread, follow-up for treatment monitoring, NF evaluation, surveillance of genetic cancer-predisposing conditions |
| MR-HIFU | Delivery of targeted ultrasound acoustic energy for coagulation necrosis (>60°C) or target chemotherapy using mild hyperthermia (40–45°C) under MR imaging guidance | Intervention for managing musculoskeletal tumors, such as osteoid osteoma and desmoid fibromatosis without needle insertion |
Pitfalls and limitations
Tumors are commonly heterogeneous, and ADC values vary in different parts of the tumors. In the realm of bone tumors, simple qualitative analysis of DW imaging might yield more useful information rather than specific measurements. Regions of interest (ROIs) should be placed independently in each component rather than drawing a large ROI to average the total area. Using the minimum ADC value rather than average ADC value can be another option, because it reflects the area of the highest tumor cellularity.
Because hemorrhage reduces the ADC value and necrosis increases the ADC value, one should choose a solid nonhemorrhagic area based on conventional or contrast MR images to evaluate the ADC values. Thus, to avoid false positive and false negatives, DW imaging should not be read in isolation as a stand-alone modality. Benign lesions, such as lipoma, abscess, and granular cell tumor, also restrict diffusion. ADC maps should not be evaluated in isolation because fatty, fibrous, or calcified areas are dark on both DW images and ADC maps. Fatty metamorphosis or sclerosis of lesions after successful treatment can reduce the ADC. Thus, DW images and ADC maps should be evaluated critically with respect to changing conventional MR imaging appearances and in light of the treatment patient may have received. ADC may not be reliable in lesions less than 1 cm, and lesion displacement may occur on the images due to image distortion and/or susceptibility artifacts.
The interpretation of DW images in the growing skeleton poses unique challenges in comparison to that in adults. There is marrow conversion from hematopoietic to fatty, from the fingers or toes to the shoulders or hips, and from the diaphysis to the metaphysis. Even though T1- and T2-weighted conventional MR images can provide excellent tissue contrast between normal marrow and infiltrative processes, DW imaging can improve the specificity for diagnosing bone marrow pathologic condition. However, it should be kept in mind that the normal ADC value of bone marrow has age-related changes depending on the red to yellow marrow conversion, and the ratio ranges between 0.2 and 0.6 × 10 −3 mm 2 /s. The highest ADC value of normal bone marrow is low, but still close to the range of pathologic fractures from malignant tumor invasion (0.7–1.3 × 10 −3 mm 2 /s). Epiphyses that contain fatty marrow and bone cortex appear dark on both DW images and ADC maps. Therefore, the age of the patient and anatomic location of imaging are important when interpreting DW images in children.
ADCs can differ based on vendor and software implementations of the technique as well as the underlying magnet and/or gradient strength. The ADC generally decreases with increasing the b values; thus, consistent protocol parameters are required. Manually drawn ROI-based techniques encompass added limitations of reproducibility, accuracy, and time required to evaluate DW imaging. In the future, once DW imaging protocols are standardized, automated approaches to evaluation might make this process easier and more reproducible.
There is an additional limitation to DW imaging in children. Because DW imaging sequences are sensitive to molecular motion in the micrometer range, they are also sensitive to macroscopic motion in all DW sequences, even though spin-echo and stimulated echo techniques are particularly sensitive to long acquisition times, and rapid ssEPI is one technique that minimizes the patient motion problem. A recent study also demonstrated good to moderate reproducibility of free-breathing DW imaging used as multislice ssEPI sequence in pediatric oncologic patients.
Another limitation of ADC is that it demonstrates not only diffusion of water molecules but also tumor perfusion as microcirculation. The diffusion signal experiences a fast decay because of the blood flow along the microvasculature for low b values between 0 and 100 s/mm 2 . ADC values of tumors are increased by the degree of tumor perfusion; this is often observed in highly vascular malignant tumors, which results in considerable overlap of ADC values between benign and malignant tumors. To overcome this limitation, some investigators have suggested a perfusion-insensitive diffusion coefficient value, which is extracted from an exponential function fitted only through the high b values. Using the lowest b value of 50 s/mm 2 rather than 0 s/mm 2 can be another way to reduce the contribution of blood perfusion to the ADC measurement. Selection of b values with a minimum of 270 s/mm 2 and maximum of 800 s/mm 2 can minimize perfusion effects on ADC calculations.
Intravoxel Incoherent Motion
IVIM was first described by Le Bihan and colleagues in 1986; it allows estimation of tissue perfusion by calculation of diffusivity parameters using multi–b-value DW MR imaging. ADC in conventional DW imaging is influenced by water diffusion (more predominant at high b values) as well as perfusion in microcirculation of vessels (more predominant at low b values). When DW imaging is obtained using a series of low and high b values with an ssEPI sequence (eg, b = 0, 10, 20, 40, 50, 80, 100, 200, 400, and 800), one can interrogate IVIM, which is composed of multiple parameters. The D and D∗ Values include the D value (×10 −3 mm 2 /s, illustrates the true or pure slow diffusion within and around the cells, obtained using b values >200) and D* value (×10 −3 mm 2 /s, denotes the fast diffusion/perfusion in microcirculation or a pseudodiffusion coefficient, obtained using lower b values), and perfusion fraction (f; %). These values are obtained using a biexponential fitting of the DW imaging data as opposed to monoexponential fitting used for conventional DW imaging. The acquisition times are in the range of 5 to 6 minutes.
There is no literature in pediatric musculoskeletal disorders using IVIM; however, in a recent report, the utility of this technique was shown in differentiating focal nodular red marrow reconversion foci from malignant marrow, with higher accuracy for D as compared with ADC. Malignant tumors show lower diffusion (D) and higher perfusion (D*) compared with benign tumors. Du and colleagues compared soft tissue sarcomas with benign soft tissue tumors and found that D using the cutoff lower than 0.93 × 10 −3 mm 2 /s was the best parameter to differentiate benign and malignant tumors (100% sensitivity, 83% specificity). Another group showed a similar result with a cutoff D lower than 0.92 × 10 −3 mm 2 /s (92% sensitivity and 89% accuracy) in differentiation between benign and malignant tumors. In another report, the perfusion fraction was shown to be reduced after successful treatment of multiple myeloma in adults. Thus, this novel method offers new opportunities for separate evaluations of diffusion and perfusion of musculoskeletal tumors.
Diffusion Tensor Imaging
DT imaging applies additional gradients to typical DW imaging to detect diffusion as well as to identify the predominant directionality of the diffusion. It requires at least 6 gradients (3 bipolar gradients) and 2 b values (b = 0, b = 500–1000 s/mm 2 ) to measure the fractional anisotropy (FA) and ADC. In organized fibers, the water diffusion is greater along the orientation of the fibers than in other directions; this anisotropy of water diffusion is reflected in the FA value. The FA varies from 0 (complete isotropy) to 1 (complete anisotropy) and organized tissues, such as peripheral extremity nerves, exhibit FA values of 0.5 to 0.7 with 3 times more diffusion along the nerves as compared with across the nerves. Similar to ADC, FA is found to be lower in malignancy, but its role is more suited to tumors arising from organized tissues, such as peripheral nerve sheath tumors. DT imaging can be used to map the predominant directionality of diffusion as eigenvectors, which can be joined automatically by the computer software on a voxel-by-voxel basis to depict tractography. It should be noted that each tract is not representative of an individual fiber in the nerve, but is representative of the directionality of diffusion vectors, that is, functional information. Thus, disruption of tracts indicates altered diffusion in the nerve and can be due to neuropathy or presence of a space-occupying lesion, such as a peripheral nerve sheath tumor. The FA values have been shown to decrease with neuropathy-related nerve degeneration and increase with nerve regeneration.
Technical considerations
DT imaging is more technically demanding as compared with DW imaging in terms of both image acquisition and reconstruction. The SNR is limited in peripheral nerves, and multiple signal averages are usually required in addition to all the tricks for DW imaging optimization, as mentioned above. The trace map or higher b-value maps show good background suppression and display the nerves selectively. Tractography requires input of the DICOM mosaic data into independent compatible software. Manual drawing of ROIs is performed to obtain tracts, which can be overlaid on the anatomic T1WI or B0 images to display the lesion and nerves in multiple planes.
Clinical applications
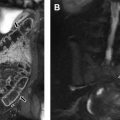
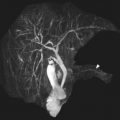
DT imaging is mostly used in the research setting in the realm of peripheral nerves and their tumors. The interpretation expertise is available in a few select centers in the country. Tractography has been shown to be of promise in preoperative planning of tumors and differentiation of benign versus malignant peripheral nerve sheath tumors (MPNST; Fig. 9 ). DT imaging of the peripheral nerve enables identification of the relationship between the major peripheral nerves and soft tissue tumors as well as assessment of peripheral nerve infiltration by malignant tumors. In surgical resection of malignant soft tissue tumors, achieving a negative tumor margin is critical, but if possible, preservation of intact function of the extremities by saving the major peripheral nerve is also important. With high-magnetic-field DT imaging, quantitative and qualitative evaluation is feasible in peripheral nerve fibers as small as 1 mm in diameter. In the case of mononeuropathy induced by either tumor invasion or mass effect, high-resolution MR neurography with DT imaging can play a vital role in detecting nerve abnormality, accurately localizing the lesion, and identifying regional muscle denervation changes. FA has been found to be useful in detection of neuropathy and in a few cases of nerve regeneration following surgery for nerve entrapments. In the future, more exploitation of DT imaging is expected in pediatric tumor imaging, and its role will be further defined.