Chapter 14
Diffusion MRI
Kimball L. Christianson, Allen W. Song, Elmar M. Merkle, and Ramsey K. Kilani
CASE 1

1. What is the diagnosis?
2. What causes the increased signal on the diffusion-weighted image?
3. Why is the apparent diffusion coefficient (ADC) map important?
4. How good is diffusion-weighted imaging at detecting acute stroke in comparison to conventional magnetic resonance imaging (MRI) sequences and computed tomography (CT)?
ANSWERS
CASE 1
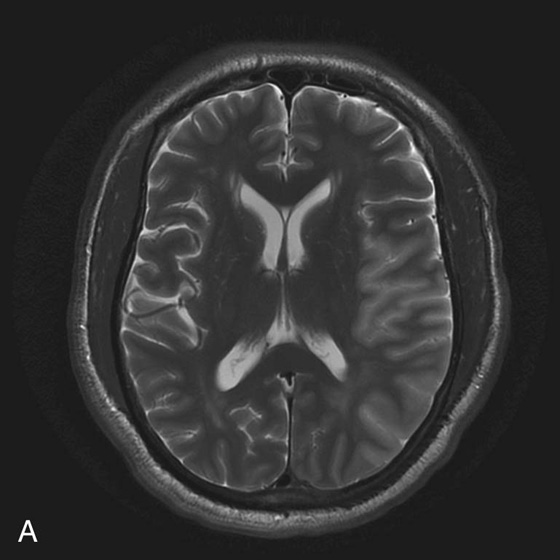
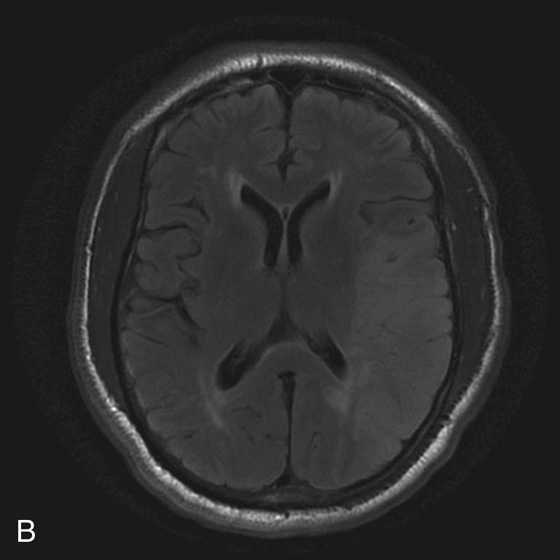
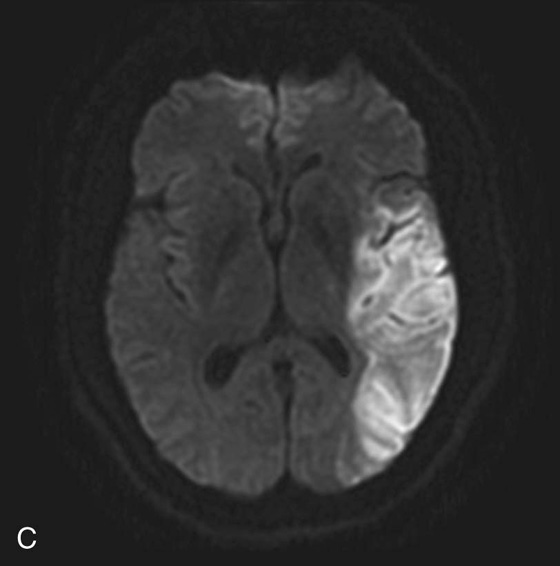
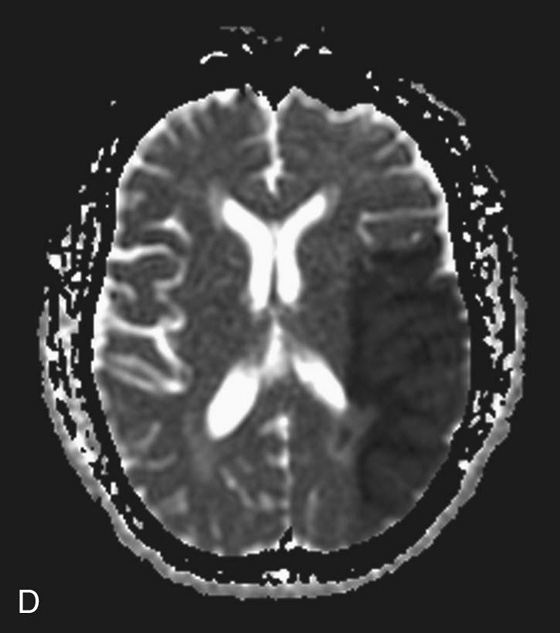
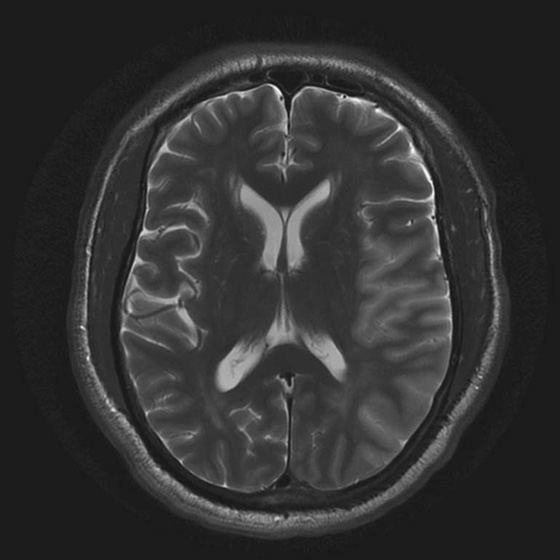
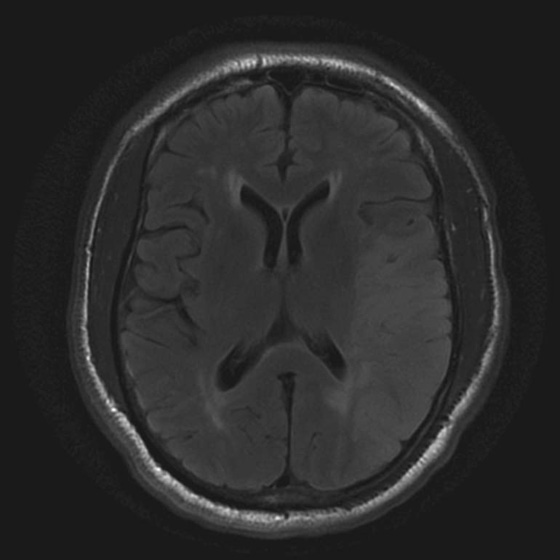
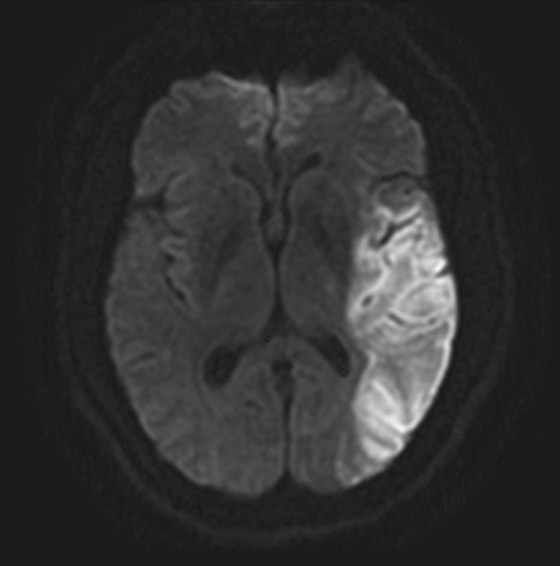
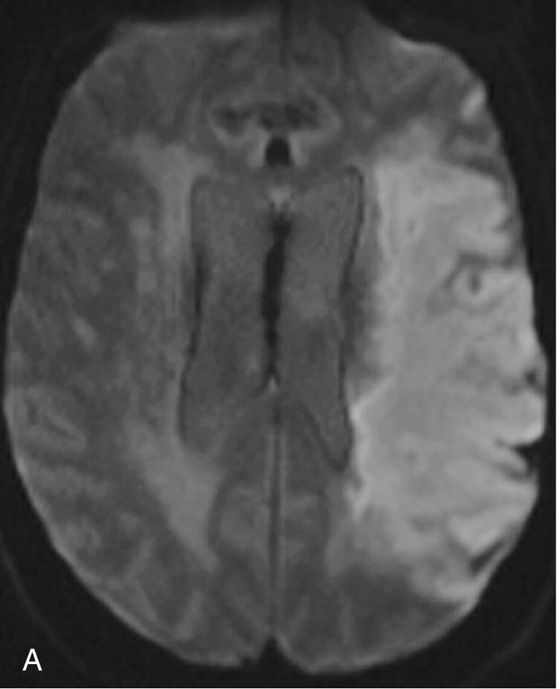
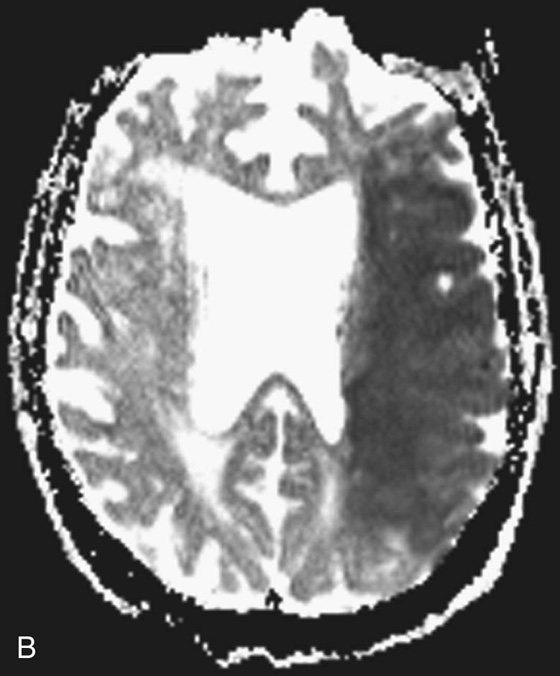
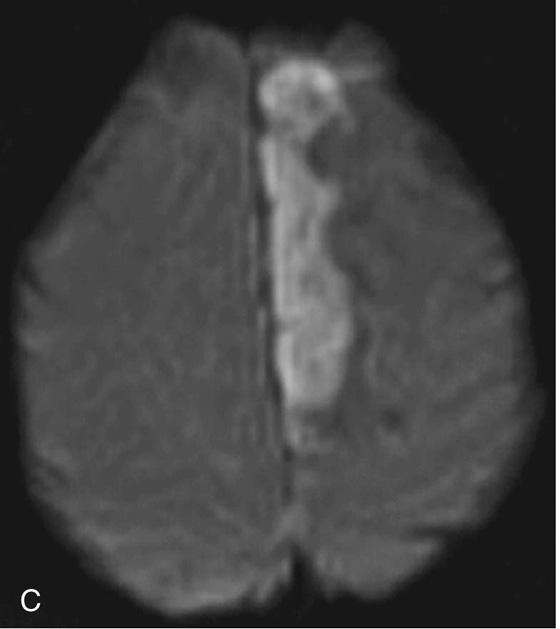
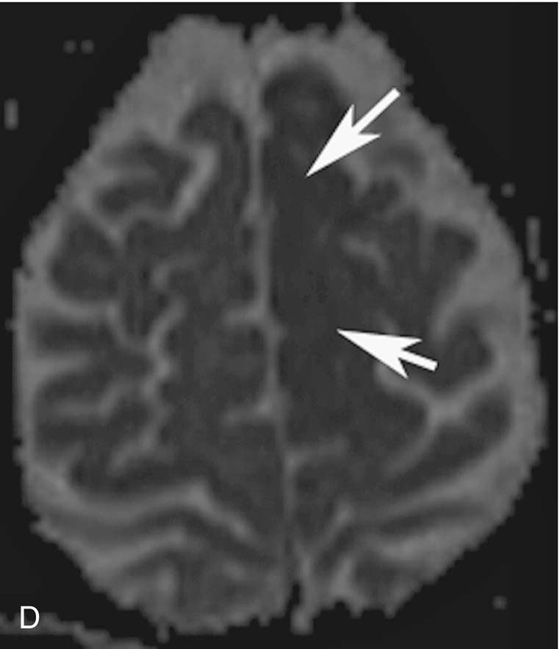
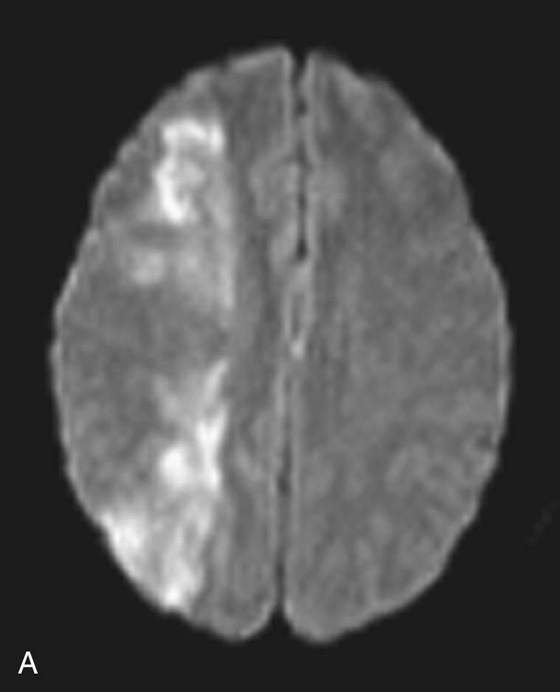
FIGURES 1A THROUGH 1D. T2-weighted (T2W) image (A) and fluid-attenuated inversion recovery (FLAIR) image (B) demonstrate areas of increased T2 signal with associated gyral swelling and sulcal effacement in the left middle cerebral artery (MCA) distribution. A diffusion-weighted image (C) demonstrates increased signal in the left MCA distribution with corresponding low signal in this region on the apparent diffusion coefficient (ADC) map (D) consistent with restricted diffusion.
1. Acute infarction in the left middle cerebral artery (MCA) distribution.
2. Increased signal on diffusion-weighted imaging (DWI) is primarily due to cytotoxic edema (cellular swelling). When neurons become ischemic and oxidative metabolism fails, the ATP-dependent ion transporters stop functioning. This results in an ion gradient across the cell membrane, which causes a shift of water molecules from the extracellular space into the intracellular space. As water increases within the cell (restricted diffusion), an overall decrease in the ability of water to move relative to the extracellular space occurs. Areas of cytotoxic edema, with restricted motion of water molecules, produce increased signal on diffusion-weighted images.
3. There is an element of T2 contrast within a diffusion-weighted image that can manifest as increased signal that is not attributable to restricted diffusion. Therefore, one must be able to distinguish increased signal resulting from restricted diffusion from increased signal resulting from this T2 contrast or T2 shine-through. This is done by means of an apparent diffusion coefficient (ADC) map. If the area of increased signal on the diffusion-weighted image is low in signal on the ADC map, this confirms restricted diffusion. If the corresponding area on the ADC map is high in signal, then the increased signal is due to T2 shine-through, which is seen in facilitated diffusion (noncytotoxic edema) associated with many types of lesions.
4. The sensitivity of detecting acute stroke within the first 6 hours by using CT and conventional MRI alone is less than 50%. Application of diffusion weighting increases the sensitivity to about 95%.1
Diagnosis:
Acute infarct in the left middle cerebral artery (MCA) distribution.
Discussion
Diffusion-weighted imaging (DWI) is based on the principle of “brownian” movement of water molecules. Because of its random nature, the diffusion process cannot be reversed in time. As such, the loss of coherence resulting from diffusion cannot be recovered even when a 180° refocusing pulse is used. The result is diffusion-related signal attenuation.2
Pulse sequences have been designed to make use of the capability of magnetic resonance imaging (MRI) to measure diffusion and apply it clinically. DWI can differentiate fast-moving protons (e.g., unrestricted diffusion) from slow-moving protons (e.g., restricted diffusion).3 Spin echo echo-planar imaging is typically the most commonly used imaging sequence in DWI primarily because of its speed, which helps minimize macroscopic motion artifact. The distinguishing feature of a diffusion-weighted sequence is that two strong equal and opposite gradients are applied on either side of the 180° refocusing pulse. The first gradient pulse dephases the protons and the second gradient pulse rephases the protons. If the protons remain static throughout the course of the pulse sequence, then they will be simply rephased by the second gradient and this will result in no change in phase coherence and signal. If the protons undergo diffusion during the pulse sequence, then they will not be completely rephased by the gradient pair and the result will instead be loss of phase coherence and signal.3
Signal intensity from a diffusion-weighted sequence is generated according to the following equation (Stejskal-Tanner sequence):

Where:
So = signal without diffusion gradients
Where:
G = strength of the diffusion gradients
δ = duration of diffusion gradient pulses
Δ = time between diffusion gradient radiofrequency (RF) pulses
As stated in the above equation, So is the original signal in the image. This signal intensity is made up of T1, T2, and proton density contrast; however, in a spin echo echo-planar sequence the T2 contrast predominates. Therefore, some of the bright signal seen on diffusion-weighted images can be due to T2 contrast. This is often referred to as “T2 shine-through.” An apparent diffusion coefficient (ADC) map is generated to distinguish between bright signal resulting from areas of restricted diffusion and areas of T2 shine-through. An ADC map is generated by combining two sequences, which are performed at different b values; however, all other factors, including T1, T2, and proton density contrast, are kept exactly the same. Typically, one spin echo echo-planar sequence is performed where the b factor is 0 and the image appears as a T2-weighted image. A second sequence is performed where the b factor is greater than 0 and is a diffusion-weighted image. The ADC map is then calculated by taking the negative logarithm of the ratio of those two image sets according to the equation:
ADC mapping effectively eliminates the contribution of all other contrast except that resulting from diffusion. Restated, the contrast of an ADC map is purely dependent on the diffusion coefficient of the acquired tissues and not T1 or T2* values.
Diffusion tensor imaging (DTI) is a variant of DWI that illustrates molecular diffusion along axonal tracts and is discussed in greater detail later in this chapter.
CASES 2 AND 3: COMPANION CASES
Case 2
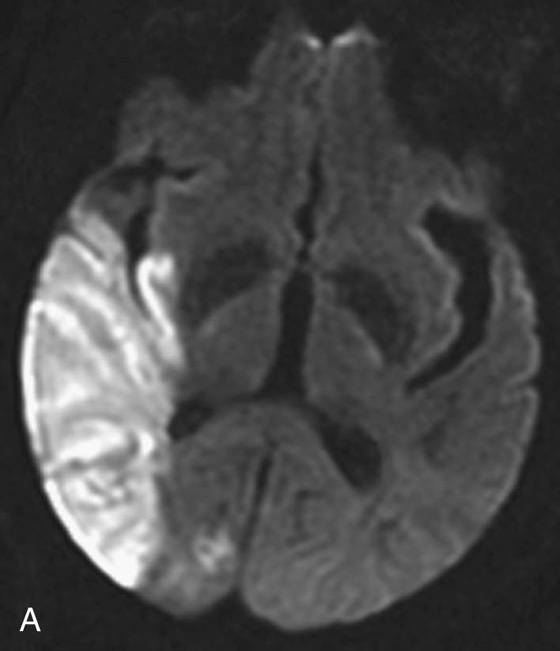
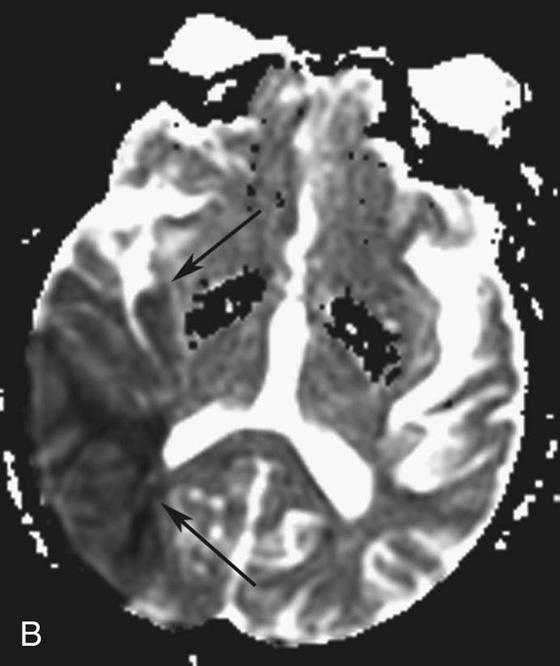
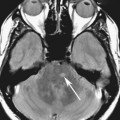
FIGURES 2A AND 2B. Diffusion-weighted (A) and ADC (B) images demonstrating restricted diffusion in the right MCA territory (black arrows, B).
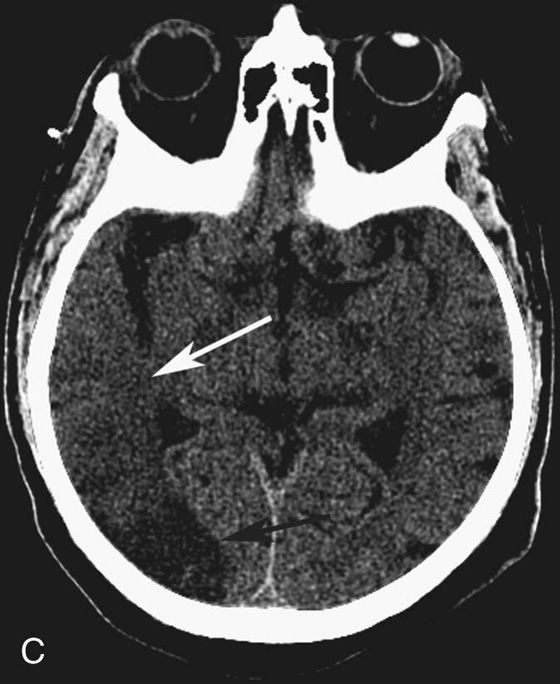
FIGURE 2C. Axial computed tomography (CT) image that shows a corresponding area of low density and sulcal effacement in the right MCA distribution (white and black arrows).
Diagnosis:
Acute infarct in the right MCA territory.
Case 3
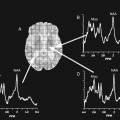
FIGURES 3A AND 3B. Diffusion-weighted (A) and ADC (B) images demonstrating restricted diffusion in the left MCA territory.
FIGURES 3C AND 3D. Diffusion-weighted (C) and ADC (D) images that demonstrate restricted diffusion in the left anterior cerebral artery (ACA) territory (white arrows, D).
Diagnosis:
Left MCA and anterior cerebral artery (ACA) infarcts of different ages.
Discussion
On T2-weighted images, it is often difficult to distinguish between new stroke, old stroke, and new extension of a previous stroke because all appear as increased signal. The aging of infarcts can also be problematic on diffusion-weighted images alone, as the increased signal can be present for months. This increased signal is due to restricted diffusion in the acute phase of an infarct and is increasingly due to T2 shine-through as the infarct ages. Unfortunately, the diffusion-weighted image does not reliably discriminate between causes of increased signal. The ADC map, in contrast, is quantitative and can be used to help age an infarct. In general, within the first 3 days of an infarct the ADC value is decreased about 50% compared to normal parenchyma. Within the second half of the first week, the ADC value is decreased about 25% to 50% and then 0% to 25% within 7 to 12 days. After 10 to 12 days, the signal inverts from low (dark) signal to high (bright) signal on the ADC map. Therefore, increased signal on both the diffusion-weighted image and the ADC map in a patient with known stroke is suggestive of a chronic infarct.4–6
The black arrows in Figure 2B delineate the area of infarction on the ADC map. Visually, there is no significant difference between the decreased signal within the anterior and posterior aspect of the region of infarction. However, when the ADC values were measured, they were decreased by 50% in the anterior aspect of the infarct (white arrow in Fig. 2C) and decreased by 20% in the posterior aspect of the infarct (black arrow in Fig. 2C). This suggests the anterior region of the infarct is acute and the posterior aspect of the infarcted region is subacute. This is consistent with the findings on CT with the very low density posteriorly (black arrow) representing subacute infarct and the more subtle area of low density and sulcal effacement anteriorly (white arrow) representing acute infarct.
The ADC values taken from the left MCA infarct in Figures 3A and 3B demonstrate a decrease in the ADC value of 50% consistent with an acute infarct. The measured ADC value decrease in the left ACA infarct in Figures 3C and 3D is decreased by 20%, consistent with a subacute stroke.
CASE 4
Related posts:
Stay updated, free articles. Join our Telegram channel

Full access? Get Clinical Tree


