ECG
Low voltage: <5 mm in limb leads and <10 mm in the chest leads
Echocardiogram
Thick LV and RV myocardium
Sparkling/granular appearance
Increased LV mass
Small LV cavity size
LV wall thickness-to-ECG voltage ratio
Biatrial enlargement
Pericardial effusions
Restrictive filling pattern
Mitral
E/A
TDI
Pulmonary venous inflow (S> > D)
RVTDI
LV longitudinal systolic strain with apical sparing—apical-to-basal strain ratio >2.1
CMR
Above structural features
Late gadolinium enhancement—diffuse, patchy, subendocardial LGE in the left ventricle, atria, and the right ventricle
Expanded ECV
Nulling of myocardial signal prior to blood pool signal on T1 scout
Radionuclide imaging
Tc-99m DPD uptake—ATTR amyloidosis
Tc-99m PYP uptake—ATTR amyloidosis
C-11 PiB uptake—AL and ATTR amyloidosis
F-18 florbetapir uptake—AL and ATTR amyloidosis
The most definitive diagnosis, however, is by endomyocardial biopsy. After the amyloid deposits are identified on histology (Congo red or sulfated Alcian blue staining), the precursor protein for the fibrils is identified by immunohistochemistry staining for kappa and lambda light chains or transthyretin. Transthyretin protein is further analyzed to distinguish variant TTR from wild-type TTR. But, none of these tests is diagnostic on its own, including endomyocardial biopsy which may rarely be false negative due to sampling error [9]. The information obtained from each of these tests is integrated with clinical data to diagnose amyloidosis, to plan management, and to screen family members of individuals with genetic forms of amyloidosis.
5.2.1 ECG
A classic finding of cardiac amyloidosis is the paradox of a low-voltage ECG (<0.1 mV in all the chest leads or <0.05 mV in all the standard limb leads) in individuals with increased LV wall thickening (Fig. 5.1). Unfortunately, this predicts amyloidosis in only 56 % of individuals with cardiac amyloidosis [10]. These low-voltage ECG patterns are most common in individuals with AL rather than ATTR amyloidosis [6, 11]. Adding to this enigma, individuals with amyloidosis may manifest normal ECG voltage or even high ECG voltage meeting criteria for LVH (especially with senile systemic amyloidosis and coexistent hypertension) [12]. The precise reasons for the low-voltage ECG are not known, but, myocyte atrophy and/or local myotoxicity from circulating AL and amyloid fibril component interactions are possible causal factors [6]. Other significant ECG findings in cardiac amyloidosis patients include pseudoinfarction patterns (66–69 %), atrial fibrillation (5–27 %), first-degree AV block, RBBB, or LBBB (4–33 %) [10, 13, 14]. A 12-lead ECG, though an appropriate first step, is not sufficiently diagnostic on its own. Further evaluation with advanced imaging is often necessary.
Fig. 5.1
Typical ECG in cardiac amyloidosis. A 60-year-old man with AL cardiac amyloidosis has atrial fibrillation, low-voltage ECG in precordial and limb leads, and pseudo Q-waves
5.2.2 Echocardiography
Echocardiography, in cardiac amyloidosis, is fundamental to establish the diagnosis, to define the magnitude of myocardial dysfunction, to guide management, and to define prognosis [15–24]. A comprehensive advanced transthoracic 2D echocardiogram study for cardiac amyloidosis includes assessment of (1) cardiac structure by 2D imaging (Fig. 5.2), (2) valve function by color and spectral Doppler imaging, (3) myocardial relaxation by tissue Doppler imaging of the right and left ventricle, and (4) myocardial deformation by 2D tissue Doppler or speckle tracking longitudinal and radial strain imaging of the left and the right ventricles. Transesophageal echocardiography may be frequently performed, prior to cardioversion, in individuals with atrial fibrillation which is common in cardiac amyloidosis.

Fig. 5.2
Typical echocardiographic features of cardiac amyloidosis. Increased left ventricular wall thickness with sparkling myocardium on parasternal long-axis (a), apical four-chamber views (b) and restrictive filling pattern on the mitral inflow (c), and mitral annular tissue Doppler imaging (TDI, (d) septal, (e) lateral). Panel (f) shows typical longitudinal systolic strain pattern with apical sparing (red in the center of the bulls eye plot represents preserved apical strain)
The classic 2D echocardiographic features of sparkling myocardium and increased left ventricular (LV) wall thickness (Fig. 5.2a, b) typically indicate advanced myocardial infiltration with amyloid. Unlike left ventricular myocardial hypertrophy from increased afterload (hypertensive heart disease or aortic stenosis), the increased wall thickness in amyloidosis represents amyloid deposits, usually parallels disease burden, and is associated with low-voltage ECG [10]. The sparkling myocardial appearance, present in about 25 % of individuals [10], is not specific for amyloidosis and may be seen with other forms of hypertrophic diseases. Increased LV wall thickness (>12 mm), decreased LV end-diastolic and end-systolic volumes, biatrial enlargement, right ventricular (RV) hypertrophy, pericardial effusions, thickening of the interatrial septum (a specific feature) [24], and increased atrioventricular valve thickening characterize cardiac amyloidosis [6, 10, 25].
Imaging of myocardial relaxation by spectral and tissue Doppler imaging demonstrates classic features of restrictive heart disease (Fig. 5.2c–e): E/A reversal, short deceleration time, high E-wave velocity, and reduced pulmonary venous systolic velocity [26]. Tissue Doppler imaging as well as pulmonary inflow parameters are more sensitive than the mitral inflow parameters to identify earlier stages of restriction [15]. While the mitral early diastolic tissue Doppler velocities (e’) are reduced early, before onset of overt congestive heart failure (CHF), peak S-wave velocity on pulmonary venous flow and mitral inflow E-wave deceleration time are later manifestations and are seen in individuals with overt CHF [20]. Objective evidence of abnormalities in diastolic filling portends worse outcomes [27], incremental to LV wall thickening and fractional shortening [17].
Left ventricular myocardial deformation, global longitudinal strain, using 2D tissue Doppler or speckle tracking, is a sensitive and early marker of myocardial systolic dysfunction. Abnormalities in longitudinal strain, with a classic pattern of apical sparing on 2D (Fig. 5.2f) [20] or 3D strain imaging [28], may precede an overt decline of LV ejection fraction. Although the ratio of longitudinal strain at the apex to base (>2.1) may distinguish amyloid heart disease from other forms of LV hypertrophy, there is significant overlap [28, 29].
The right ventricle is almost universally thickened in cardiac amyloidosis. Reductions in RV longitudinal strain as well as tricuspid annular plane systolic excursion (TAPSE) are early markers of cardiac amyloidosis [27, 30] and independent predictors of cardiac death [27].
Although echocardiography is almost invariably the initial test in most individuals with symptoms suggestive of cardiac amyloidosis, it remains insensitive to detect early disease. Also, echocardiography cannot definitively diagnose cardiac amyloidosis from other hypertrophic heart diseases and cannot distinguish AL from ATTR amyloidosis. When the echocardiogram shows classic features, in individuals with biopsy-proven systemic AL amyloidosis, cardiac amyloidosis is diagnosed, and an endomyocardial biopsy is spared. On the other hand, if echocardiogram is classic and systemic, AL amyloidosis is excluded by serum-free light chain assay and serum/urine immunofixation studies, ATTR amyloidosis is possible. Prior to endomyocardial biopsy to confirm ATTR amyloidosis, advanced imaging with cardiac MRI or radionuclide imaging may be performed [9].
5.2.3 Cardiac Magnetic Resonance Imaging
Cardiac magnetic resonance imaging (CMR) is a powerful method to image cardiac structure, function, and amyloid deposition. Clinically, CMR is typically considered in individuals with echocardiograms that are suspicious but not typical for amyloidosis or in individuals with high clinical suspicion, irrespective of echocardiogram results (gene-positive individuals with symptoms or at the age when disease onset is expected). Standard CMR sequences for cardiac amyloidosis include (1) cine images in the standard long-axis and short-axis views to study cardiac structure, systolic function, calculate LV wall thickness and mass; (2) late gadolinium enhancement imaging (about 5 min after injection of gadolinium) in axial, short-, and long-axis views; (3) optimal myocardial inversion time is assessed about 4 min after injection of gadolinium (0.05 mmol/kg of gadolinium at 3 cc/s) to identify specific patterns of myocardial nulling in amyloid as opposed to left ventricular myocardial hypertrophy; and (4) T1 mapping native (precontrast) and post-gadolinium contrast T1 mapping to calculate extracellular volume (ECV).
CMR, with excellent spatial resolution, can characterize the classic phenotypic changes of cardiac amyloidosis, including increased LV and RV wall thickness, myocardial mass, biatrial enlargement, pericardial effusions, and pleural effusions (Fig. 5.3a, b) [31–34].
Fig. 5.3
(a) Cardiac magnetic resonance imaging features of cardiac amyloidosis. Typical features of cardiac amyloidosis on CMR are shown. Left ventricular wall thickness is increased concentrically with and small ventricular cavity and bilateral pleural effusions [A (apical four-chamber view) and B (mid-ventricular short-axis view)]. The late gadolinium enhancement (LGE) images in C (apical four-chamber view) show subendocardial LGE in the right ventricle and the right atrium (different patient than in A); D demonstrates diffuse LGE of the left ventricle (same patient as in A). Typical TI (inversion time) scout images in cardiac amyloidosis are shown in panel B (reproduced with permission from Ref. [35]). (b) The images demonstrate that, in contrast to individuals with hypertensive left ventricular hypertrophy in whom the blood pool signal nulls prior to the myocardial signal (top panel), in individuals with cardiac amyloidosis (bottom panel), the myocardial signal nulls prior to the blood pool signal consistent with diffuse late gadolinium enhancement
Cardiac amyloid deposits can substantially alter myocardial tissue characteristics. Intravenous gadolinium administration markedly reduces the myocardial longitudinal relaxation times (T-1) [32], corresponding to histological distribution of amyloid deposits, with significantly lower T-1 times in the subendocardium compared to the subepicardium [32]. Also, the myocardial T-1 times correlated with myocardial amyloid mass as assessed by left ventricular mass and parameters of diastolic dysfunction [32].
Late gadolinium enhancement (LGE), especially in the subendocardial region, is common (80–90 %) in biopsy-proven advanced cardiac amyloidosis [32–35]. Several patterns of late gadolinium enhancement (diffuse or focal subendocardial, focal or diffuse myocardial patterns) are described, but LGE of the papillary muscle [34] and atria is a distinctive feature of cardiac amyloidosis (Fig. 5.3c, d) [33, 35]. Of note, in cardiac amyloidosis, identifying an appropriate nulling of the normal myocardium can be a challenge and may provide a false-negative result if an incorrect inversion time (TI inversion time) is used. However, when imaged appropriately, global transmural and subendocardial LGE patterns correlate with left ventricular mass index and cardiac amyloid burden on histology [33]. Furthermore, in one study of 47 patients with suspected cardiac amyloidosis, presence of LGE was predictive of worse survival [35].
Furthermore, in cardiac amyloidosis, on post-gadolinium contrast images, the myocardium nulls prior to blood pool on the TI-scout images; this unique feature distinguishes cardiac amyloidosis from hypertensive left ventricular hypertrophy (Fig. 5.4) [36].
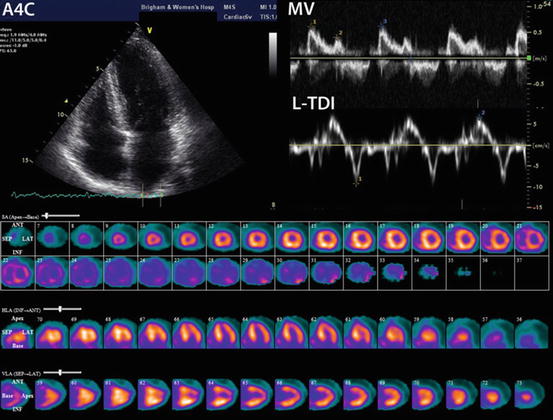
Fig. 5.4
Technetium-99m pyrophosphate imaging in familial transthyretin cardiac amyloidosis. Echocardiogram and technetium-99m pyrophosphate (PYP) images of a 55-year-old woman positive for Ala60 TTR variant and a family history of TTR amyloid cardiomyopathy and neuropathy. The echocardiogram shows relatively normal wall thickness, normal E/A ratio, but significantly impaired lateral mitral annular systolic and diastolic motion by tissue Doppler imaging (TDI). In the bottom panel, the Tc-99m PYP images in short axis (top), vertical long axis (middle), and horizontal long axis (bottom) demonstrate moderate, diffusely increased radiotracer uptake in the left and right ventricles suggesting early cardiac involvement
For the TI scout, a sequence of images are obtained in the mid-ventricular short-axis view and a four-chamber view, using a breath-hold, inversion-recovery cine steady-state free precession (SSFP) pulse sequences, with sequential images of the phases of the cardiac cycle acquired at increasing time from the inversion pulse in 40 ms increments starting at 80 ms [34, 36]. The TI time where 50 % of the normal myocardium nulls prior to the blood pool has been used as the optimal TI time for obtaining the late gadolinium enhancement images [34]. A rapid visual assessment of TI time was helpful to identify cardiac amyloidosis individuals at high risk of mortality [36]. Also, 20–30 % of individuals with AL cardiac amyloidosis have renal dysfunction; a CMR technique that does not require gadolinium contrast, native T-1, is of great interest.
Native (precontrast) T-1 relaxation times were significantly increased in patients with cardiac amyloidosis compared to healthy volunteers [(AL 1140 ± 61 ms vs. healthy 958 ± 20 ms) [37] (ATTR 1097 ± 43 ms vs. healthy 967 ± 34 ms) [38]]. Individuals with AL and ATTR cardiac amyloidosis also have significantly higher T-1 compared to individuals with left ventricular hypertrophy from aortic stenosis [37] or hypertrophic cardiomyopathy [38]. In a study of patients with AL cardiac amyloidosis, increased T-1 time was observed in all patients with LGE [37]. Increased T-1 time correlated with disease burden and was linearly related to myocardial mass (r = 0.58, p < 0.001) and inversely related to left ventricular ejection fraction (r = −0.57, p < 0.001) and diastolic function (E/E’ ratio; r = 0.44, p = 0.001). A higher native T-1 (1,044 ms) also predicted a higher hazard of mortality (HR 5.09, 95 % CI 1.09–23.7, p = 0.04) in patients with AL amyloidosis [39]. Despite the advantages of not using gadolinium contrast, native T-1 mapping has certain challenges: (1) it measures signal from the myocardium and the interstitial space, (2) it cannot differentiate edema from amyloid, and (3) normal reference values are not standardized and may vary by the type of scanner used [40].
Using advanced techniques, myocardial T-1 times measured by post-gadolinium contrast can quantify expanded myocardial ECV from various cardiovascular pathologies including amyloid deposits [41, 42]. Indeed, ECV is significantly expanded in cardiac amyloidosis (mean ECV 0.44 ± 0.12) compared to healthy controls (mean ECV 0.25 ± 0.02, p < 0.001) [39]. Expanded ECV [41, 42] and prolonged T1 relaxation times [37] are directly related to myocardial amyloid burden; they correlate directly with LV mass [37], restrictive features (TDI “S” wave) [41, 42], elevated cardiac biomarker levels (BNP and troponin levels) [41], myocardial uptake of Tc-99m DPD (a specific radiotracer that images ATTR amyloid in the heart) [37], and inversely with left ventricular ejection fraction [37, 41]. Moreover, ECV predicted mortality after accounting for echocardiographic features of diastolic dysfunction, EF, and NT pro BNP levels (HR 4.4.1; 95 % CI 1.35–14.4, p < 0.0001) [39]. Although there are no data, being quantitative metrics, T1 mapping and ECV may serve as valuable tools to longitudinally assess the fate of cardiac amyloid burden in response to therapy.
CMR, however, may be limited in individuals with atrial fibrillation or claustrophobia; gadolinium-based contrast agents are contraindicated in individuals with renal dysfunction, and CMR is contraindicated in individuals with certain cardiac devices (pacemakers, ICD). When feasible, CMR plays a major role in the evaluation of individuals with suspected cardiac amyloidosis. In individuals with biopsy-proven systemic AL amyloidosis, classic CMR findings are virtually diagnostic of cardiac amyloidosis. CMR features, however, cannot definitively distinguish AL amyloidosis from ATTR amyloidosis. Therefore, when cardiac amyloidosis is suspected for the first time based on CMR findings, serum-free light chain assay and serum and urine immunofixation are recommended to exclude systemic AL amyloidosis [9]. If those evaluations are negative, to identify ATTR cardiac amyloidosis, either an endomyocardial biopsy or a radionuclide study using technetium-99m pyrophosphate (Tc-99m PYP) is the next step.
5.2.4 Radionuclide Imaging of Cardiac Amyloidosis
Targeted radionuclide imaging of amyloidosis is a robust method to image cardiac amyloid deposition. Radionuclide imaging is typically considered for the diagnosis of amyloidosis in individuals with a high clinical suspicion for ATTR cardiac amyloidosis. More recently, it is also being used for identifying ATTR amyloidosis when echocardiography or CMR are highly suggestive of amyloidosis, but endomyocardial biopsy is not planned, as in elderly individuals with senile systemic amyloidosis. Radionuclide imaging of cardiac amyloidosis is possible with (1) bone imaging SPECT agents (technetium-99m (Tc-99m) pyrophosphate/Tc-99m 3,3-diphosphono-1,2-propanodicarboxylic acid (DPD)), (2) neuronal imaging agents (I-123 meta iodo benzyl guanidine, mIBG), (3) amyloid-binding SPECT agents (I-123 serum amyloid protein-SAP, Tc-99m aprotinin), and (4) amyloid-binding PET agents (C-11 Pittsburgh B compound, PiB, F-18 florbetapir).
5.2.5 Bone Imaging Agents
Radionuclide imaging with Tc-99m PYP or Tc-99m DPD has been used since the 1980s [43], but has recently reemerged as a dominant method for cardiac ATTR amyloid imaging. Extensive literature supports the utility of Tc-99m DPD and PYP imaging to diagnose cardiac amyloidosis [44–46] and to stratify risk of major adverse cardiac events (MACE). The precise mechanism of myocardial uptake of bone imaging agents is not known, but a calcium-mediated mechanism of uptake has been proposed [46]. Tc-99m PYP or DPD (15–20 mCi) is administered intravenously followed by planar or SPECT imaging (preferred) 2.5 h later (Table 5.2). The myocardial radiotracer uptake is semiquantitatively interpreted in relation to sternal uptake into four grades: 0 = no uptake, 1 = less than sternal uptake, 2 = equal to sternal uptake, and 3 = greater than sternal uptake (attenuation of bone uptake) [44]. When available, quantitation on SPECT/CT images may be preferable to avoid overlap from bone radiotracer uptake [47].
Table 5.2
 Adding T1 Mapping and Extracellular Volume Fraction for Myocardial Fibrosis Assessment: Implications for Cardiovascular Risk Assessment
 Role of Multimodality Imaging in Atherosclerotic Plaque Burden and Metabolism
 Computed Tomography in the Concurrent Assessment of Coronary Morphology and Myocardial Perfusion
 Adding CT Measurements of Coronary Artery Calcification to Nuclear Myocardial Perfusion Imaging for Risk Stratification
 Potential Role of Cardiac PET/MRI in Cardiovascular Disease: Initial Experience
 Combining CT Coronary Angiography and Myocardial Flow Reserve: Is It the Future?


Tc-99m PYP study protocol for suspected cardiac transthyretin amyloidosis
Related posts:
Adding T1 Mapping and Extracellular Volume Fraction for Myocardial Fibrosis Assessment: Implications for Cardiovascular Risk Assessment
Role of Multimodality Imaging in Atherosclerotic Plaque Burden and Metabolism
Computed Tomography in the Concurrent Assessment of Coronary Morphology and Myocardial Perfusion
Adding CT Measurements of Coronary Artery Calcification to Nuclear Myocardial Perfusion Imaging for Risk Stratification
Potential Role of Cardiac PET/MRI in Cardiovascular Disease: Initial Experience
Combining CT Coronary Angiography and Myocardial Flow Reserve: Is It the Future?
Stay updated, free articles. Join our Telegram channel
Full access? Get Clinical Tree
