Diffuse liver disease is a substantial world-wide problem. With the combination of conventional ultrasound of the abdomen, fat quantification and elastography, appropriate staging of the patient can be assessed. This information allows for the diagnosis of steatosis and detection of fibrosis as well as prognosis, surveillance, and prioritization for treatment. With the potential for reversibility with appropriate treatment accurate assessment for the stage of chronic liver disease is critical.
Key points
- •
Chronic liver disease (CID) is a world-wide epidemic. As treatments for viral hepatitis have become available, fatty liver disease is now the major cause of CID world-wide.
- •
Shear wave imaging using ultrasound (US) is a non-invasive, inexpensive, widely-available technique to estimate liver stiffness (LS). LS is influenced by fibrosis, inflammation, and congestion.
- •
Quantitative US is now clinically available to estimate the amount of liver fat.
- •
For accurate estimates of LS and fat quantification, a strict acquisition protocol needs to be followed.
Introduction
Chronic liver disease (CLD) is a substantial world-wide problem. Any disease that incites liver inflammation can lead to fibrosis which can progress to cirrhosis. Major etiologies are hepatitis B, hepatitis C, metabolic associated steatohepatitis (MASH), alcoholic liver disease, autoimmune response, and primary biliary cirrhosis. Box 1 lists major causes of liver inflammation. The primary etiology varies depending on the region of the world with the viral etiologies more prevalent in Asia and Africa while metabolic associated liver disease is more prevalent in Europe and North America although becoming a world-wide epidemic. Chronic liver damage from any etiology results in hepatic fibrosis characterized by an increase in extracellular matrix produced by fibroblast-like cells. The major consequence is increasing deposition of fibrous tissue leading to the development of portal hypertension (PHT), hepatic insufficiency, and hepatocellular carcinoma (HCC). Liver fibrosis (LF) can progress to cirrhosis with distortion of the normal liver architecture and resultant PHT. The time needed to progress to cirrhosis varies with the inciting cause. Cirrhosis is a diffuse process, characterized by fibrosis and the conversion of normal liver architecture into structurally abnormal nodules. The stage of LF is important to determine prognosis, surveillance, and prioritize for treatment now that it is known that treating the underlying cause may cause regression of the fibrosis.
Hepatitis B (chronic)
Hepatitis C
Nonalcoholic fatty liver disease/nonalcoholic steatohepatitis
Alcohol abuse
Drugs (eg, methotrexate and some chemotherapy agents)
Primary biliary cirrhosis
Hemochromatosis
Autoimmune hepatitis
Wilson’s disease
α1-Antitrypsin deficiency
Sclerosing cholangitis
Post gastric bypass
Schistosomiasis
With increasing fibrosis, the liver becomes stiffer, and this eventually results in PHT. Previously the only method of quantifying the degree of fibrosis was a random liver biopsy, but liver histology is an imperfect reference standard. Conventional ultrasound (US) is limited in the detection of fibrosis until the development of cirrhosis. Shear wave elastography (SWE) has become widely available and can assess and monitor liver stiffness (LS). For accurate stiffness measurements a strict protocol is required and is discussed at length in this document.
Metabolic dysfunction-associated steatotic liver disease (MASLD), previously termed non-alcoholic fatty liver disease, is currently the leading cause of CLD world-wide. Hepatic steatosis can be caused by several pathologic processes. The differential diagnosis for diffuse fatty infiltration of the liver is listed in Box 2 . The prevalence of the disease has increased over the last few years: it has been estimated that it increased from 25.5% before 2005 to 37.8% in 2016 or later. MASLD is often a silent disease even at the late stage of severe fibrosis and the diagnosis is frequently made incidentally. Patients with MASLD have a risk of cardiovascular disease, liver-related events, and all-cause mortality higher than the general population. , The steatosis grade predicts mortality and the risk of developing type 2 diabetes mellitus in patients with MASLD. The fatty infiltration of the liver causes inflammation leading to MASH leading to fibrosis and progression to cirrhosis ( Fig. 1 ). If fatty liver disease is identified at an early-stage treatment can reverse the process and prevent the development of cirrhosis and liver cancer.
Obesity
Hyperlipidemia
Nonalcoholic fatty liver disease/Nonalcoholic steatohepatitis
Chronic alcohol ingestion
Steroid use
Amiodarone
Hepatitis B
Hepatitis C
Some chemotherapy agents
Valproic acid
Glycogen storage diseases
Hemochromatosis
Wilson disease
Total parenteral nutrition
Cystic fibrosis

Liver biopsy has been considered the reference standard for detecting and grading liver steatosis. However, it is an invasive procedure with some associated risk of severe complications, and the inter-observer variability in evaluating the specimens is not negligible. In 1 published study, the authors found that there was a poor agreement among pathologists for the assessment of steatosis (intraclass correlation coefficient: 0.57) as well as inconsistent assessment of histologic features of steatohepatitis. Considering the epidemic proportions of fatty liver disease throughout the population, biopsy is not practical for screening purposes due to the large number of affected individuals and invasive procedures should be limited since the tests find only MAFLD with simple steatosis in the majority cases. Furthermore, liver steatosis is a dynamic process that may vary in a short period of time (months); therefore, a non-invasive assessment is crucial.
Normal anatomy and imaging technique
A review of the normal anatomy of the liver can be found elsewhere. ,
Imaging protocols
When evaluating patients with CLD, a complete US evaluation of the liver should be performed. The examination should be performed with a curved linear transducer optimized for abdominal imaging. The frequency of the transducer should be adjusted as needed for the patient’s body habitus. Generally, the left lobe of the liver is best imaged in a supine position using a subcostal approach while the right lobe is best imaged using a left lateral decubitus position through an intercostal window. Deep inspiration by the patient may be required to visualize the dome of the liver. A small sector probe can also be helpful in anatomically difficult locations. Vascular landmarks should be included so the position of the images can be identified according to the Couinaud classification. Color or power Doppler is used to evaluate vessel patency and flow dynamics. The biliary system should also be evaluated. This examination should include evaluation of the liver echotexture, a high-resolution image of the liver capsule, assessment of the size of the right lobe of the liver and caudate lobe, and portal vein diameter. Doppler evaluation with spectral analysis of the portal vein and hepatic veins should be performed. Detection and characterization of focal liver lesions should be included but is not discussed in this paper. The splenic size and evaluation for varies should also be evaluated, particularly in patients with cirrhosis. Table 1 lists the conventional US protocol for CID.
| Mode | Anatomic Location | Key Findings | |
|---|---|---|---|
| B-mode | Curved linear probe | Entire Liver Bile Ducts/Gallbladder | Echo Pattern Capsule Nodularity Liver Size (right lobe and caudate lobe) Focal Liver Lesions |
| Linear probe | Liver Capsule–smooth or nodular | ||
| Color Doppler with Spectral Analysis | Portal Vein Hepatic Vein Splenic Vein IVC Aorta | Portal Vein Size and Flow Pattern Hepatic Vein Patency Varies (present or not) | |
| Elastography | Liver Stiffness ? Splenic Stiffness | Liver Stiffness ? Spleen Stiffness in cirrhotic patients | |
Liver fat estimation
B-mode
B-mode US allows a subjective estimation of the degree of LS, which is usually based on a series of US findings including liver echogenicity, hepatorenal echo contrast, visualization of intrahepatic vessels, and visualization of the diaphragm. However, in addition to a substantial inter-observer variability in scoring steatosis, the performance for detecting LS (fat content ≥ 5%) is low, with reported sensitivity of 53.3%–63.6%. Diffuse fatty infiltration results in increased echogenicity of the liver. This leads to poor or non-visualization of the diaphragm, intrahepatic vessels and posterior part of the right hepatic lobe. Grading can be made using a qualitative grading system of mild, moderate, or severe. Mild (Grade 1) has a diffuse slight increase in fine echoes with normal visualization of the diaphragm and intrahepatic vessels borders. Some have mentioned loss of detail of the hepatic vein margins as an early finding. Moderate (Grade 2) has moderate diffuse increase in fine echoes with slightly impaired visualization of the intrahepatic vessels and diaphragm. There may be apparent relative loss of the echogenicity of the fatty portal triads as the echogenicity of the surrounding parenchyma increases alongside them. Marked (Grade 3) is represented by a marked increase in fine echoes with poor or no visualization of the intrahepatic vessel borders, diaphragm and posterior portion of the right lobe of the liver ( Fig. 2 ).

Hepatorenal Index
A more qualitative method of staging LS is the hepatorenal index ( Fig. 3 ). This is based on comparison of the echogenicity of the liver to the normal kidney. This is available on most US systems. Several studies have found this technique has significant correlation to histologic steatosis. A recent study using 3T MRI as the reference standard found that cut-off values of 1.21, 1.28 and 2.15 had 100% sensitivity for diagnosis of greater than 5%, 25% and 50%, respectively with a specificity of greater than 70%.

Quantitative Ultrasound
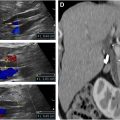
Currently, 3 different quantitative US parameters can be obtained to estimate liver fat with US: attenuation coefficient (AC), backscatter coefficient (BSC), and speed of sound (SoS). All of them are obtained by analyzing the US signals that return to the transducer before any post-processing is applied, that is, the raw echo (radiofrequency) data. AC estimates the rate of the amplitude loss of the US beam traversing the tissue; it is directly related the amount of fat in the liver. BSC is a measure of US energy scattered by reflectors that are smaller than or equal to the US wavelength and that is returning to the transducer. As with AC, the BSC value increases with an increase of liver fat. On the contrary, SoS is inversely related to the amount of liver fat. More details can be found elsewhere.
Controlled attenuation parameter
Controlled attenuation parameter (CAP) is the algorithm available on the FibroScan system (Echosens, France) for the quantification of liver fat content. CAP, which is a non-imaging US-based algorithm performed with a standalone system, is available since more than a decade and has become a point-of-care technique since it does not require imaging expertise. CAP thresholds for detecting and grading liver fat content are highly variable between studies in the literature and also vary depending on the etiology of liver disease.
The system calculates the attenuation slope in decibels per meter (dB/m); results range from 100 to 400 dB/m and is obtained together with the value of LS ( Fig. 4 ). The choice of a correct probe is of utmost importance for reliable readings. It has been shown that the use of the M probe in patients with a skin-to-liver capsule distance gretaer than or equal to 25 mm may overestimate liver steatosis.

The threshold for detecting steatosis (S >0) is quite variable among published studies, ranging from 222 dB/m in a cohort of patients with chronic hepatitis C to 294 dB/m in a meta-analysis that included MASLD patients. , It has been shown that body mass index, diabetes, and etiology of liver disease may have a significant and relevant impact on the CAP values. A recent meta-analysis has shown that the CAP has a suboptimal performance for grading liver steatosis in patients with MASLD. Given the significant variability of CAP, it is not recommended for longitudinal studies.
Quantification of liver fat with B-mode imaging ultrasound systems
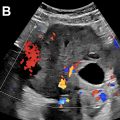
The availability of quantitative US for measuring liver fat on B-mode imaging US systems allows visualizing the area to be sampled while avoiding artifacts; it can be used for the morphologic evaluation of the liver with B-mode, for assessing the portal hemodynamics with the Doppler flowmetry, for the assessment of LS with SWE, and for characterizing a focal liver lesion (if any) with US contrast. 3 methods of quantitative US have been evaluated to estimate the degree of liver steatosis; AC, BSC, and SoS ( Fig. 5 ).

Most of the commercially-available algorithms implemented on US imaging systems are based on the AC estimate. The AC is calculated within a region of interest (ROI) that has a fixed size or is user adjustable. A detailed description of each vendors system can be found elsewhere. The field of view is color-coded in most US systems, allowing the operator to visualize artifacts that should not be included in ROI. These artifacts usually appear in the near field due to reverberation, or sometimes in the far field. In this latter case the artifacts are generally due to low signal-to-noise ratios ( Fig. 6 ). Most systems automatically identify artifacts such as blood vessels and do not include them in the fat estimate. The software on the US system calculates the AC in decibel/centimeter/megahertz (dB/cm/MHz).

Combining the AC with the BSC, some manufacturers have obtained a parameter that gives the results in percentage of fat which they correlated with MRI-PDFF. It must be underscored that this percentage does not correspond to the percentage of liver fat at histology. Rather, it is a quantitative estimate that correlates very well, in an almost linear manner, with MRI-PDFF. , It is expected that other manufacturers will follow this approach. In fact, a percentage is a more practical and intuitive evaluation of liver fat content.
The performance of these new tools has been evaluated using either histology or MR techniques as the reference standard. Most of the published studies were conducted using the AC algorithms. Their accuracy in detecting and grading LS showed an AUC above 0.80 for S greater than 0 in most studies.
A recent meta-analysis, that included studies performed with the AC algorithm from different manufacturers in 1509 patients, has reported that the pooled sensitivity and specificity of AC were 76% and 84%, respectively, for S greater than or equal to 1, and 87% and 79%, respectively, for S greater than or equal to 2.
However, it must be noted that the AC cutoff values for detecting and grading liver steatosis vary between studies, even when they are carried out using the algorithm of the same manufacturer. , These differences most likely are due to the lack of a standardized protocol when performing the AC measurement. Indeed, it has been shown that there is a depth dependence of the AC measurement with a progressive decrease of the AC values with the depth. This effect has been observed with different AC algorithms and may account for the differences in the AC cutoff values observed in the published studies. Moreover, the ROI size can also affect the AC value, yielding an AC value that is higher for 1 cm ROI respect to the 3 cm ROI since the larger box includes a greater proportion of deeper samples if both boxes start at a 2 cm depth. On the other hand, the highest repeatability of the AC measurement was observed when the upper edge of the ROI was positioned at 2 cm below the liver capsule, avoiding reverberation artifacts, and using an ROI size of 3 cm. Early guidance has been published for a standardized protocol. However, additional studies are needed to refine this protocol for widespread acceptance by US vendors.
A few studies in small cohorts have assessed the performance of the algorithm that combines the AC with the BSC. In a study that enrolled 56 overweight and obese adolescents and adults, US Derived Fat Fraction (UDFF) was positively associated with MRI-PDFF (Spearman ρ, 0.82) and the mean bias between UDFF and MRI-PDFF was 4.0%. UDFF greater than 5% had 94.1% sensitivity and 63.6% specificity for diagnosing MRI-PDFF greater than 5.5% with an AUC of 0.90. UDFF is available also with the deep abdominal transducer (DAX transducer) that has been specifically designed for the US evaluation of obese individuals. A very recent study in a large series of patients with CID has shown that the combination of multiple parameters, namely integrated BSC, signal-to-noise ratio, and US-guided attenuation parameter (UGAP), had an accuracy higher than that of the UGAP alone (AUC 0.96 vs 0.92).
Studies evaluating BC or SoS are lacking, and further studies are needed to assess their accuracy alone. Further studies are also needed to assess for confounding factors in the use of quantitative US for fat quantification.
Liver Stiffness Evaluation
B-mode ultrasound
As fibrosis progresses to cirrhosis, the liver becomes nodular. The nodularity can be described as micronodular or macronodular. Nodules less than 3 mm are classified as micronodular while larger ones are classified as macronodular. The end effect of the imaging changes is the same regardless of the inciting etiology. The nodularity of the liver can be best detected by evaluating the liver surface with a high frequency transducer ( Fig. 7 ). The surface should be a smooth echogenic line measuring less than 1 mm. , The presence of ascites may make the surface nodularity more apparent. Interruption of the normal liver capsule line is termed the “dotted-line sign” and has been described as characteristic for micronodular cirrhosis.

Related posts:
 Achieving and Maintaining Excellence
 Challenges in Ultrasound of the Gallbladder and Bile Ducts
 Ovarian-Adnexal Reporting and Data System Ultrasound v2022
 Quality Assurance in Radiology
 DTI Analysis Methods: Fibre Tracking and Connectivity
 Craniopharyngioma – delayed postoperative radiosurgery for recurrence
Stay updated, free articles. Join our Telegram channel

Full access? Get Clinical Tree


