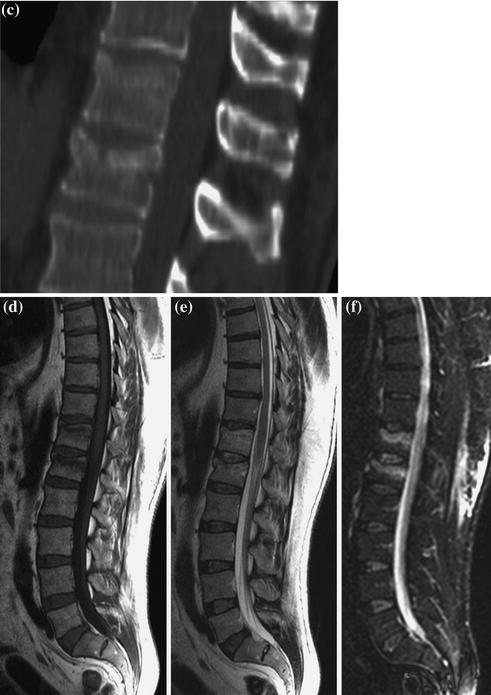
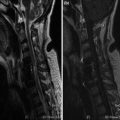
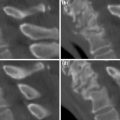
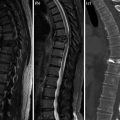
Fig. 1
a–f. XR anteroposterior (a–b) lateral (c), MPR sagittal CT (c), SE T1 (d), FSE T2 (e) STIR (f). D12–L1 superior profile depression. Edema pattern: T1 hypointensity (d), T2 iso/hyperintensity (f)
< div class='tao-gold-member'>
Only gold members can continue reading. Log In or Register to continue
Related posts:
 Herniated Lumbar Disk Diskectomy
 Dorsal Herniated Disk Diskectomy and Stabilization
 Lumbar Stenosis and Degenerative Instability Posterior Rigid Stabilization
 Cervical Spondylodiscitis Corpectomy
 Traumatic Cervical Fracture-Dislocation. Conservative Treatment. Delayed Impaired Consolidation
 Dorsal Collapse in Multiple Myeloma Vertebroplasty
Stay updated, free articles. Join our Telegram channel

Full access? Get Clinical Tree


