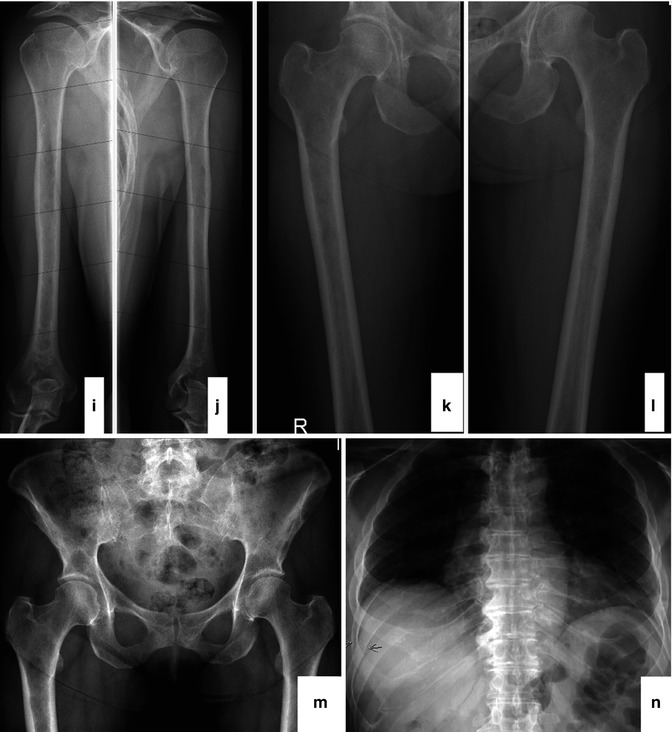
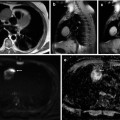
Fig. 54.1
Radiographical skeletal survey of a myeloma patient. The survey includes the skull (2 planes; a, b), cervical spine (2 planes; c, d), thoracic spine (2 planes; e, f), lumbar spine (2 planes; g, h), humeri (both sides; i, j), femora (both sides; k, l), pelvis (m), and thorax (n)
Obviously, the radiological skeletal survey has several advantages. It is widely available and relatively inexpensive, the examination is covered by most insurance companies around the world, and the radiation dose especially with current digital scanners is comparatively low with a radiation exposure of about 3–4 mSv. On the other hand, the use of conventional X-rays has some important problems. First of all it has been shown that 30–50 % of the bone mass has to be destroyed before the damage is detectable by conventional radiography [4]. A second concern is the fact that a complete skeletal survey is demanding for myeloma patients especially at first diagnosis when a significant number of them already suffer from severe bone pain. A complete radiological skeletal survey covers a standard set of conventional X-rays including the skull, spine, pelvis, ribs, humeri, and femora. Furthermore, some parts of the skeleton project one upon the other because of the unidimensional direction of the beam compromising the discriminability of different bones or organs. It is thereby not infrequent that intestinal gas, for example, near the osseous pelvis mimics osteolyses or that smaller lytic lesions of the sternum are missed because they project on the thoracic spine. The capability of skeletal survey to diagnose regression of osteolyses is very limited although healing of myeloma-associated bone damage becomes more frequent since modern therapy with novel agents combined with bisphosphonates lead to longer survival times of up to 10 years or even longer in some patients [5].
There is contradictory scientific data concerning the prognostic relevance of osteolyses detected by skeletal survey. While bone impairment as imaged by conventional X-rays obviously influences the quality of life of myeloma patients and even a prognostic significance of osteolyses has been reported [6], other studies found none or an adverse prognostic effect of normal X-ray findings [7, 8]. This discrepancy may at least in part be due to the limitations of conventional radiography as mentioned above. However, it underlines the need for the implication of advanced imaging techniques on the functional and metabolic level.
54.3.2 Computed Tomography
CT has the highest sensitivity for the detection of changes in mineralized bone structure. Because of the high density of osseous tissue, protocols with comparatively low radiation doses can be applied with an adequate sensitivity and specificity [9–13]. This led to a change of standard imaging procedures in several myeloma centers especially in Europe. As mentioned above, skeletal survey is oftentimes unpleasant for myeloma patients with advanced bone disease. In contrast to this, a whole-body CT scan can be performed within a few minutes with the patient lying on his back. The three-dimensional information of the bone delivered by CT is useful for fine-needle biopsies if the origin of a lesion is unclear and for planning of surgery and irradiation. For assessment of stability of the spinal column, CT delivers the best available information, particularly on the dorsal parts of the vertebral bodies.
Because a significant proportion of patients with myeloma have overt or suspected renal impairment, the application of contrast medium should be reduced to an absolute minimum and to cases of vital indication [14]. Further limitations of CT are among others the incapability to detect diffuse infiltration of the bone marrow especially if primarily cancellous bone is involved. However, recent data has been presented providing evidence that even without the application of a contrast agent, focal tumors in the long bones can be displayed and followed during the course of therapy to a certain degree [15]. Concerning mineralized bone, in contrast to conventional X-rays, CT is capable of detecting early remineralization of osteolyses after effective systemic treatment. Such effects have been described recently especially in patients treated with bisphosphonates and bortezomib [16–19].
The main disadvantage of CT is the radiation exposure which – even when using low-dose protocols – exceeds that of a conventional X-ray examination with reported doses in the literature of 4–7.5 mSv [11, 20]. Since patients with monoclonal plasma cell disorders, and especially in early stages of the disease, live longer due to improvements in therapy, the cumulative radiation exposure becomes an issue and patients are concerned about it when examinations are planned.
54.3.3 Magnetic Resonance Imaging
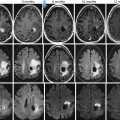
The value of conventional MRI in patients with monoclonal plasma cell diseases has been demonstrated in a large number of publications during the last decades. It has been shown by this technique that myeloma infiltrates the bone marrow in a focal, diffuse, or a mixed pattern with focal lesions on a diffusely infiltrated background (Fig. 54.2a–f). However, some patients even in advanced stages of disease present with minimal or no detectable signs of infiltration in MRI [21–27]. It is still unclear if these infiltration patterns represent different biological subgroups or if they just appear at different time points during the course of the disease. Preliminary data showing different genetic profiles of myeloma cells obtained from the biopsy of a focal lesion and from a random sample of the bone marrow of the pelvis suggest that there is a significant difference between the cells derived from areas of the two different patterns [28].
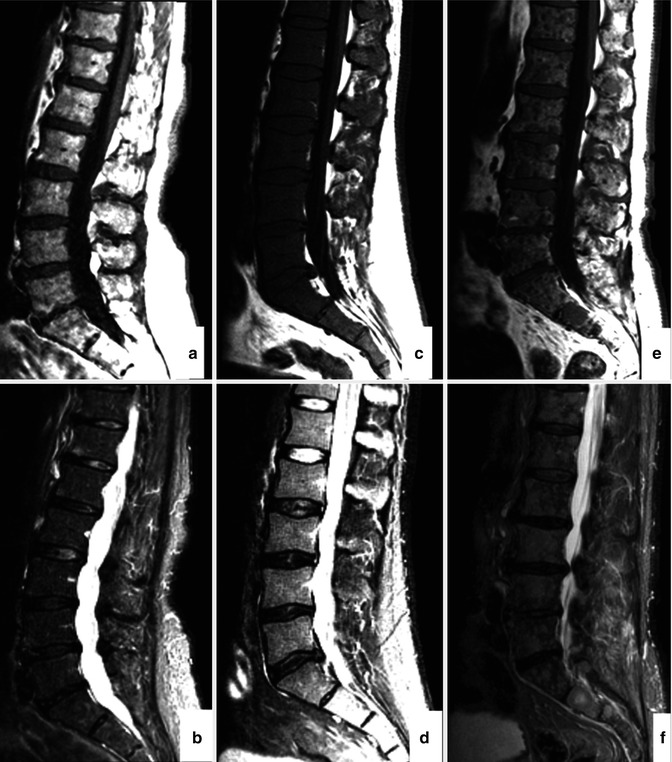
Fig. 54.2
MRI patterns of involvement in multiple myeloma. Lumbar spine in sagittal orientation of a healthy volunteer (a, b) and myeloma patients with diffuse (c, d) and focal (e, f) involvement of the lumbar spine. T1-weighted (a, c, e) and T2-weighted (STIR; b, d, f) images are shown, respectively. Reprinted with permission from Bäuerle et al. [21]
An important advantage of MRI, especially since myeloma patients nowadays live up to 10 years or even longer, is the absence of ionizing irradiation for examination. Comparative studies have shown that MRI has been the modality with highest sensitivity and specificity to detect both of the different infiltration patterns – diffuse and focal [29–32]. By displaying infiltration of plasma cells, MRI is able to detect bone marrow impairment even before the bone structure has been compromised. In many centers spinal MRI is still the standard of care for myeloma patients. However, it has been shown in a study population of 100 patients in all stages of monoclonal plasma cell disease examined with whole-body MRI that 10 % of them presented with focal lesions exclusively in the extra-axial skeleton which means that they would have been missed if only an MRI of the spine was performed [21] (Figs. 54.3a, b and 54.4a–d). Whole-body MRI is able to display nearly the whole bone marrow compartment. Thereby, tumor mass can be assessed even if the patient has an asecretory or hyposecretory variant of a monoclonal plasma cell disease or if random bone marrow biopsy of the pelvis misses focal lesions located elsewhere in the body.
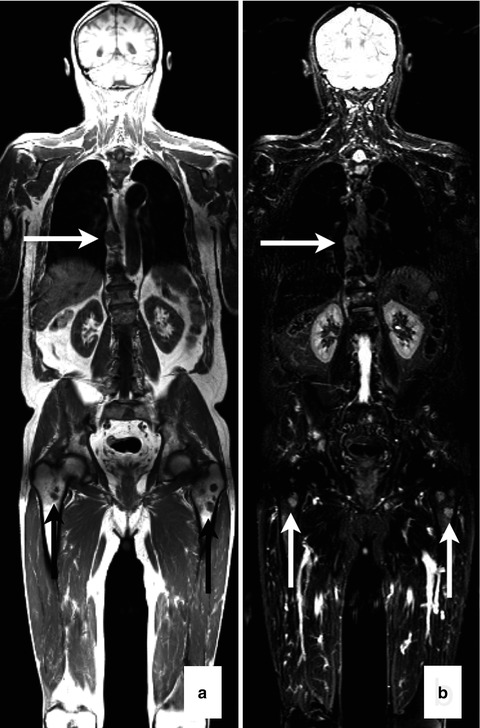
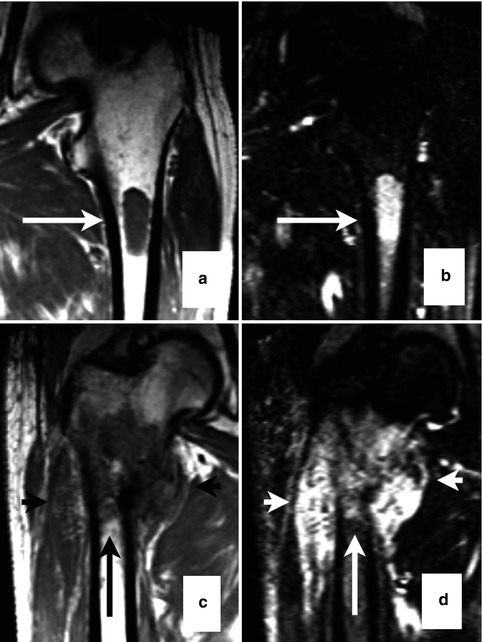
Fig. 54.3
Whole-body MRI of a melanoma patient. Focal lesions (arrows) in the spine and femora as shown on coronal images (a, T1 weighted; b, T2 weighted) of a multiple myeloma patient (Reprinted with permission from Bäuerle et al. [21])
Fig. 54.4
Focal lesions (arrows) taken from whole-body MRI. T1- (a, c) and T2-weighted (b, d) images from myeloma lesions of the proximal femur that are either within the cortical bone (a, b) or exceeding cortical bone with infiltration of adjacent muscle tissue (c, d)(Reprinted with permission from Bäuerle et al. [21])
A prognostic significance has been shown for both the diffuse as well as the focal infiltration pattern repeatedly in different patient populations [26, 31, 33]. Comparison with histology demonstrated a correlation of a diffuse infiltration pattern and increased angiogenesis [27]. Longitudinal studies displayed additional information of MRI as tool for treatment monitoring. Treatment response correlates with serological remission, and a complete remission in MRI is superior concerning outcome compared to serologically defined complete response alone [31, 34]. The high sensitivity of MRI leads to the ability to detect soft tissue tumors that are present in 7–17 % of patients at diagnosis and in 6–20 % in the further course of the disease [35–37].
Besides malignant, hematopoietic, endothelial, and bone marrow cells, also fat cells are components of the bone marrow. With their proportion in healthy individuals depending on the age and the activation of the hematopoiesis, their reduction or disappearance can be caused by malignant infiltration and replacement. Therefore, an approach called “iterative decomposition of water and fat with echo asymmetry and least-square estimation” (IDEAL) imaging to assess the degree of bone marrow infiltration may add further information on the status of the bone marrow in patients with monoclonal plasma cell diseases [38].
54.4 Functional and Metabolic Imaging of Multiple Myeloma
While bone marrow infiltration of monoclonal plasma cell disorders itself can be detected with high sensitivity by conventional MRI, a quantification of this process is rather difficult. To a certain degree and especially in early stages of disease, focal lesions can be counted and tumor mass can thereby be assessed. However, at least in advanced disease when the number of lesions increases and their size differs significantly, it becomes nearly impossible to assess disease activity reliably based on conventional MRI. Furthermore, in case of a diffuse infiltration pattern, the degree of bone marrow infiltration has been estimated by comparing the bone marrow signal with that of the intervertebral disc. This, however, leads to a significant interobserver variability, and it cannot be considered as adequate measurement of tumor mass.
Therefore, quantitative parameters are required to assess pathogenic processes resulting from monoclonal plasma cell infiltration of the bone marrow. In the pathogenesis of MM, a close and vital interaction of myeloma cells with the surrounding bone marrow microenvironment has been described [39, 40]. These processes are steered by cytokines, and a large number of different cell types and bone marrow components are involved. Especially in the progression from early premalignant stage, these interactions play a crucial role [41]. Functional and metabolic imaging techniques comprise DCE-MRI and DWI as well as the nuclear medicine techniques PET and SPECT with various radiotracers. These approaches allow the quantitative assessment of pathogenic processes of proliferating myeloma cells and their impact on the local microenvironment.
54.4.1 Dynamic Contrast-Enhanced Magnetic Resonance Imaging
An important event during the development of a malignant disease is the so-called angiogenic switch. This event is assumed to take place when the balance of anti- and pro-angiogenic factors in the malignant tissue “switch” to a state of increasing formation of blood vessels [42] to support the growth of the tumor. This process has also been described for monoclonal plasma cell diseases [43]. Generally the assessment of angiogenic activity is performed by the measurement of pro- and anti-angiogenic cytokines in peripheral or bone marrow blood or by the quantification of blood vessels in bone marrow biopsies. As at least the latter is an invasive procedure and not well tolerated by patients if carried out repeatedly. For these reasons, the need for noninvasive techniques to determine parameters of vascularization in the bone marrow is obvious.
DCE-MRI has been used to assess the distribution of a contrast agent inside and outside the vascular compartment by analysis of data resulting from repetitive imaging of a certain volume (VOI) or region of interest (ROI) over time [44]. Different pharmacokinetic modeling techniques have been proposed to retrieve this information [45–48]. A head-to-head comparison of the most common algorithms published by Tofts and Brix revealed a slightly higher robustness of the latter, but both methods are in use [49]. DCE-MRI delivers multiple parameters: for the Brix model, these are amplitude A associated with the blood volume and exchange rate constant k ep mainly influenced by the vascular permeability [45, 46]. The Tofts model provides also a blood volume-associated parameter v e and a transfer constant K trans with dependency on perfusion and permeability [47, 48].
Color-coded maps of the lumbar spine for a healthy volunteer and MM patients determined using the Brix model are given in Fig. 54.5a–c. When comparing histological findings in the bone marrow cavity of MM patients with DCE-MRI parameters, a study of Nosas-Garcia et al. revealed significantly higher values of amplitude A and exchange rate constant k ep with a high degree of monoclonal plasma cell infiltration and vessel density [51]. Accordingly, acquisition of parameters amplitude A and exchange rate constant k ep was studied for their potential to stratify between disease stages as well as to determine prognosis and treatment response in individuals and patients with premalignant and malignant stages of myeloma, respectively. For stratification between the nonmalignant precursor of myeloma (MGUS) and malignant forms of myeloma, 222 individuals ranging from healthy controls over MGUS and smoldering myeloma to symptomatic MM patients were studied. Thereby, DCE-MRI-derived microcirculation parameters increased with more advanced stages of the disease (Figs. 54.6a–g and 54.7a, b; [52]). Microcirculation patterns in DCE-MRI showing focal hot spots were nearly exclusively found in patients with symptomatic disease, and advanced patterns went along with a higher histologically or cytologically defined bone marrow infiltration. Until now, this is the only study investigating the prognostic significance of DCE-MRI findings in MM-examined patients with relapsed or refractory disease. Amplitude A of DCE-MRI was demonstrated to be of adverse prognostic significance especially when combined with the serological marker beta2-microglobulin (Fig. 54.8a, b; [50]).
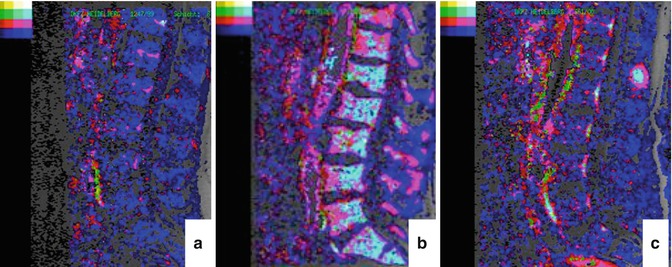
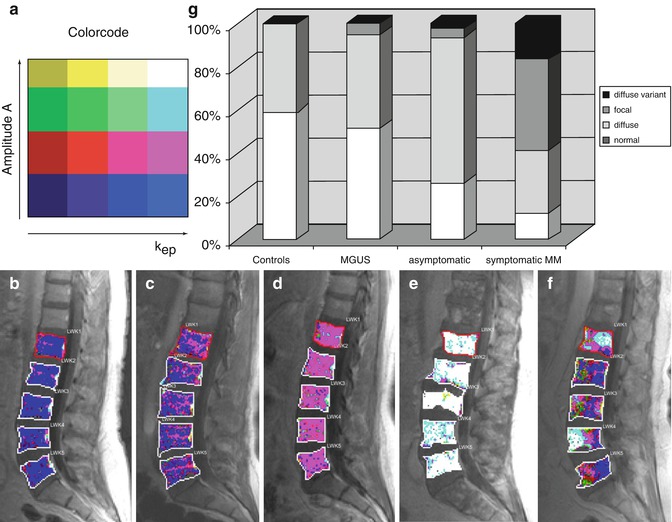
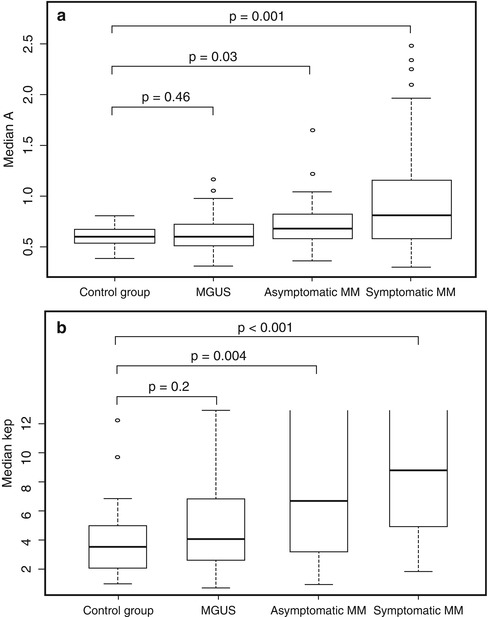
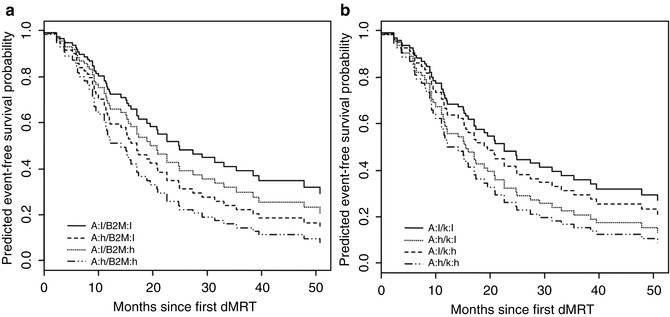
Fig. 54.5
Parameters amplitude A and exchange rate constant k ep (pharmacokinetic model of Brix) determined in the lumbar spine. “Normal” pattern of the lumbar spine of a healthy person with low values for the amplitude A and the exchange rate constant k ep (a, color-coding in blue). “Diffuse” (b) and “focal” (c) infiltration pattern with high values for the amplitude A and the exchange rate constant k ep (color-coding in light blue) in the diffusely infiltrated bone marrow (b) and the focal lesion (c) (Reprinted with permission from Hillengass et al. [50])
Fig. 54.6
Color-coded DCE-MRI maps of the lumbar spine according to the model of Brix. The color code for the amplitude A and the exchange rate constant k ep is presented in panel (a). Representative microcirculation patterns in patients are shown in the lumbar vertebrae in sagittal orientation (b–f). The respective patterns can be classified as follows: (b), “normal”; (c, d), “diffuse”; (e), “diffuse variant”; (f), “focal.” Distribution of microcirculation patterns in healthy volunteers (controls) as compared to individuals with monoclonal gammopathy of undetermined significance (MGUS) as well as patients with asymptomatic and symptomatic multiple myeloma (MM) (g) (Reprinted with permission from Hillengass et al. [52])
Fig. 54.7
Values of parameters according to the model of Brix for the amplitude A (a) and the exchange rate constant k ep (b) in the following groups: control group (healthy volunteers), individuals with monoclonal gammopathy of undetermined significance (MGUS), as well as patients with asymptomatic and symptomatic multiple myeloma (MM). Boxes, first and third quartile; whiskers, 1.5 times of the interquartile range. #, exchange rate constant k ep can be determined reliably in the range k ep < 13 min–1. Therefore, the box plots are not closed for asymptomatic and symptomatic MM (Reprinted with permission from Hillengass et al. [52])
Fig. 54.8
Predicted event-free survival probability for a combination of imaging (DCE-MRI parameters amplitude A and exchange rate constant k ep) and serum (beta2-microglobulin) parameters. a, Amplitude A (DCE-MRI) and beta2-microglobulin (serum); b, Amplitude A and exchange rate constant k ep. A amplitude, B2M beta2-microglobulin, h high, K exchange rate constant k ep (DCE-MRI, respectively), l low (Reprinted with permission from Hillengass et al. [50])
Obviously, DCE-MRI can be used to monitor anti-angiogenic treatment effects, and this has been demonstrated in solid tumors as well as in myeloma [53]. More recently, whole-body DCE-MRI has been applied to monitor treatment response in patients with symptomatic MM showing promising results [54]. However, due to the relatively extensive evaluation procedure, an application in clinical routine is not very likely in the near future.
54.4.2 Diffusion-Weighted Imaging
It has been reported previously that the degree of bone marrow infiltration is of relevant prognostic significance in patients with MM [55] and that it is correlated to the microvessel density in the same area [56]. In early stages of disease, the percentage of monoclonal plasma cells in bone marrow is a defining as well as a prognostic factor [1, 57–59]. The different “macroscopic” infiltration patterns of myeloma described above are reflected in microscopic examinations as well [55]. However, while focal lesions can be counted quite easily, assessment of the macroscopic degree of diffuse infiltration has been performed until now, merely qualitatively by comparison of the subjective signal intensity of the bone marrow with surrounding structures as, for example, the intervertebral discs [60].
DWI is an approach to quantify the cellularity in the bone marrow cavity, and actually a significant correlation with histological parameters has been demonstrated between the apparent diffusion coefficient (ADC) and bone marrow cellularity (Fig. 54.9a–d) [61–63]. Especially in older patients with a relatively high frequency of both osteoporosis and MGUS, it is oftentimes not easy to differentiate if a reduced bone mass is caused by an underlying monoclonal plasma cell disease, leading to the diagnosis of symptomatic myeloma or if two benign conditions (MGUS and osteoporosis) exist independently. In case of vertebral fracture, DWI has been shown to differentiate between malignant and benign osteoporotic fractures [64].
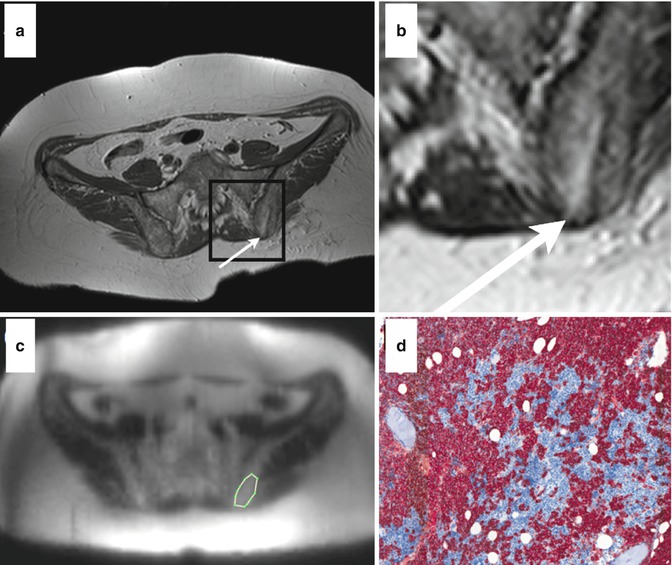
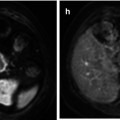
Fig. 54.9
Comparison between DWI and histology in a multiple myeloma patient. Axial T1-weighted image of the pelvis after biopsy (a, arrow indicates the puncture channel; b, magnification of black square from panel a). Corresponding diffusion-weighted image before biopsy including a region of interest (c, white line). Histological section of the bone marrow upon biopsy showing diffuse high-grade plasma cell infiltration (d, staining: CD 138) (Reprinted with permission from Hillengass et al. [61])
A special feature of DWI is that the ADC is not exclusively influenced by diffusion but also by perfusion. However, the intravoxel incoherent motion (IVIM) approach can differentiate between both influences [65, 66] implicating a possibility to also measure microcirculation without the need of a contrast agent. Further studies will elucidate if this technique might lead to comparable results as DCE-MRI in monoclonal plasma cell disorders.
DWI can be applied as whole-body protocol to detect regions of the skeletal system with bone marrow infiltration for screening as well as for monitoring of response to therapy [67, 68]. For assessment of treatment response, initial results of a study investigating the capability of whole-body DWI demonstrated an early change of the ADC compared to baseline measurement [69]. Comparison of the ADC in the lumbar spine before and after chemotherapy revealed a decrease at the second examination to values comparable to those of healthy controls, which were lower at baseline. These contradictory results are probably caused by a strong influence of perfusion on the ADC values [61]. Furthermore, DWI has been used to differentiate benign (osteoporotic) from malignant fractures [70, 71]. In follow-up studies a serological response went along with a decrease of the DWI parameter in the bone marrow of the lumbar spine (Fig. 54.10a, b) [61].
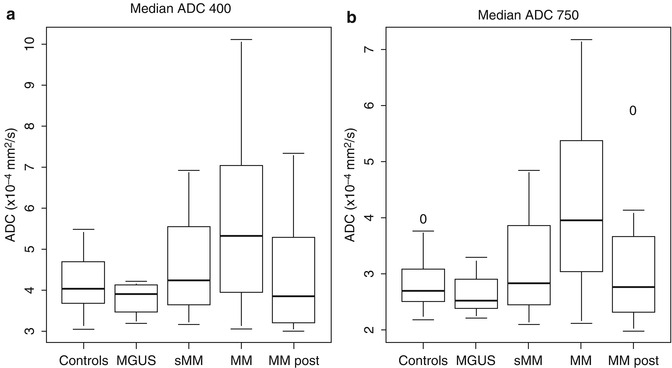
Fig. 54.10
Median apparent diffusion coefficient (ADC) in healthy volunteers (controls), patients with monoclonal gammopathy of undetermined significance (MGUS), smoldering myeloma (sMM), multiple myeloma (MM) before and in remission after systemic therapy (MM post). For calculation of median ADC values, two sets of b-values (a, b = 400 s/mm2; b, b = 750 s/mm2) were used, respectively (Reprinted with permission from Hillengass et al. [61])
54.4.3 Positron Emission Tomography and Hybrid Techniques
Myeloma cells have a relatively low proliferation rate, and the metabolism is therefore also lower than in most other hematological malignancies [72]. Currently, PET gains increasing interest in diagnostic workup and treatment monitoring of myeloma patients. For this purpose, [18F] fluorodeoxyglucose (FDG) PET/CT has been applied to assess metabolic activity within the bone marrow cavity in patients with MM [73]. In symptomatic patients PET-positive focal lesions can be found in up to 75 % and a diffuse infiltration in 17 % of patients [74]. Furthermore, it has been demonstrated that PET results correlate with clinical parameters of myeloma [75, 76]. Furthermore, first results have been generated for [18F] fluorothymidine (FLT) PET/CT and [11


Related posts:

Stay updated, free articles. Join our Telegram channel
Full access? Get Clinical Tree
