Isotope
Natural abundance (%)
Spin
MR frequency (MHz/7 T)
Relative signal (same concentration of element)
Relative SNR* (same concentration of element)
1H
99.99
1/2
300
100
100
7Li
92.41
3/2
117
27.1
69.8
13C
1.07
1/2
75
0.017
0.0677
17 O
0.038
5/2
41
0.0011
0.00815
19F
100
1/2
282
83.3
88.5
23 Na
100
3/2
79
9.25
35.0
31P
100
1/2
121
6.63
16.4
35 Cl
75.78
3/2
29
0.356
3.64
37Cl
24.22
3/2
24
0.0657
0.806
39 K
93.26
3/2
14
0.0473
1.02
Since image noise increases also with frequency, the SNR increases only quadratically with the gyromagnetic ratio (c.f. Eq. 2), if a linear relationship between frequency and image noise is assumed. This is the case for sample dominated losses (i.e., main cause for image noise is inductive losses in the investigated sample) (Hoult and Lauterbur 1979). For small samples (e.g., small animal imaging), electronic losses—which increase only with the square root of the frequency—can dominate image noise.
(1)
(2)
Using known in vivo concentrations and the physical properties as shown in Table 1, the relative in vivo SNR for non-proton MRI can be estimated. Besides the above mentioned aspects, also the relaxation times (Eq. 3), the performance, and geometry of the used receive coil and the magnetic field strength contribute to the final image SNR.
(3)
The SNR can be increased by the use of higher magnetic field strength. For imaging of small samples (e.g., small animal imaging), a slightly higher increase with magnetic field strength compared to imaging of humans is expected (c.f. Eqs. 4a, b). To further increase SNR, measurement time (T AQ), and voxel dimensions (Δx) can be increased (c.f. Eq. 5).
(4a)
(4b)
(5)
The magnetic spin moment of most X-nuclei is higher than for 1H (c.f. Table 1). Nuclei with spin ≥ 1 (e.g., 23Na, 35Cl, 39K, 17O) exhibit an electrical quadrupole-moment. In contrast, spin ½ nuclei (e.g., 1H, 31P) exhibit only a magnetic dipole-moment. The electrical quadrupole-moment leads to a much stronger interaction of the nucleus with its surrounding and, thus, this leads to much shorter relaxation times. As a spin-3/2 nucleus with a non-zero quadrupolar moment, sodium nuclei (23Na) exhibit bi-exponential relaxation in tissues, i.e., fast and slow components of T 2 and T 2* (van der Maarel 1989; Woessner and Bansal 1998). Constantinides et al. (2000) reported for the transverse relaxation time a fast component of T 2f* = 0.46 ± 0.21 ms and a slow component of T 2s* = 12.3 ± 1.9 ms for skeletal muscle tissue (measured at a magnetic field strength of 1.5 T). The inherently short T 2 of sodium makes the images blurry due to a broader point spread function. On the other side, the short T 1 of sodium (~30 ms in tissues) can be used to mitigate some signal loss by rapid signal averaging. However, high-field scanners (7 T and above) with pulse sequences that enable short echo time imaging and dedicated radiofrequency (RF) coil hardware are desirable for X-Nuclei MRI to achieve sufficient SNR and spatial resolution (Fig. 1).
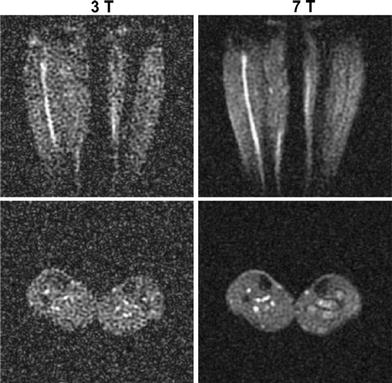
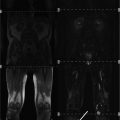
Fig. 1
Transversal and coronal slices of 3D 23Na MR datasets of the human calf muscles. Images were acquired at a magnetic field strength of 3 and 7 T with similar parameters and coil design, to demonstrate the increase of SNR with magnetic field strength. The SNR increases approximately linearly with field strength. Reproduced by permission of Springer from: Amarteifio et al. (2011). ©European Society of Radiology 2011
3.2 Radiofrequency Coils
Since all nuclei exhibit different Larmor frequencies, imaging of each nucleus requires dedicated hardware, such as a broad band amplifier and appropriate transmit and receive radiofrequency (RF) coils. Double-tuned RF coils are often used. Normally, they are tuned to the desired non-proton frequency and to the 1H frequency. The latter enables co-registered acquisition of morphological images and non-proton data. Additionally, shimming of the magnetic field homogeneity can be performed with the routine provided by the scanner manufacturer. However, the double-resonance complicates coil design and leads to a trade-off compared to signal-tuned coils (Mispelter et al. 2006). Since the RF coils are usually optimized for the low SNR non-proton nucleus, SNR, and diagnostic quality of the conventional 1H MRI data can be reduced compared to conventional, single resonant 1H RF coils.
3.3 Pulse Sequences: Why Short Echo Times and Anisotropic Spatial Resolution?
Usually, imaging techniques provided by the manufacturer of the scanner are optimized for 1H MRI. However, most non-proton nuclei exhibit much shorter transverse relaxation times than 1H, which makes the application of specially tailored acquisition techniques favorable. A recent review on this topic can be found in (Konstandin and Nagel 2013). Signal acquisition in MRI requires sampling of the so called “k-space” (Fig. 2). After filling k-space, a Fast Fourier Transform (FFT) is applied to calculate the image. Most acquisition techniques applied for routine clinical imaging, sample k-space on a Cartesian grid. This leads to relatively long echo times (TE). TE is defined as the period of time between signal excitation and the acquisition of the center of k-space that defines image contrast (this is the location of the maximum signal intensity). Even if a fast switching of the readout gradients is applied, echo times are normally larger than a few milliseconds. Since transverse 23Na relaxation times of tissue are in the same range or shorter, this leads to T 2* weighting and signal loss. This can be partially overcome by the application of an asymmetric readout. Asymmetric sampling can be performed due to the Hermitian character of k-space, which leads to the fact that sampling one half of k-space is theoretically sufficient to provide all required data for image reconstruction. However, ultra-short echo times (TE < 0.5 ms) that are required for spin-density weighted 23Na MRI (Boada et al. 1994) can still not be achieved.
Fig. 2
2D visualization of radial (c.f. red lines) k-space sampling. Data acquisition starts directly in the center of k-space enabling ultra-short echo times (TE < 0.5 ms). After gridding the acquired k-space data to a Cartesian grid, a Fast Fourier Transformation (FFT) generates the MR image
To achieve these short echo times, k-space can be sampled by projection imaging (Fig. 2), which was basically the first technique used for MRI (Lauterbur 1973). In projection imaging, k-space is sampled on center-out radial lines. Signal acquisition can be started directly after the excitation pulse is turned off. Only a very short delay (τ ≈ 50 μs) between signal excitation and reception is required due to technical reasons of the scanner hardware. This enables ultra-short echo times (TE < 0.5 ms) and the acquisition of “spin-density weighted” 23Na images, that are a prerequisite for concentration measurements. A drawback of conventional projection reconstruction techniques is that the sampling density is not homogenous throughout k-space, i.e., the center is sampled more densely than the outer part (c.f. Fig. 2). This leads to decreased SNR and can be the cause of image artifacts. Therefore, density-adapted projection reconstruction (DA-3DPR) (Nagel et al. 2009) or twisted projection imaging (TPI) (Boada et al. 1997; Lu et al. 2010) techniques are applied. These techniques lead to a more homogenous distribution of the sampling density. This is achieved be slowing down the sampling velocity in the outer part of k-space (i.e., reducing the amplitude of the readout gradient; DA-3DPR) or by sampling k-space in a spiral manner (TPI). The homogenous distribution of the sampling density leads to a decrease in image noise and thus to an increase in SNR. Additionally, k-space positions are sampled ahead of time compared to conventional projection imaging. This leads to the fact that less signal has decayed at a certain k-space position, which results in less image blurring. In the presence of inhomogeneities of the main magnetic field (B 0), the DA-3DPR sequence is also less susceptible to image artifacts, when compared with conventional projection imaging. This is exemplarily demonstrated at images of the calf muscles (Fig. 3). In the area of the right lower leg, a bad homogeneity (or off-resonance) of the B 0-field was present, most likely due to insufficient shimming of the main magnetic field. Whereas 1H MRI showed acceptable image quality, 23Na images acquired with the conventional 3DPR sequence exhibit severe distortions and signal excitations in the area of the right lower leg. These artifacts increase with increasing readout duration. The DA-3DPR sequence shows much better image quality.
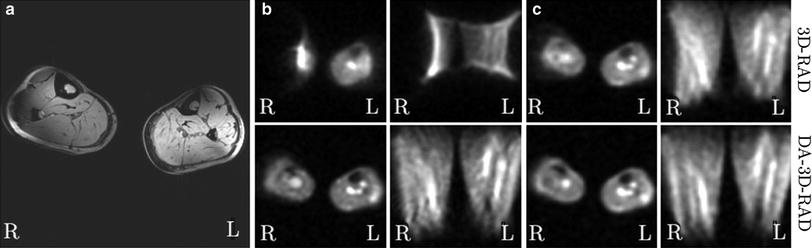
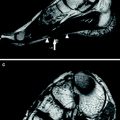
Fig. 3
Images of the calf muscles from a healthy volunteer (B 0 = 7 T). This is a worst-case scenario, where a bad B0-homogeneity in the area of the right lower leg leads to severe image artifacts in 23Na MRI. a 1H MRI yields acceptable image quality, except for chemical shift artifacts and signal variations due to B1-inhomogeneities. b, c Conventional radial imaging (DA-3D-RAD) leads to severe distortions and signal extinctions. A shorter readout duration (T RO) leads to improved image quality (c). The density-adapted (DA) readout scheme further improves image quality. a 1H, T 1-FLASH. b 23Na (T RO = 20 ms). c 23Na (T RO = 5 ms). Figure reproduced from Nagel (2009)
The described projection imaging techniques sample k-space isotropically and, thus, lead to isotropic spatial resolution. To avoid partial volume effects, sequences that enable anisotropic spatial resolution are applied. This enables higher in-plane resolutions, if larger slice thicknesses can be applied. For elongated structures, such as skeletal muscle, this is usually possible without loss of information. A simple approach is 2D projection imaging (Bergin et al. 1991). However, 2D techniques require slice selective excitation pulses that usually lead to longer echo times than for 3D imaging. 3D techniques with anisotropic spatial resolution—based on cones (Staroswiecki et al. 2010), TPI (Watts et al. 2011), and density-adapted projection (Nagel et al. 2012)—were recently developed. By increasing the slice thickness, higher in-plane resolutions can be achieved at similar SNR (Fig. 4).
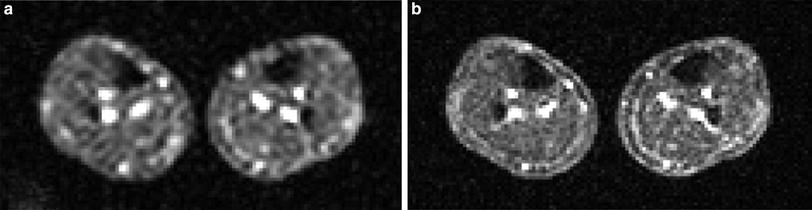
Fig. 4
23Na MR image of the human calf muscle. For both acquisitions (a, b) the same measurement times were used (13 min 54 s). a Isotropic nominal spatial resolution (5.1 mm)3. b The anisotropic sequence enables higher in-plane resolution (3.3 × 3.3 mm3) at similar SNR (slice thickness: 12.7 mm). Figure adapted from Nagel et al. 2012
3.4 Pulse Sequences: Separation Between Different Sodium Compartments
A selective measurement of different sodium compartments (e.g., intra- and extracellular sodium) is of great interest, since it could provide valuable physiological information. Paramagnetic shift reagents (SR), such as the anionic complexes of Dy(PPPi)27− (Gupta et al. 1984), Dy(TTHA)3− (Balschi et al. 1990) and Tm(DOTP)5−1 (Bansal et al. 1993), that do not cross the cell membrane can selectively shift the resonance line of extracellular Na+. Thus, SR allow for a clear separation between intra- and extracellular Na+. Naritomi et al. (1987) obtained the first in vivo spectra of mouse brain and Balschi et al. (1990) studied normal and ischemic rat muscle using Dy(TTHA)3−. Chemical shift imaging (CSI) can be conducted to measure the local distribution of the SR. However, the major drawback of SR is their putative toxicity that hinders its application in humans.
Relaxation weighted approaches can be used to separate different Na+ pools, non-invasively. Inversion Recovery (IR) imaging can be employed to suppress signal from a Na+ compartment with a distinct T 1 relaxation time, if an appropriate inversion time (TI) is used (Fig. 5, Eq. 6). Kline et al. (2000) employed IR imaging to monitor the response to chemotherapy of mouse tumors. Drug administration resulted in an increased IR signal intensity, which is suggestive of an increased intracellular Na+ concentration. In human brain, IR imaging was employed to suppress signal Na+ signal from cerebrospinal fluid (CSF) (Stobbe and Beaulieu 2005) and to suppress edema and CSF in brain tumor patients (Nagel et al. 2011a). Examinations of patients with a muscular channelopathy, where an increase of the intracellular Na+ content can be easily triggered with high reproducibility, demonstrate that IR imaging can provide a weighting toward intracellular sodium (Nagel et al. 2011b) (c.f. Sect. 4).
Fig. 5
Sequence diagram of an IR pulse sequence. The signal intensities are plotted for two different types of tissue with longitudinal relaxation times T 1a and T 1b. The inversion time TI is chosen to suppress signal from sodium ions with relaxation time T1b. IR imaging reduces also the signal intensity of the tissue with relaxation time T1a
(6)
If the mobility of the sodium ions is restricted (e.g., in the intracellular space) the transverse relaxation becomes bi-exponential. This bi-exponential relaxation behavior can be detected using double or triple-quantum filters (Pekar and Renshaw 1969; Jaccard et al. 1986), which is an additional approach to separate different sodium pools. Disadvantages of double or triple-quantum filtered 23Na MRI are a high sensitivity to B 0– and B 1-inhomogeneities and low SNR. Higher SNR can be achieved with bi-exponential weighted 23Na MRI (Benkhedah et al. 2012). In isotropic environments a bi-exponential weighted image contains mainly triple-quantum coherences, but an up to three fold higher SNR is achieved compared to conventional TQF brain imaging. However, up to now this type of sequence has not been applied to muscular 23Na MRI.
To conclude, MRI of fast relaxing nuclei, such as sodium (23Na) requires specially tailored hardware (RF coils and broad band amplifier). High magnetic field strengths (B 0 ≥ 3 T) and specially adapted pulse sequences are a prerequisite to achieve good image quality. Similar to conventional 1H MRI, different image contrasts such as spin density weighted or inversion recovery imaging can be employed.
4 Applications of 23Na MRI in Muscular Channelopathies and Muscle Dystrophies
In healthy cells the intracellular Na+ content is about a factor of 10 lower than the extracellular concentration. This concentration gradient is mandatory for the functioning of cells. The energy-consuming Na+-K+-ATPase contributes to this concentration gradient and helps to maintain the membrane potential of cells. While pumping three sodium ions out of the cell it carries only two potassium ions into the cell. Thus, in total it removes charge from the intracellular space. A breakdown of the Na+-K+-ATPase or an increased open probability of mutated cellular ion channels [e.g., in muscular channelopathies (Lehmann-Horn and Jurkat-Rott 1999)], can lead to an increase of the intracellular Na+ concentration and to a depolarization of the cells (Fig. 6). Since 23Na MRI is currently a research tool and not a widespread clinical tool, only a few muscular disease processes have been studied using 23Na MRI. Constantinides et al. (2000) reported an up to 70 % increase of the sodium signal intensity in an affected muscle group of a patient with myotonic dystrophy. In diabetes, a decreased Na+/K+-ATPase activity is expected (Clausen 2003). Chang et al. (2010) measured pre- and post-exercise sodium signal intensities in healthy muscle tissue of healthy volunteers and patients with diabetes. Exercise leads to increased sodium signal intensity. Their results indicate that the subsequent signal intensity recovery is more slowly in diabetics than in healthy subjects. A possible explanation might be a reduced activity of the Na+-K+-ATPase. Many studies have been performed on patients with muscular channelopathies where increased 23Na signal intensities were detected (Amarteifio et al. 2012; Jurkat-Rott et al. 2009; Weber et al. 2006a, b) (see also “MRI in Muscle Channelopathies” for more details). In this section we exemplarily demonstrate the application of different 23Na MRI techniques for the examination of patients with Paramyotonia Congenita (PC). PC is an example of a rare muscular channelopathy, where an increased intracellular Na+ concentration and cell depolarization can be easily and reproducibly provoked. A trigger mechanism is exposure to cold, which causes a long-lasting depolarizing Na+ inward current and muscle weakness (Lehmann-Horn and Jurkat-Rott 1999). At an early stage, this does not lead to morphological changes that can be visualized by conventional imaging techniques. 23Na MRI can visualize this increase of the intracellular Na+ content. Different 23Na MRI techniques were tested. Conventional 1H MRI to visualize possible fatty infiltration of the muscles or muscular edema was performed for comparison. Between the first and the second measurement a provocation of one lower leg was performed. The provocation consists of cooling for 25 min (Fig. 6c) followed by a short exercise (2 min). The exercise was performed directly after cooling. The subjects had to dorsiflect their feet against resistance and stand on their tiptoes. The provoked muscle of the PC patients showed a pronounced decrease of muscle strength and an increase of the 23Na MRI signal, whereas 1H MRI showed no pathological findings (Fig. 7b). The signal increase was most pronounced for 23Na IR imaging. No significant changes were visible for the muscle tissue of healthy subjects (Fig. 7a). These results indicate, that the 23Na IR sequence provides a strong weighting toward intracellular sodium and that the 23Na IR sequence enables a better visualization of intracellular sodium content changes than the 23Na T1 or 23Na TSC sequences (Nagel et al. 2011b).
Fig. 6
The Na+-K+-ATPase helps to maintain the membrane potential (a). In muscular sodium channelopathies, a mutated sodium channel (b) can have an increased open-probability, which leads to an inflow of Na+ into the cell and to a breakdown of the membrane potential. c In patients with paramyotonia congenita (PC)—a rare muscular sodium channelopathy—this increase can be triggered with exposure to cold
Fig. 7
a Transversal 1H MR and 23Na MR images of the lower legs of a healthy subject before (measurement 1) and after provocation of the left lower leg muscle (*, measurement 2). Signal intensities of 23Na T1 and 23Na IR imaging were normalized to reference tube 2 (51.3 mmol/L NaCl and 5 % agarose gel). The 23Na TSC signal intensities are given in mmol/L. Note that reference tube one (pure 51.3 mmol/L saline solution) shows no signal intensity in 23Na IR imaging. The positions of the ROIs are shown, exemplarily. The signal emanating from intravascular sodium ions is suppressed in 23Na IR imaging (arrows). In 23Na T1 imaging reference tube one shows also reduced signal intensity compared with reference tube 2 (5 % agarose gel). Fat and bone exhibits lower signal intensities compared with muscle tissue in all three 23Na MRI sequences. After provocation (*) no distinct signal change is visible for all sequences. b 1H MR and 23Na MR images of a PC patient. 1H MRI revealed no pathologic signal changes before and after provocation. The cooled leg (*) showed a distinct muscular 23Na signal increase in 23Na T1 and 23Na IR imaging, as well as a slight increase in the total Na+-concentration (23Na TSC), when compared with measurement 1 and the non-provoked leg. Slight 23Na signal increases are still visible in measurement 3 (110 min after provocation). The increase is most pronounced in 23Na IR imaging. Images and figure caption reproduced from: Nagel et al. 2011b. Reproduced by permission of Lippincott Williams & Wilkins. Copyright © Lippincott Williams & Wilkins
Besides muscular channelopathies, recent studies have shown a role of sodium MRI also for muscle dystrophies, such as Duchenne muscular dystrophy (Weber et al. 2011, 2012). In a recent study on eight patients with Duchenne muscular dystrophy (mean age, 9.5 ± 5.4 years) and eight volunteers (mean age, 9.5 ± 3.2 years), the presence and persistence of muscular edema and the myoplasmic sodium (Na+) concentration was assessed using 3-T proton (1H) and 23Na density-adapted 3D-radial MR sequences. Seven Duchenne patients were re-examined about 7 months later without change of therapy. The muscle edema was quantified on STIR images with background noise as reference and fatty degeneration on T1-weighted images using subcutaneous fat as reference. Na+ was quantified by a muscular tissue Na+ concentration (TSC) sequence employing a reference containing 51.3 mmol/L Na+ with 5 % agarose. With an IR sequence, mainly the myoplasmic Na+ was determined. In this study, the normalized muscular 23Na IR signal intensity was higher in Duchenne patients than in volunteers (Fig. 8) and persisted at second measurement. When compared to volunteers (25.6 ± 2.0 mmol/L), TSC was markedly increased in DMD (38.0 ± 5.9 mmol/L, p < 0.001) and remained constant (n = 7, 1st: 37.9 ± 6.4 mmol/L, 2nd: 37.0 ± 4.0 mmol/L, p = 0.49). Muscular edema (p < 0.001) and fat content (p = 0.003) were also elevated in Duchenne patients when compared with healthy volunteers. This could also be confirmed during follow-up (n = 7, p = 0.91, p = 0.12). The authors concluded upon their initial data that 23Na MRI detects a muscular Na+ overload in Duchenne muscular dystrophy. This permanent myoplasmic Na+ overload in all Duchenne patients may be osmotically relevant and may play a role in the development of the muscle edema, which was present and persisted in all studied Duchenne patients. This muscle edema may contribute to the progressive muscle degeneration and may be part of a general mechanism in muscular degeneration, because a muscular Na+ overload was also reported in the chronic form of hypokalemic periodic paralysis (Jurkat-Rott et al. 2009) (see also “MRI in Muscle Channelopathies” for more details).
Fig. 8
 of Skeletal Muscle in Neuromuscular Disease: A Clinical Perspective
 of Skeletal Muscle Anatomy to MRI and US Findings
 MRI for Evaluation of the Entire Muscular System
 MR Imaging of the Skeletal Musculature: From Static Measures to a Dynamic Assessment of the Muscular (Loco-) Motion
 Spectroscopy and Spectroscopic Imaging for Evaluation of Skeletal Muscle Metabolism: Basics and Applications in Metabolic Diseases
 in Muscle Tumors and Tumors of Fasciae and Tendon Sheaths


Edema-like changes and increased muscular sodium are constantly present in Duchenne muscular dystrophy. MRI of both calves of a 5-year-old Duchenne boy without glucocorticoid medication (deleted exons 45–50; a–f) and a 5-year-old healthy volunteer (g–j); a, g T1-weighted, b, f, h STIR, c, e, i 23Na TSC images, d, j 23Na T1 IR images. There is no fatty degeneration of the triceps surae muscles both in the Duchenne boy (a) and the age-matched healthy volunteer (g). However, muscular edema most pronounced in both soleus muscles (arrows in b, f) are visible, both at first (b) and follow-up MR images (f) compared to normal findings in the volunteer (h). 23Na IR (d) and TSC 23Na MRI (c) reveal elevated signal in both soleus muscles (muscular Na+ concentration in mmol/L of 39.32) compared to the volunteer (muscular Na+ concentration in mmol/L of 25.26; i, j without changes at follow-up (e). The tibial bones present with low 23Na signal. With the 23Na IR sequence, the 23Na signal emitted from vasogenic edema and vessels was sufficiently suppressed. Note that the signal of the reference tube containing free 51.3 mmol/L Na+ solution (asterisks in c, d, i, j) is suppressed in the 23Na IR sequence (d, j), while the contralateral reference tube filled with 51.3 mM Na+ in 5 % agarose gel is well visible. Exemplary, the ROI positioning on the right soleus muscles on the 23Na MR and 1H MR images is given in a–d. Adapted by permission of Springer from: Weber et al. (2012). Copyright © by AAN Enterprises
Related posts:
of Skeletal Muscle in Neuromuscular Disease: A Clinical Perspective
of Skeletal Muscle Anatomy to MRI and US Findings
MRI for Evaluation of the Entire Muscular System
MR Imaging of the Skeletal Musculature: From Static Measures to a Dynamic Assessment of the Muscular (Loco-) Motion
Spectroscopy and Spectroscopic Imaging for Evaluation of Skeletal Muscle Metabolism: Basics and Applications in Metabolic Diseases
in Muscle Tumors and Tumors of Fasciae and Tendon Sheaths
Stay updated, free articles. Join our Telegram channel
Full access? Get Clinical Tree
