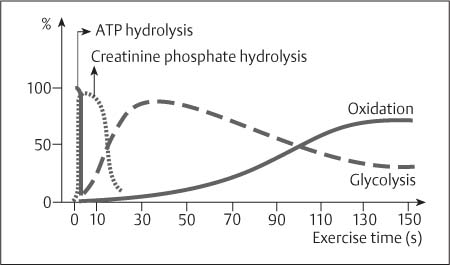
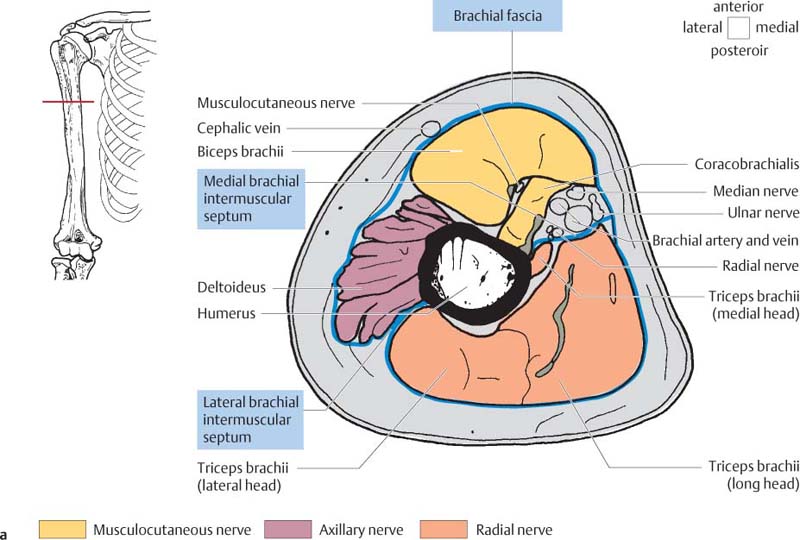
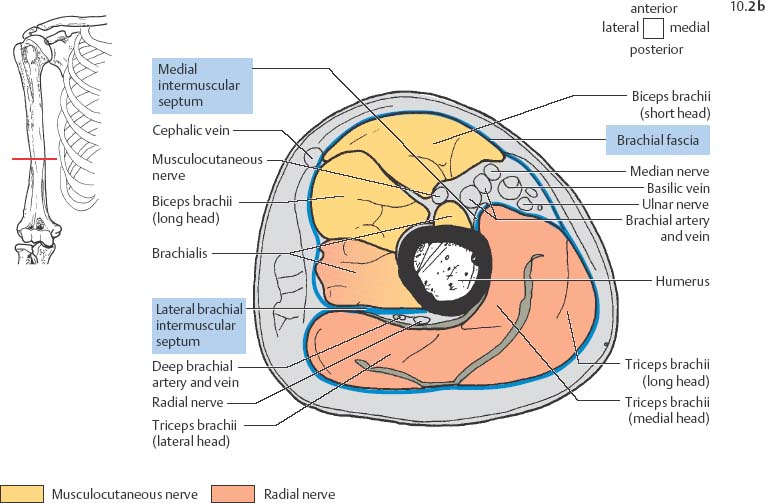
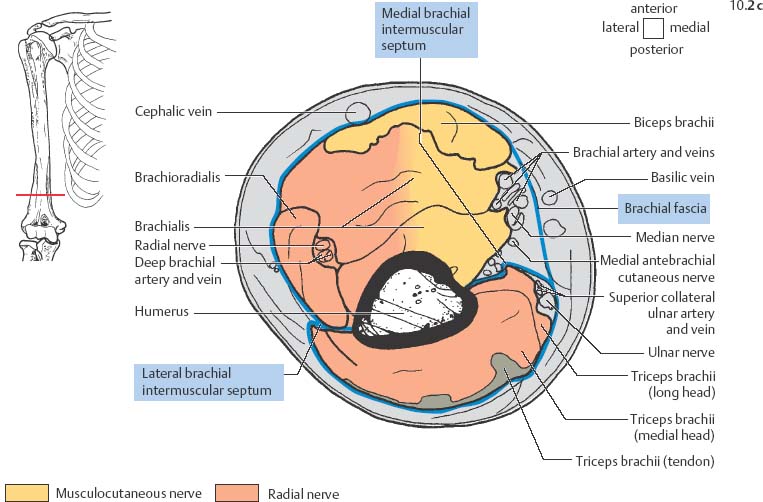
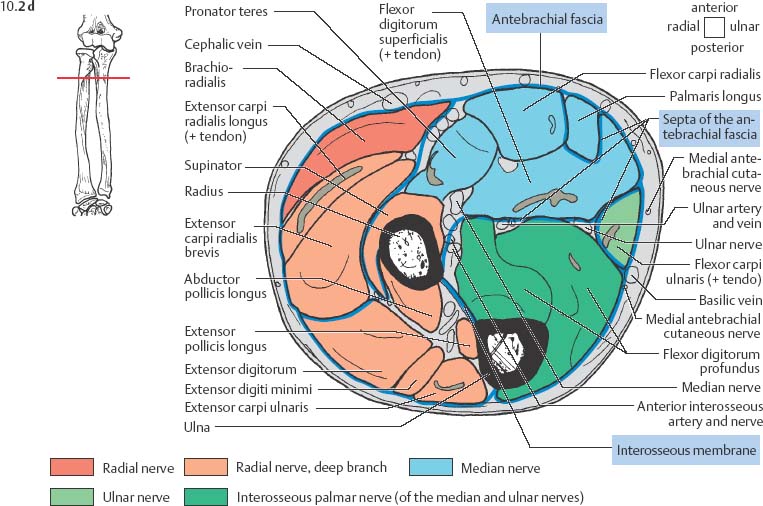
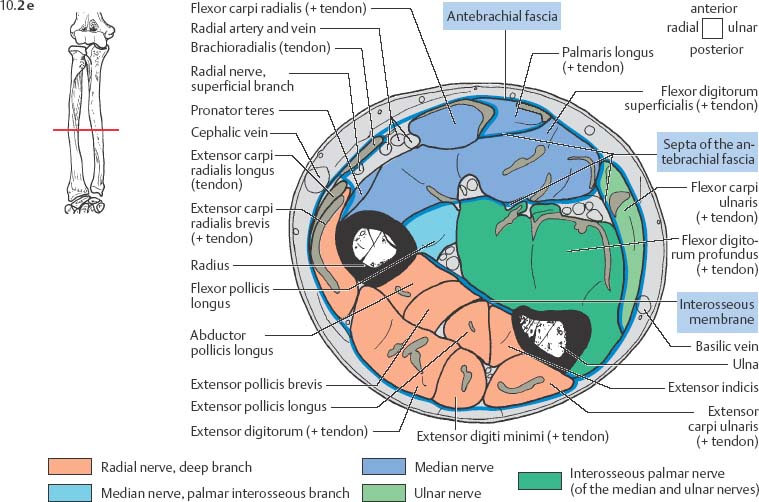
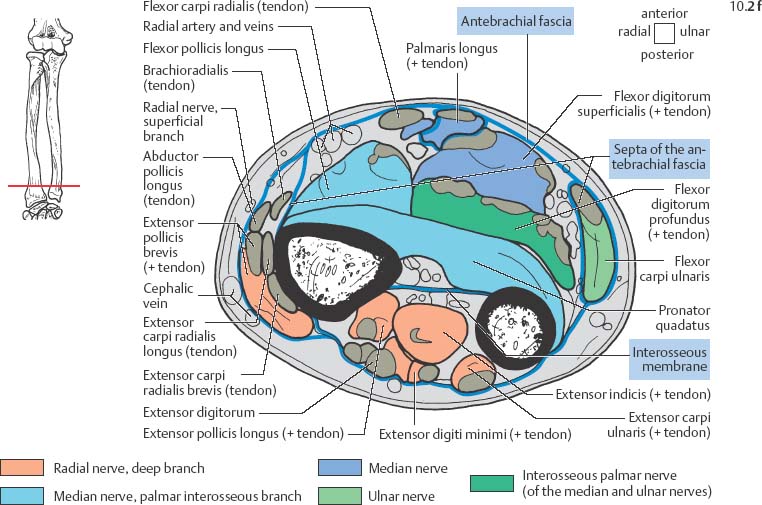
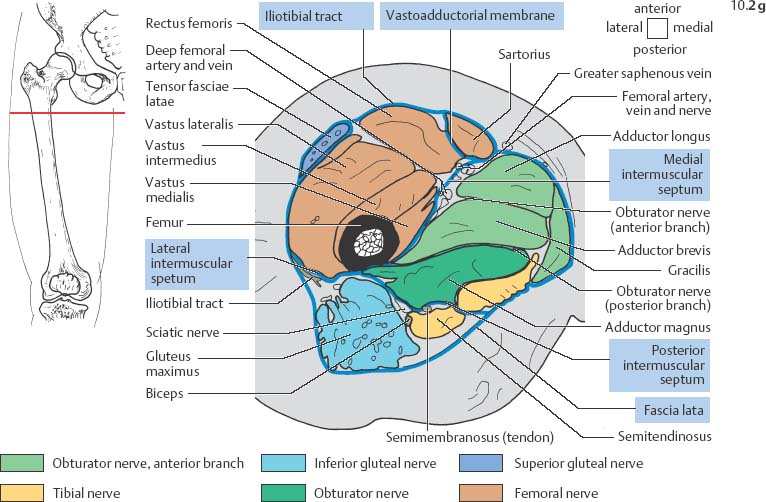
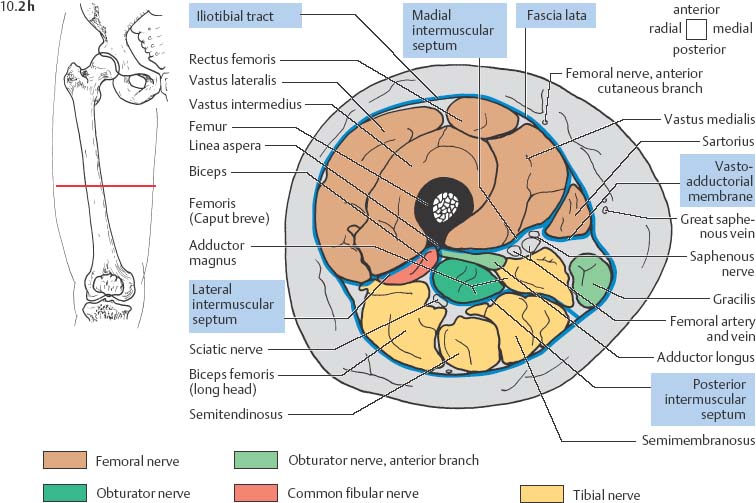
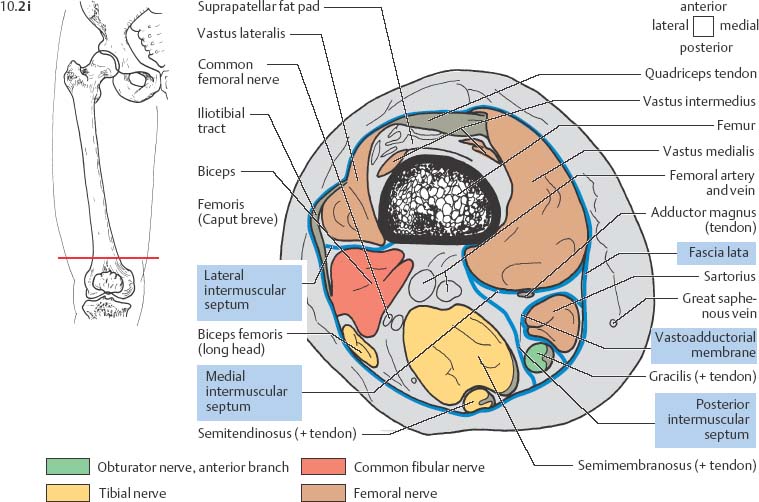
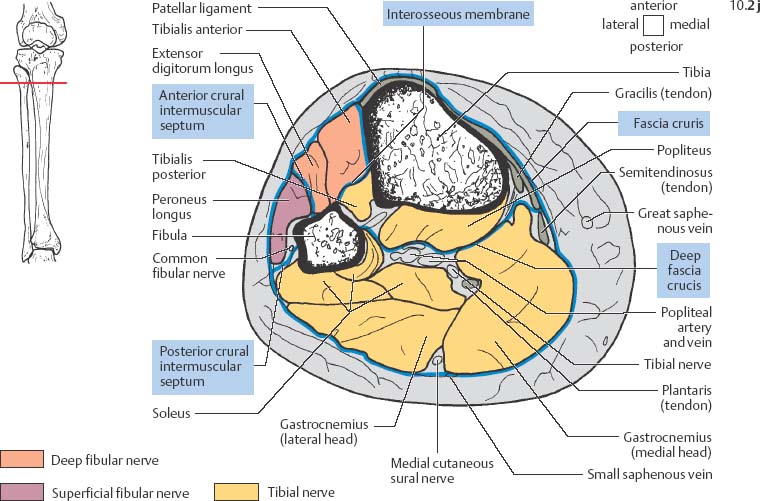
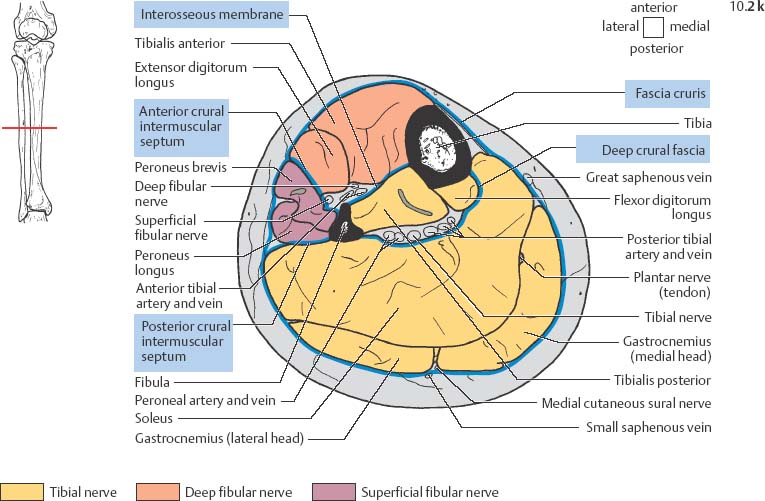
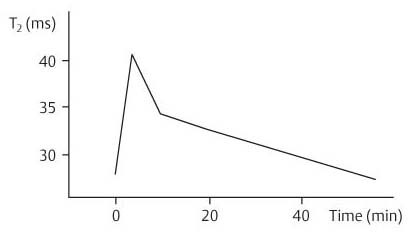
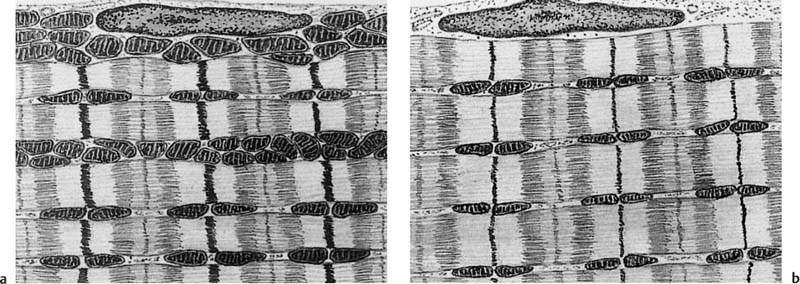
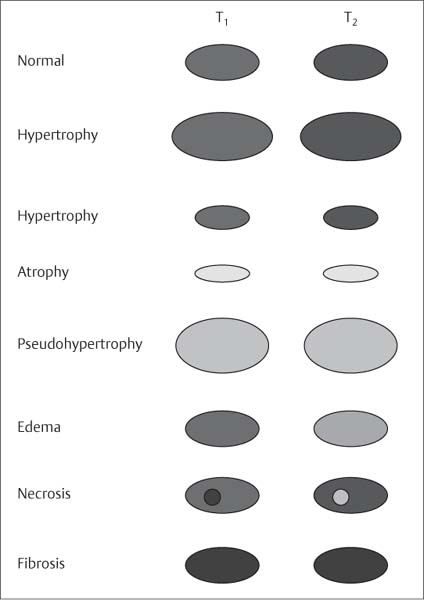
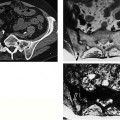
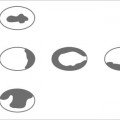
10 Musculature MRI has been intensively applied to the field of myopathies and muscle physiology in recent years. Owing to its noninvasiveness, MRI can visualize new aspects of muscle physiology and anatomy. This chapter will address the specific anatomy and physiology relevant to MRI. The axial plane has been found useful for examining the musculature of the extremities. The selected field of view should encompass both legs since any asymmetry detected by comparing both sides can reveal important diagnostic information. For localized findings confined to one leg, surface coils, such as flexible rectangular coils, knee coils, and ring coils, should be used to achieve a higher resolution. T1-weighted sequences are obtained to assess the distribution of fat and to identify fatty atrophy in chronic muscular dystrophies. A T2- weighted sequence should be acquired to show any muscle edema either in myositis or following exercise and to discover focal areas of increased signal intensity due to tumorous or liquefying processes. Fat-suppressed STIR sequences are particularly useful for detecting edematous muscular changes. As described in Chapter 1, STIR sequences are characterized by the additive T1 /T2-image contrast and are superior to all other sequences for the detection of edematous changes. Fat suppression can distinguish fat from blood. A distinction might be impossible otherwise since fat and blood may have high signal intensities on T1-weighted or T2- weighted images or both. Thus, STIR sequences as well as T1-weighted sequences should be part of any examination of the musculature. Coronal and sagittal sections can be added to the diagnostic evaluation of the musculature whenever it is necessary to delineate the full extent of the disease process. MR spectroscopy is the only noninvasive method that can directly visualize in vivo concentrations of the compounds involved in energy metabolism in muscles at the cellular level. Exercise MR spectroscopy can also measure the metabolic changes during muscular exercise. However this has not yet become established in clinical practice, in part because of the complexity of the examination technique and in part because of the wide range of physiologic muscular reactions related to the different myosin filaments and various pathways of energy metabolism. Moreover, the interpretation of the measured data is still problematic. Though many investigations have proven the sensitivity of the method, a reliable assignment of the data to a particular metabolic abnormality is still lacking. The relevant observable metabolites in the phosphorus spectrum are phosphocreatine, inorganic phosphate, γ-, α-, β-phosphate of the nucleotide triphosphates, phosphodiester (glycerol phosphocholine and phosphoethanolamine) and phosphomonoester of phospholipid metabolism. Phosphocreatine serves as a reference substance for the changes in chemical shift of the remaining phosphorus metabolites. The changes in chemical shift of inorganic phosphates relative to phosphocreatine can be used to calculate the intracellular pH noninvasively. The muscle cell uses ATP as the sole source of energy for its contractile force. Various pathways, which can be aerobic or anaerobic, provide the ATP for the myosin filaments. An additional reservoir of high-potential phosphoryl groups exists in the form of phosphocreatine, which is the source of energy for bursts of increased energy demands or until glycolysis takes over. The high phosphoryl transfer potential of phosphocreatine cannot be used directly to supply the energy for cellular reactions. Creatine kinase must be used to catalyze the transfer of the phosphoryl group to ADP to form ATP. The formation of ATP from phosphocreatine and the release of energy from ATP can be summarized in the following formula: phosphocreatine2 → creatine + Pi2 +energy To maintain the ATP concentration, active muscle fibers induce the hydrolysis of phosphocreatine with a decrease in the phosphocreatine level and a proportionate increase in the inorganic phosphate concentration. Fatty acid metabolism. After hydrolysis of triacylglycerol in the plasma, the free fatty acids are degraded into acetyl CoA in mitochondria by oxidation at the -carbon, followed by aerobic degradation in the citric acid cycle and electron transport chain. The citric acid cycle and electron transport chain constitute the common final pathway for the metabolic intermediates of aerobic glycolysis, beta oxidation and glucogenic amino acid degradation. The oxidation of fatty acids is the most economic release of energy. The flow of electrons through the electron transport chain is coupled to the level of ATP in the inner mitochondrial membrane. This coupling assures that the oxidative phosphorylation responds to the actual energy need of the cell and represents a respiratory control since the availability of oxygen is the limiting factor. The substance preferentially metabolized by the muscle depends on both the level of activity and the type of muscle fibers. At rest, most of the energy needed is derived from the aerobic metabolic pathways. Because of the relatively low demand for ATP, even low perfusion provides an adequate supply of oxygen and fuel, and the oxidative degradation of blood glucose and fatty acids predominates. Muscular activity changes the conditions. In the early phase of active contraction, the demand for ATP increases by a many hundredfold factor compared to that at rest. However, the adaptation processes, such as vasodilation, increased cardiac output, and faster respiration, take several minutes until they improve the oxygen supply. Fig. 10.1 Time course of the energy supply in the muscle during stress. In the initial phase of active contraction, the muscle must cover the increased energy demand with such endogenous metabolites as phosphocreatine and glycogen that can be degraded without oxygen under anaerobic conditions. Fig. 10.1 illustrates the temporal sequence of the energy supply in muscles during exertion. Within the first few seconds, the necessary energy is delivered by the breakdown of creatine phosphate. The oxidative energy supply begins slowly and glycolysis surpasses the creatine phosphate conversion after about ½ minute. After prolonged muscle exertion, the oxidative metabolic processes assume an increasingly more important role. After about 100 seconds, the proportion of anaerobic and oxidative metabolic processes is about 50% each. Dividing the muscle fibers into type I, slow twitch muscle fibers, and type II, fast twitch muscle fibers, also correlates with the preferred metabolic pathway. While type I fibers predominantly use the aerobic metabolism and are less subject to fatigue, type II fibers primarily depend on anaerobic glycolysis and have a high contractile velocity but suffer from relatively rapid fatigue. Whether the distribution of the different muscular fiber types is genetically determined or represents adaptive processes cannot be answered definitively at present. Exercise MR spectroscopy of phosphate metabolism is the ideal technique to study muscle physiology at rest and during exercise that occurs during athletic activities. Although biopsy is the gold standard, MRI has the advantage of being noninvasive and can be repeated as often as necessary. Numerous investigations have addressed the question whether the different types of muscle fibers are genetically determined or adaptively acquired. The discussion continues, with good arguments for each assumption. One of our own studies has shown how the use of different metabolic pathways correlates with the different fiber types constituting the muscle (5). A definite decrease in the pH value corresponded to a higher proportion of type IIb fibers and an unchanged pH value to a dominance of type I fibers. It seems that genetic factors primarily are responsible for the pattern of chemical reactions but that training can cause redistribution, even though its role might be secondary. Various disturbances of the muscular metabolism have been investigated. In particular, exercise MR spectroscopy has produced interesting and clinically relevant results. This is a glycogenosis (glycogen storage disease) caused by a muscle phosphorylase deficiency. The muscle glycogen cannot be converted to glucose 1-phosphate. Exercise31P MRI spectroscopy has confirmed the theoretically expected manifestation, indicating a massive breakdown of phosphocreatine and failure of normal acidification. Infusion of glucose corrects these observed findings, with a return of the exercise-induced pH drop and considerable improvement of the muscle energy metabolism (3, 26, 33). This is involved with the conversion of fructose 1-phosphate into fructose 1,6-biphosphate. The enzyme catalyzes a step of the glycolysis. MRI spectroscopy can detect an increased PME peak, corresponding to the accumulation of fructose 1-phosphate produced as part of glycolysis. This is associated with an inadequate intra-cellular acidosis, attributed to impaired glycolysis with reduced production of lactic acid. Similar findings are found in patients with phosphoglyceromutase deficiency. Phosphoglyceromutase is an enzyme of glycolysis that catalyzes the shift of the phosphoryl group in the conversion of 3-phosphoglycerate into 2-phosphoglycerate (7, 32). Considerable experience has been accumulated with spectroscopic examinations in patients with respiratory chain defects. This includes the NADH-Q reductase deficiency, repeatedly attributed to a slow recovery of phosphocreatine after exercise. A deficiency of the respiratory chain complex III (= NADH-Q reductase complex) reduces the amount of phosphocreatine and inorganic phosphorus and slows the recovery of these metabolites after exercise. Improvement of the symptoms after administration of vitamin K3 and vitamin C, which replace the lacking reductase complex, can be documented spectroscopically (2). Other types of mitochondrial myopathies show abnormalities that include a decreased ratio of phosphocreatine phosphorus to inorganic phosphorus, or increased inorganic phosphorus, or both, observed in the spectrum at rest and after prolonged exercise-induced acidosis. Our extensive investigations with mitochondrial encephalomyopathies have produced variable results with MR spectroscopy. Exercise spectroscopy was found to be far superior to rest spectroscopy, which only showed a slightly lower phosphocreatine peak. Exercise spectroscopy could demonstrate myopathic changes with extraordinary sensitivity. The main findings in these patients are a delayed and incomplete decline of phosphocreatine during exercise and a slow recovery rate as well as the failure of a pH drop and the tendency to develop an alkalosis. The spectroscopic findings correlated with the severity of the disease and were as sensitive as clinical tests (22). The muscular dystrophies of Duchenne, WerdnigHoffmann and Kugelberg-Welander have been investigated by MR spectroscopy. An analysis of the metabolites measured spectroscopically reveals low PCr/NTP and PCr/Pi ratios, an abnormally high pH and a pathologically increased phosphodiester (PDE) peak. This PDE peak increased further during muscle exercise. Various forms of myositis have been investigated by H– 1 and P– 32 spectroscopy (37). H– 1 spectroscopy provides information about the relative distribution of fat and water. Normal leg muscle contains 5–7% fat and the peaks of the fatty acids are difficult to identify on H– 1 spectroscopy performed without water suppression. Consequently, no marked changes in the fat and water peaks are seen in acute myositis. However, the T1 relaxation times, which correspond to inflammatory and edematous tissue changes, are moderately prolonged. Chronic myositis contains areas of fatty muscular degeneration, in addition to a H– 1 MR spectrum with mono- and polyunsaturated fatty acids at 5.4 ppm, with carbonyl groups at 2.3 ppm and terminal methyl groups at 1.1 ppm. In patients with acute myositis, the P– 31 spectrum shows a definite decrease in phosphocreatine relative to NTP, a normal range of the inorganic phosphate and added peaks of phosphomonoester and phosphodiester. These lines may represent phosphorylated sugars, which are metabolized in the anaerobic pathway of the glycolysis. The decrease in phosphocreatine indicates its increased hydrolysis during the synthesis of ATP. In chronic myositis, all phosphorylated metabolites are markedly decreased and the spectrum appears normal on first sight, but inorganic phosphate has essentially maintained its normal peak and, taking this into consideration, the ratio of inorganic phosphate to constant ß-NTP has increased. The decreased signal of the phosphorylated compounds is proportional to the extent of the muscular degeneration, but independent of the underlying aberration. Fig. 10.2a–l provides a schematic illustration of the cross-sectional anatomy of the extremities. The fasciae are outlined for easy identification of the muscle compartments, which represent the spaces along which inflammatory and necrotic muscle diseases spread. The upper arm has two compartments, the flexor and extensor compartments, which are separated by the brachial intermuscular septum. The forearm has four major compartments, the posterior and anterior extensor compartment and the deep and superficial flexor compartment, created by the antebrachial fascia and the interosseous membrane, as well as compartments for the flexor carpi ulnaris and for the flexor carpi radialis. The thigh has three major compartments, the flexor, extensor, and adductor compartment, divided by the intermuscular septa of the fascia lata. The sartorius muscle compartment is demarcated by the vastoadductorial membrane. The lower leg has four compartments: the deep and superficial flexor compartments, the anterior extensor compartment, and the peroneus compartment. These are formed by the crural fascia and its transverse intermuscular septum, anterior and posterior intermuscular septum, and the interosseous membrane. The coloring of the muscles in Figs. 10.2a–l indicates the innervation and is explained below each cross-sectional diagram. In this way, the nerve supplying each muscle can easily be determined. This facilitates the distinction between neuropathy on the one hand and inflammatory myopathy on the other hand by assigning the signal changes either to a muscle compartment (the spread of inflammations and necrosis) or to the innervation territory of a particular nerve. In the striated skeletal musculature, two different types of fibers can be distinguished: • Type I fibers, rich in mitochondria • Type II fibers, low in mitochondria Type I Fibers. These are designed for slow contractions over an extended period of time. They obtain their energy through oxidation and are macroscopically red because of a high concentration of mitochondria (Fig. 10.3a). Because of a dense internal structure, they are believed to have a relatively high water content. MRI shows muscles dominated by type I fibers with a relatively high signal intensity on T2-weighted images (11). Fig. 10.2a–l Cross sections of arms and legs to illustrate the muscle anatomy as seen on MRI. The muscle fasciae, which present potential spaces for the spreading of inflammatory changes, are outlined. Color coding of muscles with the same innervation to facilitate recognizing signal alterations secondary to impaired innervation (modified after Möller, T.B., E. Reif, MR Atlas of the musculoskeletal system. Blackwell, Wissenschaft, Berlin 1993). Type II Fibers. These are designed for rapid, short, and strong contractions. They obtain their energy primarily from anaerobic glycolysis and appear macroscopically white because of a sparse internal structure (Fig. 10.3b). On T2-weighted images, type II fibers have a lower signal intensity than the type I fibers. In other animals, MRI reveals distinct differences between the fiber types. In humans, the signal differences between specific muscles of different fiber composition within the same individual are less pronounced since the different fiber types are intermingled. Distinct differences, however, are encountered between individuals. Certain muscles of high endurance athletes, such as marathon runners, have a high proportion of type 1 fibers, while peak performance athletes, such as 100 meter sprinters, have predominantly type II fibers. A significant correlation has been found between MR relaxation time and muscle fiber composition (23). Normal muscle has a low signal intensity on T1- weighted images, with a similarly low signal intensity on the T2-weighted images, irrespective of the dominating fiber type of the muscle. Fibrous septations are displayed as signal voids. On fat-suppressed images, the normal musculature shows a higher signal intensity. In healthy subjects, physiologic muscle activity induces increased perfusion of the musculature and a rise in the extracellular free water, increasing the signal intensity on the T2-weighted images. The intensity of the signal increase depends on the type and duration of the exercise and ranges between 20 and 40% of the baseline value. Within 45–50 minutes after the end of exercise, the signal intensity normalizes with a short recovery period, probably representing the rapid normalization of vascular flow, and a slower second component related to the disappearance of extracellular water (21) (Fig. 10.4). When evaluating increases in signal intensity induced by physiologic exercise allowance must be made for variations in the functional anatomy of the muscle groups in question. For instance, it has been shown that 25% of subjects investigated do not use the flexor digitorum superficialis for digital flexion, but they do use it for carpal flexion. Following hand grip exercises, all the subjects investigated had increased signal intensity in flexors digitorum superficialis and profundus along with the flexor carpi ulnaris, but only 50% of them had increased signal intensity in extensor carpi ulnaris and supinator (8), indicating that exercise-induced increases in signal intensity can display a variable signal pattern. In view of the physiologic phenomena described, MRI performed for the detection or characterization of myopathies should not be preceded by athletic activities. Otherwise, physiologic increases in signal intensity might be mistaken for a pathologic muscle edema. Fig. 10.3a, b Types of muscle fibers, electron microscopy (from 28).a Type I, so-called red or dark muscle fiber, rich in large mitochondria.b Type II, light or white, mitochondria-deficient muscle fiber. The muscle disorders and diseases can produce certain basic patterns on MRI (Fig. 10.5): • normal, • hypertrophy, • hypotrophy, • atrophy, • pseudohypertrophy, • edema, • necrosis, • fibrosis. Recognizing such muscle changes can be relevant for planning a biopsy and for monitoring the course of therapy. However, a specific diagnosis is often unattainable on MRI findings alone. Aside from recognizing the basic MRI pattern, it is necessary to determine whether the process is: • focal, multifocal or diffuse, • proximal, distal or bilateral, • symmetric or asymmetric, or • follows a centrifugal or centripetal progression. Enlargement of the muscle cell, for instance through increased exercise, leads to hypertrophy. The diameter of the muscle increases without a corresponding visible alteration of the signal intensity on MRI. The intermuscular connective tissue layers are decreased in thickness, causing the intramuscular fat lines to be barely discernible. Endocrine ophthalmopathy produces the finding of extraocular muscular hypertrophy on MRI. Other examples are hypertrophy of the muscles of mastication due to teeth grinding (34) and alterations of the muscle due to hypothyroidism (11). Fig. 10.4 T2 relaxation times of the deep and superficial flexors digitorum after hand grip exercises for 5 minutes. Rapid increase of the T2 time within the first minute after termination of the exercise (exceeding 40%). Two phase decline in the recovery phase: rapid initial normalization (improvement of hyperemia) and slow normalization in the late phase (resorption of extracellular water) until 50 minutes after termination of the exercise (after 21). Diminution of the muscle cell secondary to decreased activity leads to hypotrophy. The diameter of the muscle is decreased but the musculature exhibits a normal signal intensity. Intermuscular connective tissue spaces are increased and filled with fat. MRI, especially the T1- weighted image, shows an increase in high signal stripes within the muscle. Fig. 10.5 MRI visualization of patterns of healthy and pathologic musculature on T1-weighted and T2-weighted images. Numerous diseases and inactivity lead to the image of atrophy, with a markedly decreased cross section of the muscle. The inter- and intramuscular deposition of fat is increased, producing a diffuse to multifocal patchy increase in signal intensity on the T1-weighted and T2-
Introduction
Examination Technique
Specific MR Spectroscopy of the Muscles
 Basics of Energy Metabolism of the Muscles
 MR Spectroscopy of Muscular Energy Metabolism
McArdle Syndrome
Phosphofructokinase Deficiency
Respiratory Chain Defects
Mitochondrial Myopathies
Muscular Dystrophies
Myositis
Anatomy
 General Anatomy
 Specific MRI and Functional Anatomy

MRI Pattern of Muscular Lesions
 Hypertrophy
 Hypotrophy
 Atrophy
![]()
Stay updated, free articles. Join our Telegram channel


Full access? Get Clinical Tree


