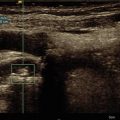
Fig. 6.1
Grayscale longitudinal image (right) of normal relaxed rectus femoris muscle. At sonoelastography (left), the muscle appears as a mosaic of intermediate stiffness green color with scattered softer (red) areas near muscle boundaries (ribbed elastic appearance)


Fig. 6.2
(a) Grayscale axial scan (left) of the anterior rectus femoris shows a normal muscle aspect; at sonoelastography (right), an altered intrinsic elasticity with intramuscular stiffer areas (blue dot arrow) mixed with softer ones (red dot arrow) in patient with anterior thigh pain without trauma. (b) Contralateral healthy side. (c) MRI: SET2W and fat suppression images show a normal muscle aspect

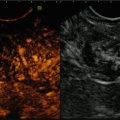
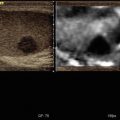
Fig. 6.3
(a) Grayscale axial images of the semimenbranosus and semitendinosus muscle (right): a post-traumatic intramuscular hyperechoic longitudinal area and corresponding elastogram (left) in neutral thigh position. The presence of a red oblique area between the muscles means a partial fluid collection. (b) Axial T2 W: fluid collection well defined with MRI

Fig. 6.4
(a) Grayscale axial image (left): partial quadriceps muscular rupture 10 days after trauma which appears like a hypo-anechoic round area; on the right a very soft aspect of the hemorrhage. (b) The contrast-enhanced US (CEUS) evidences the muscular lesion like a black round area without vascularization. (c) The lesion after 1 month appears stiff (green/blue) at sonoelastography due to the reparative process

Fig. 6.5
(a, b) Grayscale axial (a) and longitudinal (b) images of the rectus femoris muscle (left): a post-traumatic intramuscular anechoic interfascial area. The corresponding elastogram (right) in neutral thigh position shows a red soft area that means a fluid interfascial collection and a soft aspect of the muscle because of the hemorrhage. (c) The MRI axial T2 fat suppression image confirms the interfascial liquid and the intramuscular hemorrhage

Fig. 6.6
Grayscale longitudinal images (right) of rectus femoris detachment; at elastosonography (left) very soft aspect of the hemorrhage in the distal portion of the muscle

Fig. 6.7
(a) Axial grayscale (left) and sonoelastography (right) scan in patient with a fibrosis scar of the medial gastrocnemius muscle: the lesion appears hypoechoic at grayscale and blue like a stiff area at sonoelastography. (b) The MRI shows a fibrous tissue in SET2W and fat suppression images

Fig. 6.8
Grayscale axial view (left) of the tibial anterior muscle which appears hyperechoic in patient with traumatic denervation; at elastosonography (right) shows a complex aspect characterized by an increase elasticity in the superficial region and low elasticity in the deep portion due to the fibrosis

Fig. 6.9
(a, b) Grayscale longitudinal (a) and axial (b) scan of fluid homogeneous post-traumatic subcutaneous collection in the anterior tibial region on the left. At the sonoelastography (right), the collection appears as a typical red-green-blue aspect, like a cyst lesion. (c, d) Coronal T2FS (c) and axial T2 (d) view confirm the fluid collection

Fig. 6.10
(a) Grayscale longitudinal image of the normal anterior tibial tendon (right) and corresponding elastogram (left) in neutral ankle position. The tendons appear homogeneously stiff (green-yellow), with no distinct soft (red) areas. (b) Grayscale longitudinal image of the normal Achilles tendon (left) and corresponding elastogram (right) in extension position. The tendons appear homogeneously stiff (green/blue)

Fig. 6.11
Post-traumatic hypoechoic subcutaneous area in grayscale (left), at sonoelastography soft aspect of the hemorrhage near the Achilles tendon that is normal (right)

Fig. 6.12
Grayscale longitudinal image of the anterior tibial tendon (right) and corresponding elastogram (left) in neutral ankle position. Clinically the patient had difficulty to dorsiflexion. The tendon appears enlarged and inhomogeneous in grayscale with a prevalence of blue and green area with few red spots in superficial portion during the elastography: soft area alternating with areas of low elasticity which demonstrate small partial-thickness tear in tendinosis

Fig. 6.13
Bis Longitudinal RTSE scan in patient with Achilles tendinopathy shows distinct superficial intratendinous softening and blue areas of reduced elasticity in the medial and deep portion (right)

Fig. 6.14
(a) Grayscale sonographic image reveals swelling and intratendinous hypoechogenicity in common extensor tendon origin in patient with lateral elbow pain. (b) Color Doppler sonographic image shows increased vascularity epicondylitis. (c) MRI T2 FS coronal view shows a hyperintensity area in the proximal insertion of the common extensor tendon. (d) The elastosonography reveals a diffuse red-coded area in symptomatic common extensor tendon

Fig. 6.15


(a) Longitudinal grayscale of the patellar tendon: the tendon appears thick and inhomogeneous with a small calcification in the proximal deep portion. (b) At the elastosonography the tendon reveals homogeneous increased elasticity in case of tendinopathy. (c) MRI sagittal view T2FSW (d) and T1SEW (c) images shows high signal intensity at the enthesis due to tendinosis
Related posts:
Stay updated, free articles. Join our Telegram channel
Full access? Get Clinical Tree
