Fig. 11.1
Acute spondylitis. Unenhanced sagittal T1- (a), T2-weighted (b) and STIR (c) MRI images show triangular abnormality at the upper anterior corner of the L2 vertebral body (arrowheads), with low T1-, high T2-and STIR signal intensity consistent with the presence of bone marrow oedema (focal osteitis). In the same patient, a latero-lateral radiograph (d) shows corresponding sclerotic marginal irregularity (arrowhead)
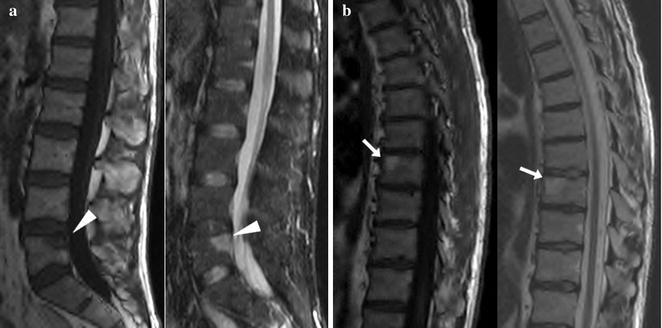
Fig. 11.2
Mixed acute and chronic spondylitis changes. Unenhanced sagittal T1- (a) and STIR (b) MRI images of the lumbar spine, respectively, show hypo- and hyperintense signal abnormalities (arrowheads) at the upper posterior corner of the L5 vertebral body, indicating the presence of bone marrow edema and consistent with active spondylitis. In the same patient, T1- (c) and T2-weighted (d) MRI images of the dorsal tract show hyperintense signal in both sequences (arrows) at an upper anterior vertebral body corner, indicating adipose bone marrow replacement and consistent with chronic spondylitis
Alternatively, the inflammatory (non-infectious) spondylodiskitis or Andersson lesion is observed in 33 % of patients with SpA, and characterized by hemispherically shaped BME signal abnormalities along two facing vertebral endplates [4]. Although less common, other possible imaging appearances of enteropathic SpA include arthritis of the synovial joints of the column, characterized by the presence of BME in the facet, costovertebral or costotransverse joints, and enthesitis of the spinal ligaments heralded by high STIR signal intensity and contrast enhancement at the insertion sites of the supraspinous and interspinous ligaments [14].
In later stages of the spinal inflammatory process, BME changes along somatic edges undergo adipose degeneration, leading to a hyperintense appearance on both T1- and T2-weighted sequences with corresponding hypointensity with fat suppression techniques. This post-inflammatory fatty bone marrow replacement is consistent with chronic spondylitis (Fig. 11.2b). Furthermore, these deposits are strongly predictive of the formation of syndesmophytes. In fact, this phase coincides with the initial radiographic appearance of syndesmophytes, which represent newly formed thin, vertically oriented bony structures at the level of the vertebral bodies corners at the edge of the disks. Finally, in more advanced phases sclerosis, new bone formation and ankylosis may develop. The appearance of bone marrow adipose deposition and of bony bridges across the intervertebral disk represents spinal ankylosis in long-standing disease [4, 13, 14].
11.2.2 Sacroiliac Joints
Predominantly composed of fibrous connective tissue with very little synovial fluid, the sacroiliac joints are considered enthesis, and as such are characteristically involved in axial SpA [15].
Although plain radiographs are usually obtained as the initial imaging test, their role is limited to the assessment of mineral and cortical bone changes. On the other hand, MRI allows visualizing the cartilage and bone marrow changes. Similarly to the spine, MRI is superior for the assessment of active inflammatory changes, making it possible to diagnose sacroiliitis earlier, before definite joint degeneration becomes radiographically visible. As such, MRI of the sacroiliac joints is necessary to confirm acute involvement, and to assess post-treatment modifications [13, 15].
A typical MRI acquisition protocol should include T1-weighted and STIR images along the proper oblique-coronal plane and oblique-axial T1- and T2-weighted images, oriented, respectively, parallel and perpendicular to the main longitudinal axis of the sacroiliac joints.
Either uni- or bilateral, inflammatory changes of the sacroiliac joints are detected by MRI with imaging findings that closely resemble those described in the spine. Early, active sacroiliitis is heralded by the MRI identification of BME on the subchondral bone, which appears as a circumscribed periarticular area of low T1-, high T2- and STIR signal intensity (Fig. 11.3). Initially, BME can be found on the iliac or sacral side only, but typically becomes bilateral and symmetric on both sides of the involved joint, and characteristically located at its lower and posterior thirds. When unilateral, differentiation from infectious sacroiliitis may be challenging. Stronger STIR hypersignal more likely reflects pronounced disease activity, and active subchondral bone changes are seen to enhance when fat-saturated T1-weighted images are acquired after intravenous contrast [4, 16].
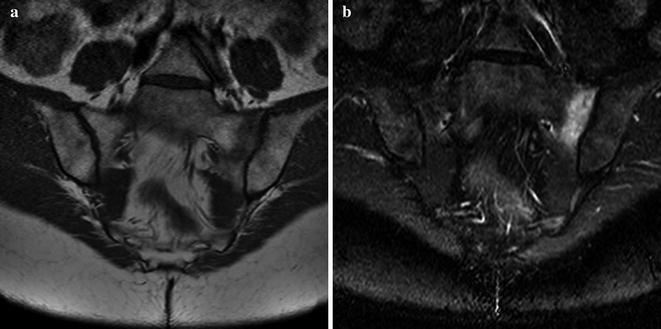
Fig. 11.3
Acute sacroiliitis. Unenhanced oblique coronal T1-weighted (a) and STIR (b) MRI images show extensive hypo– and hyperintense signal subchondral band abnormality along the sacral aspect of the left sacroiliac joint, indicating the presence of bone marrow edema from active inflammation
Later in the course of the disease, inflammation subsides and progressive post-inflammatory fatty marrow degeneration occurs, which appears hyperintense on both T1- and T2-weighted sequences with signal drop on fat-suppressed images (Fig. 11.4a, b). Furthermore, chronic sacroiliitis includes subchondral sclerosis on both iliac and sacral surfaces that is depicted with low signal intensity and without enhancement, and typically extends at least 5 mm from the articular surface. Isolated or confluent erosions may be identifiable, represented by bony defects with low signal intensity on T1-weighted images on the articular surface. Finally, joint space narrowing develops, ultimately leading to articular fusion. Whereas cortical bone changes and the joint space are better depicted by computed tomography (CT), ankylosis of the sacroiliac joints is exquisitely diagnosed at MRI when bridging bone marrow is seen between the fused iliac wing and sacrum (Fig. 11.4c, d) [4].
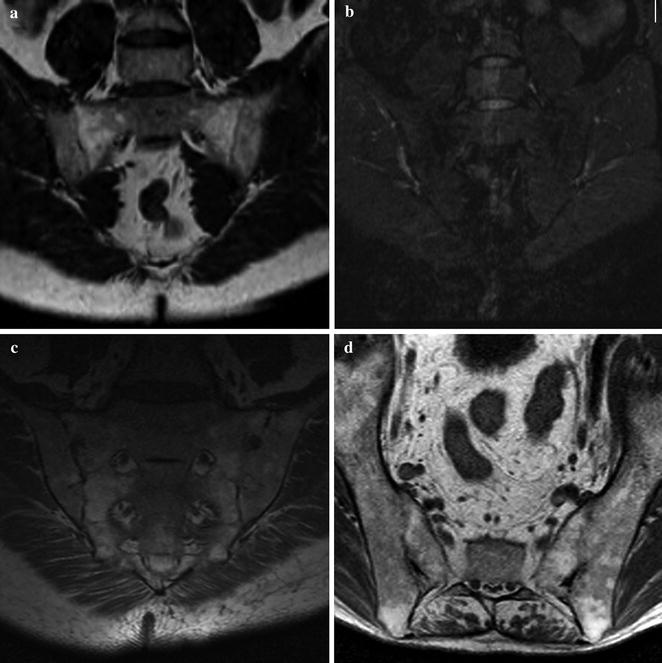
Fig. 11.4
Chronic sacroiliitis. Unenhanced oblique coronal T1-weighted (a) and STIR (b) MRI images show extensive T1-hyperintense bone marrow signal changes in both sacral wings, with corresponding low signal intensity with fat suppression, consistent with adipose marrow replacement. The sacroiliac joint spaces are narrowed. In a different patient, oblique-coronal (c) and axial (d) T1-weighted images show similar extensive adipose bone marrow changes along both lateral aspects of the sacrum, whereas the joint space is occupied by bridging bone marrow indicating ankylosis
11.3 Imaging Axial Arthropathy with Conventional Radiology
As discussed earlier in this chapter, plain radiographs have limited diagnostic value in the early stages of axial SpA.
11.3.1 Spine
Related posts:
 Introduction
 Surgical Perspective on Perianal Complications in Ulcerative Colitis
 Magnetic Resonance Imaging of Ulcerative Colitis
 Water Enema Multidetector CT Colonography: Technique, Role and Imaging Findings in Ulcerative Colitis
 Imaging of Perianal Inflammatory Disorders in Ulcerative Colitis
 Ileal Pouch-Anal Anastomosis Surgery: Surgical Techniques
Stay updated, free articles. Join our Telegram channel

Full access? Get Clinical Tree


