Fig. 1
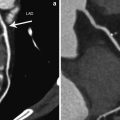
A 72-year-old female with unstable angina. a Adenosine-stress 64-slice multidetector CT shows subendocardial perfusion defects in the septum and inferior wall (arrows). b Rest image shows no perfusion abnormalities. c, d Curved multiplanar reconstruction images show multiple stenoses in the right coronary artery (RCA) and calcifications in proximal-to-mid left anterior descending branch (LAD). e, f Catheter coronary angiography revealed focal tight stenosis in distal RCA (arrow), severe stenosis in proximal-to-mid LAD (arrows) and obtuse marginal branch (arrowhead)
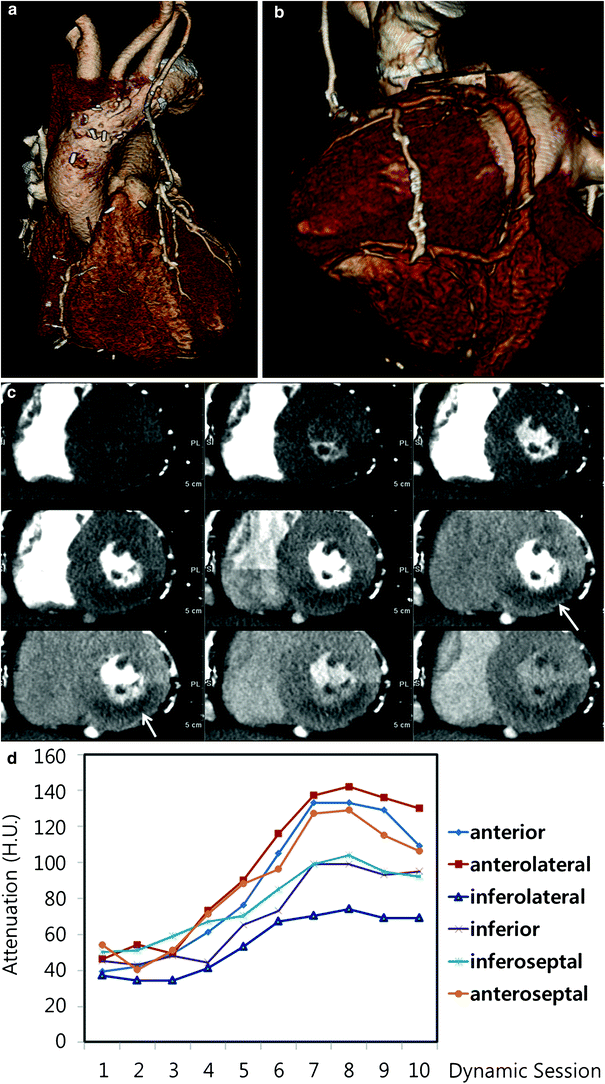
Fig. 2
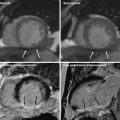
Silent ischemia in 67-year-old male with coronary bypass grafts. a, b Coronary bypass grafts are seen patent with good anastomosis. c However, stress dynamic perfusion CT shows perfusion defects (arrows) in inferior wall without myocardium thinning. d Time-attenuation curve shows significant attenuation difference between anterior and inferolateral walls of the left ventricle
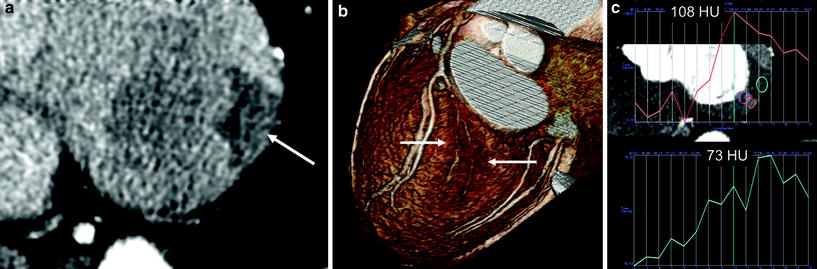
Fig. 3
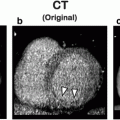
Dynamic scan helps to diagnose a small branch lesion (silent ischemia in a 74-year-old male). a In this asymptomatic male with vascular occlusive disease, there was clearly visible myocardial ischemia in the basal inferolateral wall (arrow) due to occlusion of distal circumflex and obtuse marginal branches. b The small branch occlusion was overlooked on CT analysis, initially. In retrospect, volume-rendered image also showed evidence of ischemia with a darker color (arrows). c The peak attenuation number in the perfusion defect was 73 HU and that of normal area was 108 HU
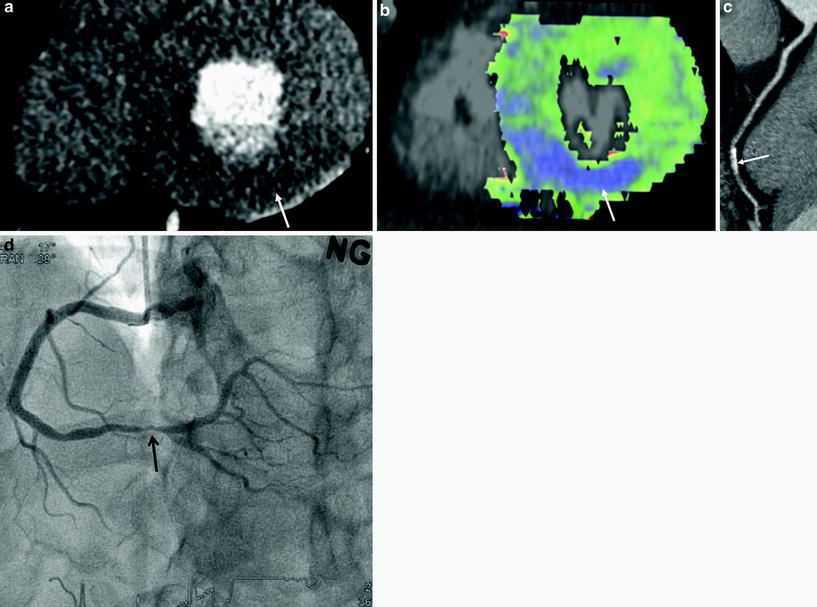
Fig. 4
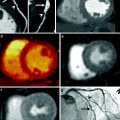
A 55-year-old male with chest pain. a, b Short-axis reformatted stress perfusion CT (a) and flow map image (b) show decreased perfusion (arrow) in inferior wall. Myocardial blood flow measured 40–47 mL ⋅ 100 mg−1 min−1 in inferior wall and 86 mL ⋅ 100 mg−1 min−1 in normal myocardium. c Curved planar reformatted image shows calcifications in the distal right coronary artery. The degree of stenosis was uncertain. d Catheter angiogram shows severe stenosis (arrow) in distal right coronary artery
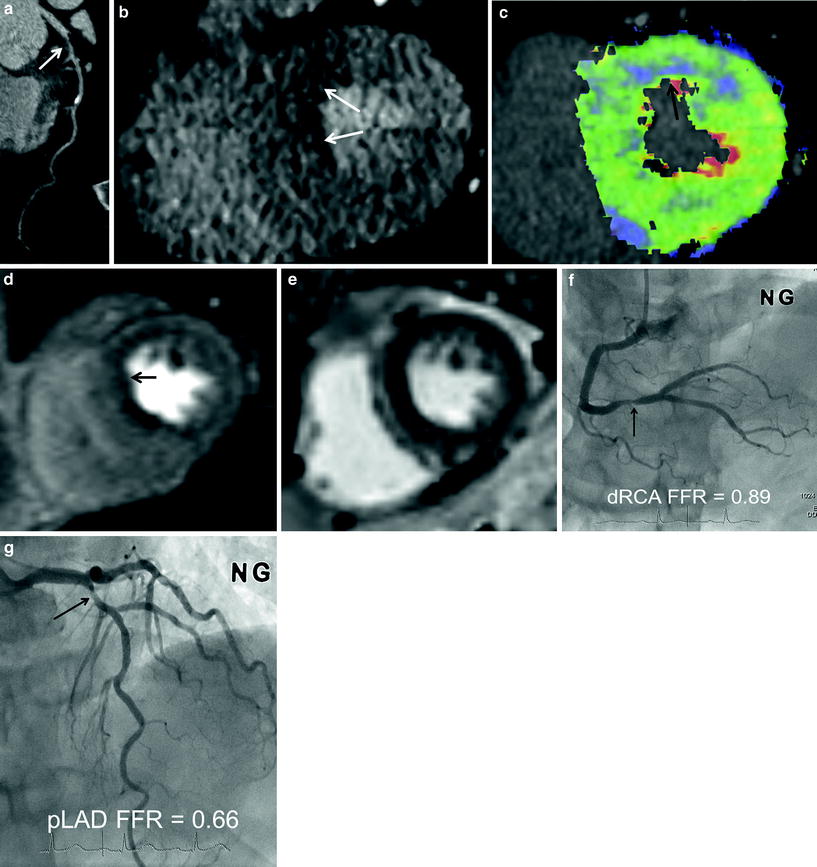
Fig. 5
A 74-year-old male with angina. a CT angiography shows intermediate degree stenosis (arrow) in the proximal left anterior descending branch (LAD) due to soft plaques. b–e CT perfusion reformatted images (b) and flow map images (c) show subendocardial perfusion defects (arrows) in anteroseptal wall. Myocardial blood flow measured 42 mL ⋅ 100 mg−1 min−1 in anteroseptal wall and 113 mL ⋅ 100 mg−1 min−1 in normal area. Stress MR perfusion image (d) shows perfusion defects (arrow) in the same region. There was no evidence of old myocardial infarction on late gadolinium-enhanced MR images (e). f, g Adenosine fractional flow reserve was 0.89 in distal right coronary artery (f) and 0.66 in proximal LAD (g). Percutaneous coronary intervention was performed in LAD only
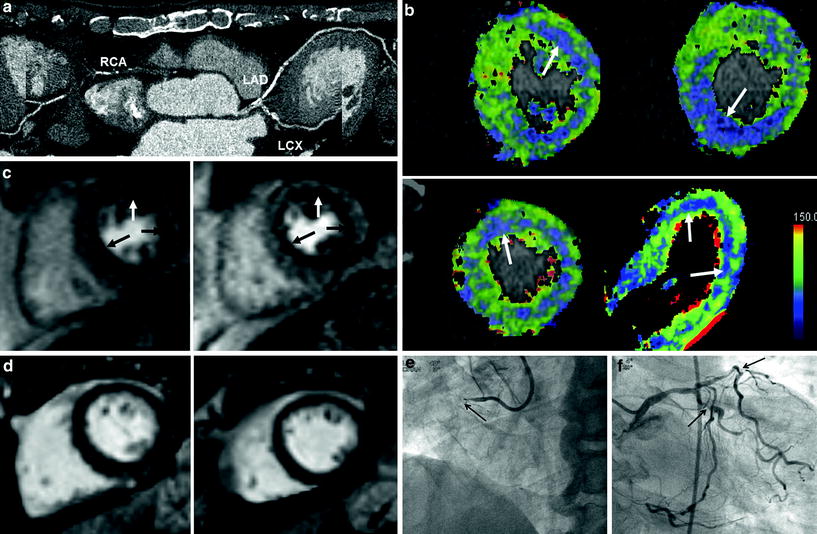
Fig. 6
Three-vessel disease with multisegment perfusion defects (70-year-old male with chest pain). a CT angiography shows dense calcifications in left main coronary artery, left anterior descending branch (LAD), circumflex artery (LCX), and occlusion in right coronary artery (RCA). b CT perfusion flow maps show decreased perfusion (arrows) in three-vessel territories. Myocardial blood flow measured 43–68 mL ⋅ 100 mg−1 min−1 in the areas with decreased perfusion. c Stress MRI perfusion shows subendocardial perfusion defects (arrows) in three-vessel territories. d Late gadolinium-enhanced MR images show no evidence of myocardial infarction. e, f Catheter angiography shows occlusion of proximal right coronary artery (arrow) (e) and severe stenosis in proximal segments of left anterior descending branch and circumflex artery (arrows) (f)
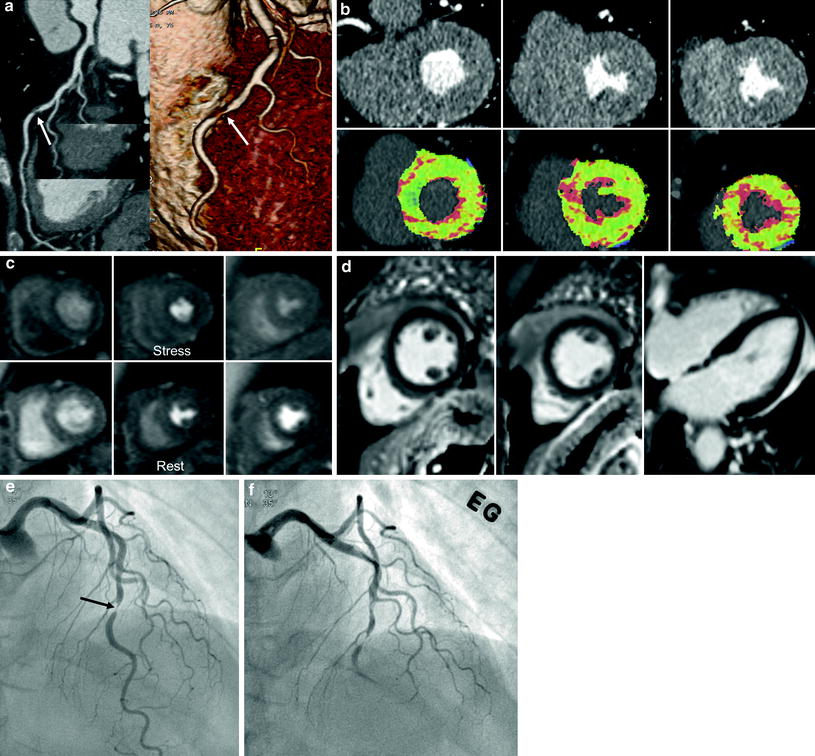
Fig. 7
A case with anatomy-physiology discrepancy (55-year-old female with chest pain). a CT angiography shows focal significant stenosis (arrows) in mid-left anterior descending branch (LAD). b CT perfusion reformatted and flow map images show no evidence of myocardial ischemia during stress. Myocardial blood flow measured 128 mL ⋅ 100 mg−1 min−1 overall. c There was no evidence of significant perfusion defects on stress and rest perfusion MR images. d Late gadolinium-enhanced images show no myocardial infarcts. e, f Catheter angiograms show a tight stenosis (arrow) in mid LAD (e) and spasm was induced in the LAD on intraarterial ergonovine injection (f)
The targets of adenosine CTP can be heavily calcified lesions, coronary artery stents, or multiple lesions with moderate to severe stenosis. In patients with small branch stenosis or occlusion, it may be difficult to assess the degree of stenosis of the involved vessel segments by CCTA. However, CTP may perform better in identifying perfusion abnormalities than CCTA, providing better detection of small branch lesions (Fig. 3). Therefore, CTP provides incremental values to the diagnostic accuracy of CCTA, beyond exclusion of significant CAD; patient-specific stenosis can be assessed for lesion-specific ischemia (Koo et al. 2011). In this way, the CTP technique may expand the clinical indications for CCTA.
3 MRI Perfusion and Coronary CT Angiography: Insights from the Combined Approach
According to a meta-analysis (Hamon et al. 2010), the overall patient-based analysis of stress myocardial perfusion MRI demonstrated a sensitivity of 89 % (95 % CI: 88–91 %) and a specificity of 80 % (95 % CI: 78–83 %). Stress perfusion MRI is highly sensitive for detection of CAD, but its specificity remains moderate.
MR-IMPACT II study showed that the sensitivity of MRP to detect CAD was superior to SPECT, while its specificity was inferior to SPECT (Schwitter et al. 2012). For MRI and SPECT, the sensitivity scores were 67 and 59 %, respectively, while the specificity scores for MRI and SPECT were 61 and 72 %, respectively.
MRI can be used to detect flow-limiting CAD as defined by FFR, using both visual and quantitative analyses. The sensitivity and specificity of visual MRP analysis to detect stenoses at a threshold FFR of <0.75 were 82 and 94 % (P < 0.0001), respectively, with an area under the receiver-operator characteristic curve of 0.92 (P < 0.0001) (Lockie et al. 2011). In the vessels interrogated with FFR, CCTA had a sensitivity, specificity, PPV, and NPV of 93, 60, 68, and 90 %, respectively (Ko et al. 2012a). Quantitative cross-sectional parameters of the coronary lesions derived from 64-slice CCTA are significantly correlated with functional assessment by invasively determined FFR (Kristensen et al. 2010). According to a study of 42 patients, the optimal cut-off value to predict an abnormal FFR (<0.75) was 73 % for area stenosis of CCTA (sensitivity 90 %, specificity 80 %, PPV 50 %, and NPV 97 %) and 56 % for diameter stenosis of CCTA (sensitivity 80 %, specificity 67 %, PPV 35 %, and NPV 94 %), respectively (Kristensen et al. 2010). A CCTA minimal lumen diameter cut-off value of 1.2 mm had a sensitivity of 70 % and specificity of 72 %, while a CCTA minimal lumen area cut-off value of 2 mm2 had a sensitivity of 80 % and specificity of 78 %. According to a CCTA-FFR comparison study, 25.5 % (12/47) of lesions with 50–69 % stenosis severity by CCTA caused ischemia, as determined by an FFR ≤0.80 (Koo et al. 2011).
According to Kirschbaum et al. (2011), MRP contributes significantly to the detection of functional significant lesions in patients with a positive CCTA. MRP and coronary flow reserve (CFR) were performed in 50 patients with significant CAD by CCTA. MRP showed reduced perfusion in 32 patients (64 %), and this finding was confirmed by CFR in 27 (84 %). All 18 cases of normal MRP (36 %) were confirmed by CFR. Of the 50 patients, 20 (40 %) had multivessel disease, with MRP showing a reduced perfusion index (MPRI < 2.0) in multiple perfusion territories in 15 patients. In the remaining five patients, multivessel disease was ruled out, which was confirmed by CFR. Pretest probability of a reduced CFR in patients with a positive CCTA was 54 % (27/50). The posttest probability after MRP was 84 %. The investigators of this study proposed an algorithm with CCTA as a first-line diagnostic test followed by MRP in patients with a positive CCTA.
In a study by van Werkhoven et al. (2010), normal perfusion on MRI was observed in 33 % (5/15) of patients with significant obstructive CAD on CCTA. The majority of patients (83 %) were presented with an intermediate pretest likelihood of CAD. In all patients without significant stenosis on CCTA and normal perfusion on MRI (n = 29), significant stenosis was absent on invasive coronary angiography (ICA). All patients with abnormalities on both CCTA and MRI (n = 10) had significant stenoses on ICA. The anatomical and functional data obtained with CCTA and MRI is complementary for the assessment of CAD. These findings support the sequential or combined assessment of anatomy and function (van Werkhoven et al. 2010).
According to Groothuis et al. (2010), the combination of both techniques enabled the clinician to evaluate both the morphology and functional relevance of CAD—comprehensively and noninvasively. Of patients without CAD on CCTA, 90.5 % (57 of 63; 95 % CI: 82.6–95.0 %) had normal myocardial perfusion on MRP. Myocardial ischemia was detected by MRP in 42.3 % (22 of 52; 95 % CI: 29.5–56 %) of patients with obstructive CAD on CCTA. Thus, CCTA can reliably rule out CAD, but detection of hemodynamically significant CAD is limited. In patients with known CAD, myocardial perfusion imaging may be more appropriate than CCTA as a first-line technique. SPECT is the modality most commonly used to assess myocardial perfusion; however, due to the increased radiation burden, SPECT might not be the ideal additional functional modality used along with CCTA to evaluate patients suspected of having CAD. According to a SPECT–CCTA comparison study by Schuijf et al. (2006), of 40 patients and 62 vessels with obstructive CAD at CCTA, SPECT findings were normal in 20 patients (50 %) and 38 vessel territories (61 %).
However, according to Scheffel et al. (2010), all tested combinations of low-dose CCTA and MRP, with or without late gadolinium enhancement, were unable to improve the diagnostic performance over that of low-dose CCTA alone. Using ICA as the gold standard, low-dose CCTA outperforms MRI with regard to sensitivity and NPV, whereas MRI is more specific and has a higher PPV than low-dose CCTA.
4 Clinical Results for Adenosine-Stress Myocardial Perfusion CT
Recent literature has shown the potential advantage of MDCT for CCTA during adenosine-stress (Bamberg et al. 2012; Bastarrika et al. 2010; Bettencourt et al. 2011; Cury et al. 2011; Feuchtner et al. 2011; George et al. 2009; Ho et al. 2010; Ko et al. 2011, 2012a, b; Nagao et al. 2011; Rocha-Filho et al. 2010; Ruzsics et al. 2009; Tamarappoo et al. 2010; Wang et al. 2012; Weininger et al. 2010) (Table 1). The feasibility of adenosine-stress CT has been documented by George et al. (2006) in an experimental animal model. According to Rocha-Filho et al. (2010), adenosine-stress perfusion imaging (single static scan) in addition to 64-slice dual-source CCTA demonstrated improved sensitivity, specificity, PPV, and NPV of CCTA for CAD diagnosis (83–91, 71–91, 66–86, and 87–93 %, respectively).
Table 1
Diagnostic accuracy and radiation dose of combined coronary CT angiography and CT perfusion according to each scan protocol in the diagnosis of significant coronary artery stenosis with myocardial ischemia
Authors/year | Number of patients | Scanner type | Reference standard | Protocol | Diagnostic parameters (added value with CTP) | Radiation dose (mSV) | |||||
|---|---|---|---|---|---|---|---|---|---|---|---|
Sensitivity (%) | Specificity (%) | PPV (%) | NPV (%) | CTP | CCTA | Total | |||||
Bamberg et al. 2011 | 33 | 128 ds | ICA (≥50 %) | P-CCTA, D-CTP | 91 | 69 | 79 | 85 | 10.0 | 3.1 | 13.1 |
FFR (≤0.75) | 93 (−7) | 87 (36) | 75 (28) | 96.7 (−3.3) | |||||||
Wang et al. 2012 | 30 | 128 ds | ICA (≥50 %) | P-CCTA, D-CTP | 90 (0) | 81 (30) | 58 (23) | 97 (2) | 11.5 | 4.0 | 15.5 |
SPECT | 85 | 92 | 55 | 98 | |||||||
Feuchtner et al. 2011 | 39 | 128 ds | ICA (≥70 %) (n = 25) | H-CTP, H- or P-CCTA | 100 (2) | 74 (47) | 97 (13) | 100 (20) | 1.1 | 1.9 | 3.0 |
MRI (1.5T) (n = 30) | 78 | 88 | 83 | 84 | |||||||
Ko et al. 2012a | 42 | 320 ss | FFR (≤0.8) | P-CTP, delay P-CCTA, rest P-CCTA | 68 (−25) | 98 (38) | 97 (29) | 77 (−23) | 6.4 | 5.8 | 13.7 |
Blankstein et al. 2009 | 34 | 64 ds | ICA (≥50 %), SPECT | R-CTP, P-CCTA, delay P-CCTA | 79 | 80 | 73 | 84 | 9.5 | 2.0 | 12.7 |
ICA (≥70 %), SPECT | 86 | 68 | 42 | 95 | |||||||
Rocha-Filho et al. 2010 | 35 | 64 ds | ICA (≥50 %) | R-CTP, P-CCTA | 91 (8) | 91 (20) | 86 (20) | 93 (6) | 9.8 | 2.0 | 11.8 |
ICA (≥70 %) | 91 (9) | 78 (14) | 53 (15) | 97 (4) | |||||||
Bettencourt et al. 2011 | 90 | 64 ss | ICA (≥50 %) | R-CTP, P-CCTA | 61 (−30) | 97 (17) | 87 (27) | 88 (−8) | 4.1 | 1.0 | 6.8 |
ICA (≥70 %) | 69 (−28) | 96 (15) | 78 (26) | 94 (−5) | |||||||
Ko et al. 2011 | 41 | 64 ds | ICA (≥50 %) (n = 41) | R-CCTA, R-E | 89 | 76 | 81 | 86 | 5.8 | 8.6 | 14.4 |
MRI (1.5T) (n = 28) | 89 | 78 | 74 | 91 | |||||||
Ko et al. 2012b | 45 | 64 ds | ICA (≥50 %) | R-CCTA, R-E | 93.2 (1.4) | 85.5 (17.8) | 88.3 (14.7) | 91.4 (3.9) | 5.7 | 10.8 | 16.5 |
Feuchtner et al. (2011) used high-pitch stress perfusion CT (single scan) in 39 patients, yielding a per-vessel sensitivity of 96 % with 88 % specificity, 93 % PPV, and 94 % NPV in the detection of perfusion defects in comparison with cardiac MRI; the per segment sensitivity was 78 % with 87 % specificity, 83 % PPV, and 84 % NPV. In 25 patients with CAD, confirmed by ICA, the addition of CTP to CCTA improved accuracy from 84 to 95 % for the detection of stenosis >70 %.
Coronary CT angiography during adenosine infusion is possible with the use of an area-detector CT (256- or 320-slice CT). Ko et al. (2012a) compared CTP with FFR in 42 patients using a 320-detector row CT scanner and prospective electrocardiography (ECG)-gating for the detection of stenosis >50 %. FFR ≤ 0.8 was considered as an indication of significant ischemia. CTP imaging correctly identified 31 of 41 (76 %) ischemic territories and 38 of 45 (84 %) non-ischemic territories. Per-vessel territory sensitivity, specificity, PPV, and NPV of CTP were 76, 84, 82, and 79 %, respectively. The combination of ≥50 % stenosis on CTA and a perfusion defect on CTP was 98 % specific for ischemia, while the presence of <50 % stenosis on CTA and normal perfusion on CTP was 100 % specific for exclusion of ischemia. Mean radiation for CTP and combined CT was 5.3 and 11.3 mSv, respectively.
Contemporary MDCT techniques enable dynamic acquisition of image data during adenosine-stress administration. According to Bamberg et al. (2010), data are acquired, alternating between two table positions, covering 73 mm during systolic phases for 30 s using 100 kVp. Radiation dose was 2.3 mSv for CCTA and 9.6 mSv for dynamic scanning. Ho et al. (2010) used this technique for myocardial perfusion imaging in 35 patients. There was a 1.5-fold difference between stress and rest myocardial blood flow (MBF) in normal tissue. In reversible defects, MBF was 0.65 ± 0.21 mL/mL/min and 0.63 ± 0.18 mL/mL/min at stress and rest, respectively. In comparison with nuclear myocardial perfusion imaging, the sensitivity, specificity, PPV, and NPV of CTP for identifying segments with perfusion defects was 83, 78, 79, and 82 %, respectively. The sensitivity, specificity, PPV, and NPV of CTP compared with ICA were 95, 65, 78, and 79 %, respectively.
Related posts:
 Time-Resolved CT Imaging of Myocardial Perfusion: Dual-Source CT
 Evaluation of the Myocardial Blood Supply: Single-Source, Single-Energy CT
 CT Angiography: State of the Art
 are We Interested in Viability?
 Time-Resolved Imaging of Myocardial Perfusion Using 256-Slice Computed Tomography
 Evaluation of the Myocardial Blood Supply: Dual-Source Dual-Energy CT
Stay updated, free articles. Join our Telegram channel

Full access? Get Clinical Tree


