Pediatric neuroimaging is a distinct subspecialty. Anatomic areas in neuroimaging include the skull, brain, orbits, face and sinuses, neck, and spine. At many children’s hospitals, dedicated neuroradiologists perform and interpret all of the neuroimaging. The large amount of information included in pediatric neuroradiology is beyond the scope of this textbook. However, this chapter is a review of some of the more commonly encountered entities.
▪ Pediatric Neuroimaging Modalities: Magnetic Resonance, Computed Tomography, and Ultrasound
In pediatric neuroimaging, magnetic resonance imaging (MRI), computed tomography (CT), and ultrasound are all used, with some overlap. In general, MRI has become the definitive test in evaluating intracranial abnormalities. It is the test of choice for evaluating brain involvement in neoplasms, vascular lesions, inflammatory processes, demyelinating disorders, metabolic diseases, and developmental abnormalities, as well as for the evaluation of neurodegenerative disorders, focal seizures, unexplained hydrocephalus, and neuroendocrine disorders. CT is typically reserved for the evaluation of trauma and acute neurologic symptoms, such as those associated with ventriculoperitoneal shunt (VPS) malfunction. Sinus disease, orbital cellulitis, temporal bones, and head and neck abnormalities are also often evaluated by CT. The use of MRI for the evaluation of VPS function and temporal bone, head, and neck abnormalities is increasing and may complement initial CT evaluation. Neck ultrasound is used for thyroid evaluation and superficial masses. Head ultrasound is reserved for evaluating premature infants and newborns.
▪ Basic Review of Advanced Magnetic Resonance Imaging Techniques in Pediatric Neuroimaging
A number of advanced MRI techniques are playing an increasing role in the neuroimaging of children. Such techniques are summarized here. Basic vocabulary is reviewed (which is half the battle). Applications in pediatric patients are also discussed.
Diffusion-Weighted Imaging
Diffusion-weighted imaging (DWI) images are determined by the variability in the diffusivity of water molecules in tissues. The random movement of water molecules is known as Brownian motion. In tissues there is variable restriction of the movement of water molecules relative to tissue structure. Pathologic states may alter the diffusion characteristics of water molecules in the brain and therefore affect the appearance of the DWI images. Images on DWI are influenced not only by diffusion of water molecules but also by other tissue properties, such as T2. To eliminate the influences on imaging appearance of factors unrelated to diffusion of water molecules, the data are processed, most commonly by using a technique called apparent diffusion coefficient (ADC) map . For each DWI sequence, two sets of images are created: the DWI images and the ADC map. In a pathologic process in which there is true restricted diffusion, the involved area appears high in signal on the DWI images and low in signal on the ADC map ( Fig. 8-1, A and B ). Conversely, in pathologic processes in which there is facilitated diffusion, signal will be low on DWI images and high on the ADC map. Due to the influences of T2 tissue properties on DWI imaging, an area of increased signal on T2-weighted sequences (including T2 fluid attenuated inversion recovery [FLAIR]) may show as increased DWI signal and not represent true diffusion restriction. In this case, signal will be normal or increased on ADC map, instead of decreased. This phenomenon is known as T2 shine-through ( Fig. 8-2, A-C ) and should not be confused with restricted diffusion.


Restricted diffusion is seen in pathologic processes that present with cytotoxic edema including brain infarct and/or ischemia, nonhemorrhagic traumatic injury, seizure-related edema, and encephalitis. Other causes of diffusion restriction include purulent fluid collections ( Fig. 8-3, A-C ), epidermoid cysts, subacute hematoma, and hypercellular tumors. Processes that show facilitated diffusion include vasogenic edema and cerebrospinal fluid (CSF) collections, such as an arachnoid cyst.

DWI has become an extremely important tool in neuroimaging. One of its major advantages is its high sensitivity for ischemia and infarction. It often reveals them before such findings are seen on conventional MR sequences. It is also helpful in differentiating among posterior fossa tumors. Hypercellular medulloblastomas have restricted diffusion, whereas low-grade astrocytomas typically do not. Restricted diffusion is also rare in ependymomas. Table 8-1 shows a glossary of terms related to DWI and diffusion tensor imaging (DTI).
Diffusion Tensor Imaging and Tractography
Diffusion is anisotropic in white matter fibers, as axonal membranes and myelin sheaths act as barriers to the motion of water molecules in directions not parallel to their own orientation. By applying diffusion gradients in multiple directions during a diffusion MRI sequence, DTI technique enables the identification of the direction of maximum diffusivity in a voxel and therefore the identification of location, orientation, and directionality of the white matter tracts. DTI provides several capabilities not previously possible. (1) Large, individual white matter tracts can be depicted as discrete anatomic structures. The three-dimensional postprocessing technique used to create such images is tractography. (2) Metrics describing the microarchitecture of tissue can be calculated. They include fractional anisotropy, mean diffusivity, radial diffusivity, and axial diffusivity.
Tractography images are typically shown in color. By convention, white matter tracts oriented left to right are shown as red, cephalocaudad as blue, and anteroposterior as green ( Fig. 8-4 ).

DTI and tractography can be used to evaluate myelination. Increased myelination increases anisotropy. Therefore, in normal infants, anisotropy increases with age. Most disease states that affect white matter decrease anisotropy. DTI has been used to evaluate stroke, hydrocephalus, trauma, and demyelinating disorders. DTI and tractography have also been used to study and depict the white matter tract abnormalities associated with congenital brain anomalies and in the presurgical evaluation of brain tumors ( Fig. 8-5 ). One important limitation of DTI-based tractography is that it underestimates the white matter tracts in parenchymal locations where there are crossing fibers. This is because a single tensor can resolve only a single fiber direction within a voxel. Recent studies have described new diffusion-based nontensor tractography techniques that demonstrate fiber tracts more accurately, but these are not yet being used in the routine clinical practices.

Perfusion
Perfusion MRI evaluates cerebral microvascular parameters, including cerebral blood volume, mean transit time, and cerebral blood flow. It relies on the use of a tracer that may be exogenous (gadolinium) in dynamic susceptibility contrast-enhanced (DSC) and dynamic contrast-enhanced (DCE) techniques or endogenous in noncontrast arterial spin labeling (ASL) technique. The main applications of perfusion MRI are evaluation of vascular pathologies (ischemic strokes, vasculopathies, vasospasm) and tumors. In the evaluation of brain tumors, perfusion may help with preoperative tumor grading and biopsy guidance by identifying high perfusion areas suspicious to represent higher grade portions of the tumor. Perfusion also plays a role in the evaluation of, tumor treatment response, and in the attempt to answer the always difficult question of tumor recurrence versus radiation necrosis.
Magnetic Resonance Spectroscopy
Proton (hydrogen) MR spectroscopy (MRS) is a tool that is used to help to characterize a number of pediatric neurologic conditions. Most often, single-voxel spectroscopy is created using a 1-cubic centimeter sample area. The results of spectroscopy are typically depicted as a spectrum, with each metabolic peak characterized by resonance frequency, height, width, and area ( Fig. 8-6 ). Metabolic profiles depicted on MR spectroscopy have been much less specific than originally hoped. However, the information obtained can provide useful information that complements the information derived from conventional MRI in many pediatric disorders, including neoplasms, hypoxic ischemic insult, and metabolic diseases.

The most commonly evaluated brain metabolites include N -acetylaspartate (NAA), creatine (Cr), choline (Cho), myoinositol (mI), and lactate (Lac) (see Fig. 8-6 ). NAA is a neuronal marker and is decreased in most disorders that decrease neuronal viability and density, such as neoplasms ( Fig. 8-7 ), infarcts, radiation injuries, and many white matter diseases. NAA is markedly elevated in Canavan disease and may also be elevated in Salla disease and Pelizaeus-Merzbacher disease. Cho compounds reflect the synthesis and degradation of cell membranes; therefore increased Cho is seen when there is high cellular turnover, as occurs with most tumors (see Fig. 8-7 ). Lactate is a product of anaerobic glycolysis, typically elevated in the setting of acute ischemia ( Fig. 8-8 ), infarction, abscess, many high-grade tumors, and some metabolic diseases, such as mitochondrial disorders. Myoinositol is considered a glial marker, elevated in gliosis and astrocytosis in pediatrics. Creatine is relatively constant; therefore it is used as an internal reference for calculation of metabolite ratios. Creatine deficiency syndromes are rare causes of decreased creatine levels. Taurine (Tau) is not a commonly seen metabolite in clinical MR spectroscopy; however, it has been shown to be elevated in medulloblastoma and therefore is an important metabolite to recognize in pediatric posterior fossa tumors (at 3.3 ppm, above baseline on short TE 30-35 and below baseline on TE 144).


There are differences in metabolite levels in the gray and white matter. The concentration of NAA in gray matter is higher than in white matter, and Cho concentration is typically higher in white matter. There are also differences in metabolite levels in the developing brain, especially during the first year of life. In the newborn period, NAA levels are low and mI and Cho levels are high ( Fig. 8-9 ). Small lactate peak can also be found in healthy newborns.

Functional Magnetic Resonance Imaging
Functional MRI (fMRI) is a noninvasive method of evaluating regional neuronal activity within the brain. Neuronal activity increases metabolic activity, which results in increased blood flow to that region and a relative increase in the ratio of oxygenated hemoglobin to deoxygenated hemoglobin. Deoxyhemoglobin is paramagnetic; therefore a change in the ratio affects the magnetic state of the tissue and, as a result, changes the local MRI signal. This phenomenon is called the blood oxygenation level-dependent (BOLD) effect. fMRI techniques show these changes superimposed on anatomic information. fMRI is used to document regional neuronal activity during a specific task. The most validated use is for localization of different body representations in the primary motor and somatosensory cortex, as well as language lateralization ( Fig. 8-10, A-F ). Clinically, fMRI has been used in the evaluation of patients with seizures and planning of surgical approaches to brain tumors. It also has been a very useful research tool in increasing our understanding of brain function. Current research is mostly focused on resting state techniques (R-fMRI), which measure BOLD fluctuations of spontaneous neuronal activity without the performance of a specific task.

▪ Neonatal Head Ultrasound
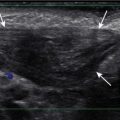
Neonatal head ultrasound is performed through the open fontanels of neonates and infants using high-frequency transducers. Images are commonly obtained in the sagittal and coronal planes via the anterior fontanel using a sector transducer ( Fig. 8-11, A and B ). Linear high-resolution transducers are used to assess the extraaxial spaces ( Fig. 8-12, A and B ) and superficial cortex. Additional images via the mastoid fontanel enable the detection of posterior fossa hemorrhages ( Fig. 8-13, A and B ) and congenital anomalies. Evaluation via the posterior fontanel can be use for differentiation of white matter injury versus anisotropy artifact in cases of abnormally increased posterior periventricular white matter echogenicity. In premature infants, head ultrasound is most commonly used to diagnose and follow up intracranial complications, such as germinal matrix hemorrhage and white matter injury of prematurity (periventricular leukomalacia). It can also be used to screen for congenital abnormalities and hydrocephalus. Another common indication is evaluation of an infant with a large head circumference.


Germinal Matrix Hemorrhage
The germinal matrix is a fetal structure that is a stem source for neuroblasts. It typically involutes by term but is still present in premature infants within the caudothalamic groove (the space between the caudate head and the thalamus). The germinal matrix is highly vascular and is subject to hemorrhaging with fluctuation in cerebral blood pressure. Germinal matrix hemorrhage most commonly occurs in premature infants during the first days after birth. Potential complications include destruction of the precursor cells within the germinal matrix, hydrocephalus, and hemorrhagic infarction of the surrounding periventricular tissues. Cerebellar hemorrhage can also be seen in very premature patients (see Fig. 8-13, A and B ).
On ultrasound, germinal matrix hemorrhage is seen as an ovoid echogenic mass within the caudothalamic groove ( Figs. 8-14, A and B , and 8-15 ). For those not well acquainted with head ultrasound, there may be confusion in differentiating germinal matrix hemorrhage from the normally echogenic choroid plexus. In contrast to germinal matrix hemorrhage, normal choroid plexus should never extend as anterior as the caudothalamic groove on a parasagittal view (see Fig. 8-11, B ). Hemorrhage may extend into the ventricular system and lead to hydrocephalus. Germinal matrix hemorrhage is categorized into one of four grades ( Table 8-2 ). Intraparenchymal hemorrhage (grade IV) is secondary to venous infarction of the deep medullary veins rather than a direct extension of hemorrhage ( Fig. 8-16 and see also Fig. 8-15 ). Grades I and II hemorrhages tend to have good prognosis. In contrast, grades III and IV hemorrhages tend to have poor prognosis, including high incidences of neurologic impairment, hydrocephalus, and death.


Hypoxic Ischemic Insult and White Matter Injury of Prematurity
Perinatal partial asphyxia can result in damage to the periventricular white matter, the watershed zone of the premature infant, and result in white matter injury of prematurity (periventricular leukomalacia). It most commonly affects the white matter adjacent to the atria and the frontal horns of the lateral ventricles ( Fig. 8-17 ). It is associated with neurologic sequelae, such as movement disorders, seizures, and spasticity. On ultrasound, increased heterogeneous echogenicity is seen within the periventricular white matter or basal ganglia. In severe cases there may be cystic necrosis and development of periventricular cysts ( Fig. 8-18 ). With time, there is often volume loss of the involved white matter ( Fig. 8-19, A and B ). Head ultrasound can identify early signs of hypoxic ischemic insult, such as accentuated gray-white matter differentiation ( Fig. 8-20, A and B ), slitlike ventricles secondary to edema, and blurring of interhemispheric fissure. Doppler interrogation of the circle of Willis may add value in the evaluation of acute ischemia and increase intracranial pressure. Premature and full-term infants exhibit a generally accepted resistive index (RI) range of approximately 0.6 to 0.9, in the absence of cardiac disease or peripheral vascular disease. Lower values may indicate acute hypoxia or ischemia, as a result of increased diastolic flow through cerebral vasodilation. Higher values may suggest cerebral swelling where intracranial pressures rise higher than systemic pressures, leading to decreased diastolic flow.


Benign Enlargement of Extraaxial Spaces
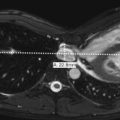
Benign enlargement of extraaxial spaces (benign macrocrania) is a diagnosis of exclusion. The term refers to children with large heads (head circumference greater than 97% for age), prominent subarachnoid spaces, and normal development. Typically such children present between 6 months and 2 years of age. After 2 years of age, the head size usually normalizes, and the children have no long-term consequences. The parents of such children often have large heads or had large heads as infants. On imaging there is a prominent size of subarachnoid spaces and normal to borderline prominent ventricular system ( Fig. 8-21, A and B ). Imaging is otherwise normal. Clinical follow-up is necessary to exclude loss of milestones or continue increase in head circumference that may indicate communicating hydrocephalus.

▪ Normal Myelination
Great changes in brain myelination occur during the first 24 months of life. Before myelination, white matter is hydrophilic and, because it contains water, appears high in signal on T2-weighted images and low in signal on T1-weighted images ( Fig. 8-22, A-C ). With myelination, the white matter becomes hydrophobic and, because it contains less water, appears low in signal on T2-weighted images and high in signal on T1-weighted images ( Fig. 8-23, A and B ). Myelination starts in utero and progresses from caudal to cranial, central to peripheral, and dorsal to ventral, paralleling neurologic development. In myelinating white matter, T1 shortening precedes T2 shortening. Therefore T1-weighted sequence is the preferred sequence for the evaluation of normal myelination from birth until 6 month of age, whereas T2-weighted sequence is more frequently used after 6 months, especially after 1 year of age. Myelination in a term infant on T1-weighted sequence is seen along the dorsal brainstem, cerebellar peduncles, globus pallidi, lateral thalami, posterior limb of internal capsule, central corona radiata, rolandic and perirolandic regions, and optic tracts ( Fig. 8-24 ). During the first 3 months of life, there is progressive myelination of the spinal cord and brainstem, followed by myelination of the cerebellar white matter. The corpus callosum begins to myelinate in the splenium (posterior part) at 2 to 3 months of age, proceeds anteriorly, and is completely myelinated through the rostrum (anterior part) by 6 to 8 months of age. Table 8-3 summarizes the expected myelination milestones in T1 and T2 sequences, with key milestones highlighted in bold. Myelination becomes similar to adult patterns on T2-weighted sequence by 24 to 36 months of age, with the exception of few terminal zones. Terminal zones of myelination can be seen in the frontotemporal subcortical white matter until the age of 36 to 40 months, whereas the commonly identified posterior periventricular terminal zones of myelination can be seen as late as teenage years ( Fig. 8-25 ).


Assessing myelination has become a key component in the evaluation of children with developmental delay. Abnormal myelination is a nonspecific finding and can be secondary to a number of causes, including metabolic disease, infection, trauma, hypoxia-ischemia, and genetic or malformative syndromes.
▪ Developmental Abnormalities
Developmental abnormalities can be classified on the basis of the embryologic event that fails, causing the abnormality ( Table 8-4 ). Categories include abnormalities of dorsal induction, ventral induction, migration and cortical organization, neuronal proliferation and differentiation, and myelination. Abnormalities can also result from destruction of already formed structures. The type of developmental lesion often reflects the timing of the disturbance that occurred during development. Often, multiple distinct developmental abnormalities are present simultaneously.
Chiari
Chiari Type 1
Chiari type 1 is the presence of an abnormal inferior location of the cerebellar tonsils, at least 5 mm below the foramen magnum ( Fig. 8-26 ). The cerebellar tonsils are typically elongated in morphology rather than round, and there are different degrees of CSF effacement at the craniocervical junction. The medulla and fourth ventricle are in normal positions. Complications of Chiari type 1 include hydrocephalus and hydromyelia (see Fig. 8-26 ). It may be suspected on CT when the foramen magnum appears “full” with soft tissue ( Fig. 8-27 ). It is best visualized on sagittal MR images. Phase-contrast CSF flow MR sequence is often used to show CSF space effacement and pistoning movement of the cerebellar tonsils. Chiari 1 may be acquired with increase intracranial pressure and may also resolve with child growth.


Chiari Type 2
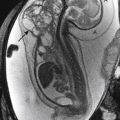
Chiari type 2 is a malformation of hindbrain and is almost always associated with myelomeningoceles. Conversely, almost all patients with myelomeningoceles have Chiari type 2 malformation. Patients with this abnormality have small posterior fossa and associated inferior displacement of the cerebellum, medulla, and fourth ventricle into the upper cervical canal ( Fig. 8-28 ). Associated imaging findings include a kinked appearance of the medulla, colpocephaly (disproportionate enlargement of the posterior body of the lateral ventricles), fenestration of the falx associated with interdigitating gyri across the midline, enlargement of the massa intermedia, inferior pointing of the lateral ventricles, and tectal beaking (a pointed appearance of the quadrigeminal plate). Chiari type 2 malformations are usually associated with hydrocephalus diagnosed prenatally ( Fig. 8-29, A and B ).


Prenatal correction of myelomeningocele can be performed in a subset of fetuses, following specific inclusion criteria. The aim is to decrease hindbrain herniation and the postnatal use of VPSs, as well as to improve lower extremity function ( Fig. 8-30, A and B ).

Chiari type 3 and type 4 malformations are very rare.
Holoprosencephaly
Holoprosencephaly results from lack of complete cleavage of the brain into two hemispheres. Although there is a continuous spectrum of severity, holoprosencephaly is classically classified into one of three distinct groups: alobar, semilobar, or lobar. The severity of the brain abnormality is usually reflected in the severity of the midline facial abnormality.
Alobar holoprosencephaly ( Fig. 8-31, A and B ) is the most severe form and is characterized by a monoventricle. The thalami are fused and there is no attempt at cleavage of the cerebral hemispheres. There is no falx cerebri or corpus callosum. There is a single anterior cerebral artery (azygous artery). These infants are commonly stillborn or have a very short life span.

With the intermediate form, semilobar holoprosencephaly ( Fig. 8-32, A and B ), the cerebral hemispheres are partially cleaved from each other posteriorly. The temporal horns of the lateral ventricles may be formed, but there is a single ventricle anteriorly. There is at least partial separation of the thalami. Midline structures, such as the falx and corpus callosum, may be present posteriorly but not anteriorly.

Lobar holoprosencephaly is a milder form in which the occipital and temporal horns are well formed but there is failure of cleavage of the frontal lobes. The septum pellucidum is absent, and the corpus callosum may be absent or dysplastic.
A less severe form of holoprosencephaly is syntelencephaly or middle interhemispheric variant, and may be seen as fusion only of the midline posterior frontal lobes and parietal lobes ( Fig. 8-33 ). Different degrees of septum pellucidum and corpus callosum agenesis/dysgenesis can be present.

Septo-optic Dysplasia
Septo-optic dysplasia is another type of ventral induction malformation, analogous to mild holoprosencephaly. It was originally described as absence of the septum pellucidum and hypoplasia of the optic nerves (diagnosed most often by ophthalmological evaluation). It was later discovered that there is often associated pituitary abnormalities and dysfunction (approximately two thirds). Currently, several authors believe that a combination of any two of the three findings is part of the disease spectrum. Pituitary abnormalities may include absent visualization of T1 bright posterior pituitary gland, ectopic posterior pituitary gland ( Fig. 8-34 ), interrupted or hypoplastic pituitary stalk, or hormonal abnormalities with no obvious imaging finding. Septo-optic dysplasia may also present with schizencephaly, heterotopia, and incomplete hippocampi inversion. In septo-optic dysplasia the frontal horns of the lateral ventricles have a squared appearance on coronal MR images.

Dysgenesis of Corpus Callosum
Dysgenesis of the corpus callosum includes both complete and partial absence. The corpus callosum normally develops from two independent portions, anterior and posterior, and the anterior corpus callosum enlarges and becomes visible earlier. More commonly the anterior portion is present with partial absence, although this is not always true ( Fig. 8-35, A-C ). Absence of the corpus callosum can occur in isolation or in conjunction with many of the other developmental abnormalities. On coronal MR images the lateral ventricles are separated, and the third ventricle extends more superiorly than normal, positioned between the lateral ventricles. The white matter tracts, which normally would cross the midline via the corpus callosum, run along the medial surface of the lateral ventricles and form the bundles of Probst (see Fig. 8-35, C ). Lateral ventricles assume a parallel configuration on axial views, and colpocephaly (see Fig 8-35, B ) is often present (dilatation of posterior horns of lateral ventricles). Midline masses, such as lipoma and interhemipheric cyst (see Fig. 8-35, B ), can also be associated.

Posterior Fossa Anomalies with Enlarged Cerebrospinal Fluid Spaces
Causes of enlarged posterior fossa fluid spaces include a spectrum of etiologies that vary from normal developmental variants (mega cisterna magna) to more significant malformations. They can be divided into five major groups: Dandy-Walker malformation, cerebellar vermian hypoplasia, Blake pouch cyst, mega cisterna magna, and arachnoid cyst.
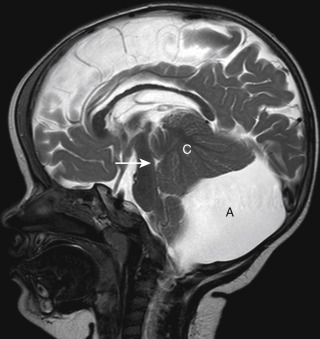
Dandy-Walker malformation is characterized by complete or partial agenesis of the cerebellar vermis in conjunction with the presence of a large posterior fossa. The CSF spaces are enlarged, and the torcula is elevated ( Fig. 8-36 ). The falx cerebelli is absent. Often there are also supratentorial abnormalities that may include holoprosencephaly, agenesis of the corpus callosum, polymicrogyria, and heterotopias. Hydrocephalus is also not uncommon. Outcome depends on severity of vermian hypoplasia and associated supratentorial abnormalities.

Cerebellar vermian hypoplasia (formerly known as Dandy-Walker variant or continuum) is characterized by mild, moderate, or severe hypoplasia of the cerebellar vermis. As a result there is enlargement of the normal communication between the fourth ventricle and posterior fossa extra axial spaces. The overall size of the posterior fossa is not enlarged, and there is a normally positioned torcula ( Fig. 8-37 ).

Blake pouch cyst is more commonly seen in the prenatal scenario, when fetal MRI is performed to evaluate for Dandy-Walker malformation versus vermian hypoplasia. Blake pouch is a normal embryological CSF-filled structure, seen during the development of the posterior fossa as a CSF outpouching that extends posteriorly from the inferior aspect of the developing fourth ventricle. When there is absent, incomplete, or late fenestration of this pouch (future foramens of Luschka and Magendie), a persistent cystic structure causing enlarged communication of the fourth ventricle and retrocerebellar extraaxial spaces is seen and referred to as Blake pouch cyst. The cerebellar vermis is usually uplifted but normally formed.
When enlarged posterior fossa CSF spaces are present with a fully developed and normally positioned cerebellar vermis, there are two possibilities. If the CSF spaces exhibit no mass effect on the cerebellum and the falx cerebelli is present, a mega cisterna magna is considered to be present. A mega cisterna magna may be in the spectrum of a persistent Blake’s pouch cyst, as proposed by recent articles, and is considered a developmental variant of no clinical significance. If the CSF spaces appear cystic and exhibit mass effect on the cerebellum, an arachnoid cyst is considered more likely ( Fig. 8-38 ). The differentiation between a mega cisterna magna and an arachnoid cyst may be difficult. However, regardless of the name chosen, if there is minimal or no mass effect on the cerebellum, the finding is considered incidental and of no clinical significance.
Gray Matter Heterotopias
Heterotopias are abnormalities of neuronal migration characterized by arrest in radial migration of the neurons from the subependymal area to the cortex. Heterotopias may be isolated or associated with other migrational disorders. Common clinical presentation is focal seizures. On CT and MRI the lesions may appear as nodular ( Fig. 8-39, A and B ) or linear ( Fig. 8-40 ) areas of gray matter signal within the white matter, most typically in the subependymal and subcortical regions. Bilateral periventricular subependymal nodular heterotopia may be familial with either X-linked or autosomal recessive patter of inheritance.