, Valery Kornienko1, Alexander Potapov2 and Igor Pronin3
(1)
Department of Neuroradiology, Burdenko Neurosurgery Intitute, Moscow, Russia
(2)
Department of Neurotrauma, Burdenko Neurosurgery Insitute, Moscow, Russia
(3)
Department of Neuroradiology, Burdenko Neurosurgery Institute, Moscow, Russia
Abstract
In Chapter 3 we discuss the results of correlation study between severity, location, and level of hemispheric and brain stem damage based on clinical, CT, and MRI comparison analysis. CT and MRI data were compared to determine sensitivity and possibilities in detecting brain lesion location and severity based on the mechanisms of injury, trauma severity, and outcome. MRI data were used for a more differentiated evaluation of hemispheric and brain stem damages.
Today it is still unclear what localizations and severity of traumatic brain injury may cause disorders of consciousness and development of coma with variable depth and duration. It equally applies not only to the brain stem but also to the thalamus, basal ganglia, corpus callosum, and cortical-subcortical structures.
To answer this question 162 patients with acute and subacute TBI of various severity were examined by different sequences of magnetic resonance imaging. A comprehensive MRI classification of localization of the brain stem and hemispheric damages has been proposed. This classification significantly correlates with Glasgow Coma Scale and Glasgow Outcome Scale, thus proving its prognostic value. The classification developed for the brain injury localization and levels based on MRI data may become a useful tool for forming the data bank on traumatic brain injury and studying clinical comparative evaluations of efficacy of various approaches for the management of patients with severe TBI.
This chapter has been contributed in collaboration with Eugenia Alexandrova and Gleb Danilov
3.1 CT and MRI Data Comparison
Comparison of CT and MRI data was performed in 43 patients with acute TBI (Table 3.1). The results of CT and MRI comparisons showed different sensitivity for detecting intracranial hemorrhages in the acute stage of TBI. MRI was evidently more sensitive than CT (p < 0.01) in detecting deep brain structure damage, especially nonhemorrhagic, in subcortical white matter, corpus callosum, basal ganglia, thalami, and brain stem (Table 3.2).
Table 3.1
Patient baseline characteristics (N = 43)
Gender: male/female | 29/14 |
|---|---|
Patient’s age, median value | 29 |
GCS score, median value | 7 |
GOS score, median value | 3 |
Mechanism of trauma | |
Traffic | 31 |
Non-traffic | 12 |
Table 3.2
Comparison of CT and MRI data in patients in the acute period of TBI
Injured structures and pathology | MRI data (Occurrence, percentage) | CT data (Occurrence, percentage) | p-value |
|---|---|---|---|
Basal ganglia | 40 | 14 | 0.003 |
Thalami | 26 | 14 | 0.5 |
Corpus callosum | 65 | 33 | 0.002 |
Brain stem | 47 | 16 | 0.002 |
Focal contusions | 77 | 70 | 0.5 |
ICH | 23 | 23 | 0.7 |
SDH | 56 | 33 | 0.02 |
EDH | 5 | 12 | 0.23 |
SAH | 88 | 88 | 0.9 |
IVH | 35 | 26 | 0.3 |
Midline shift | 33 | 37 | 0.7 |
Secondary ischemia | 16 | 9 | 0.3 |
Examples of CT and MRI sensitivity in acute and subacute phases of TBI are presented in Figs. 3.1, 3.2, 3.3, 3.4, 3.5, and 3.6.
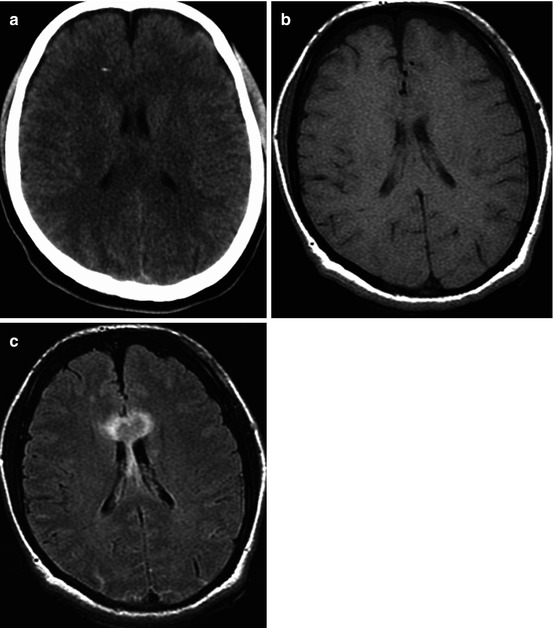
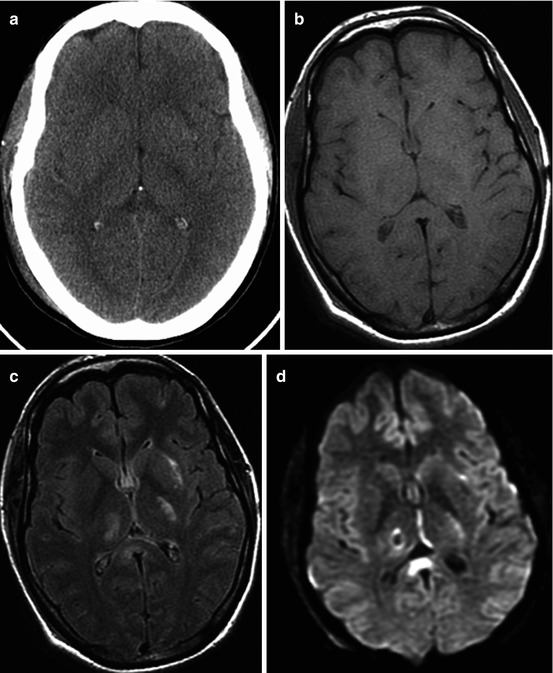
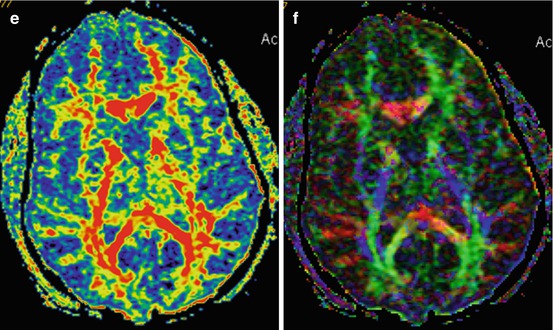
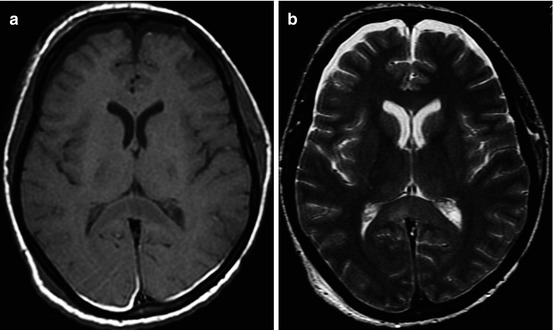
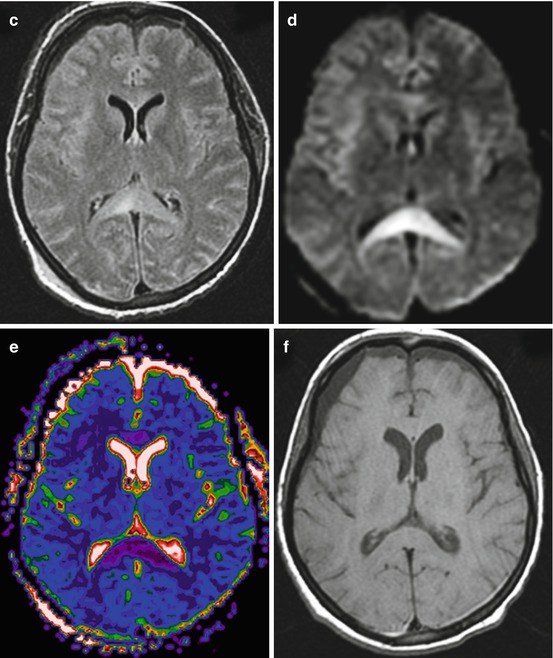
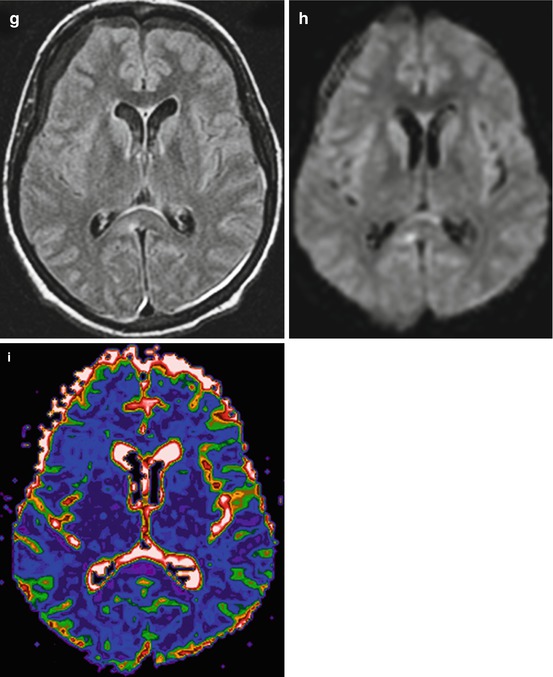
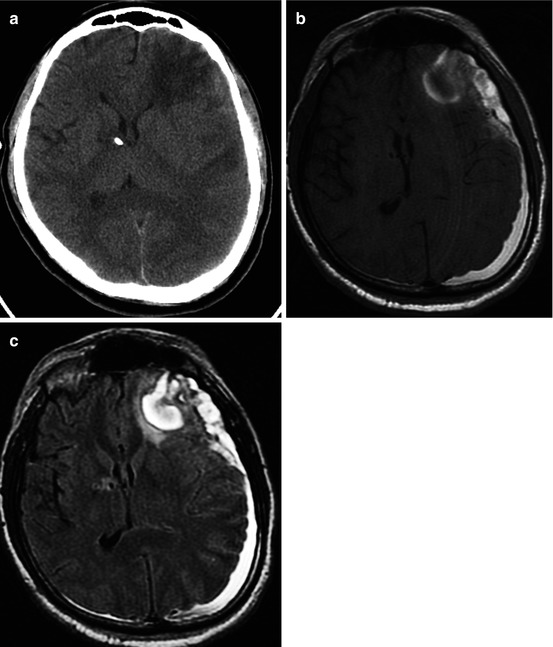
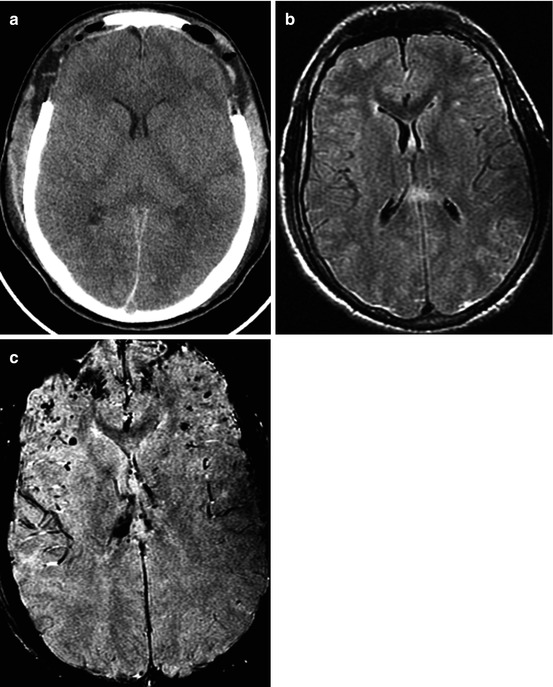
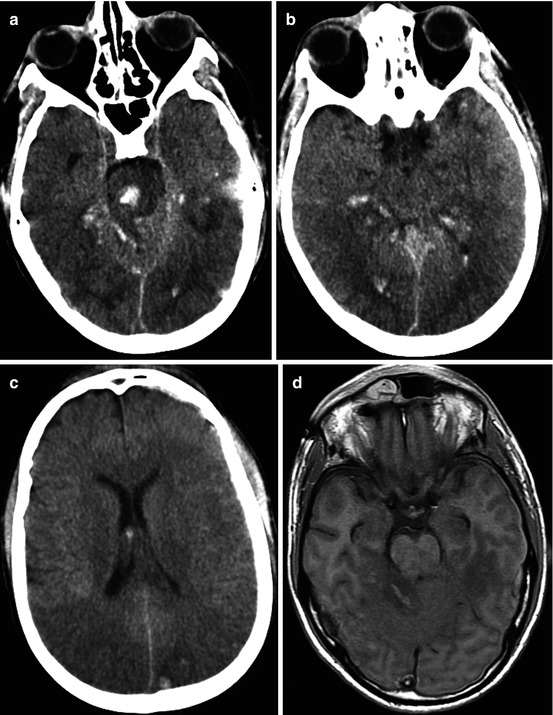
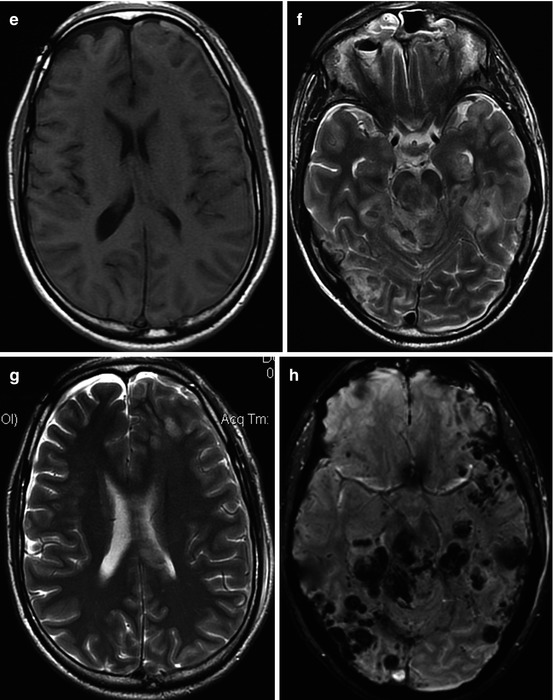
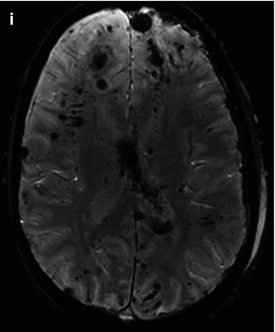
Fig. 3.1
CT and MRI data comparisons. Traffic accident. Five days after trauma. DAI: (a) CT – no visible changes, ICP sensor in the right frontal lobe; (b) T1WI – hygromas in frontal lobe regions; (c) T2-FLAIR clearly visualizes signs of corpus callosum damage
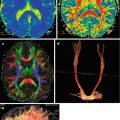
Fig. 3.2
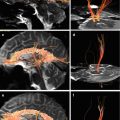
Traffic accident. DAI. GCS – 5. CT and MRI data in 3 days after injury. CT (a) MRI (b T1WI; c T2-FLAIR; d diffusion-weighted imaging; e FA map, DT-MRI; f color-coded map, DT-MRI). Outcome: severe disability. See explanation in the text
Fig. 3.3
Damage of the corpus callosum in DAI. MRI (T1WI, T2WI, T2-FLAIR, DWI, ADC map) (a–e) in 8 days; (f–i) in 27 days after trauma. In 8 days, ADC values (e) in the splenium of the corpus callosum – 0.31 ± 0.04 × 10⁻³ mm2/s – indicate cytotoxic edema; in 27 days after trauma, (i) 0.684 ± 0.09 × 10⁻³ mm2/s (in norm, 0.7 ± 0.075 × 10⁻³ mm2/s)
Fig. 3.4
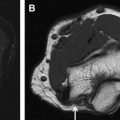
CT (a) and MRI (b T1WI; c T2-FLAIR) data comparisons in cortical-subcortical focal contusion and subacute subdural hematoma (15 days after injury). See explanation in the text
Fig. 3.5
Traffic accident. DAI. GCS, 8. CT (a) and MRI (b T2-FLAIR; c SWAN) data comparison in diffuse axonal injury with petechial hemorrhages and diffuse hemispheric edema. Increased intracranial hypertension, condition after decompressive bifrontal craniectomy. Outcome, moderate disability
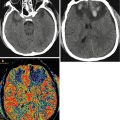
Fig. 3.6
Traffic accident. DAI. GCS, 4. CT and MRI studies in the first day after injury. Coma duration, 37 days. Outcome, severe disability. CT (a–c) and MRI (T1WI, d, e; T2WI, f, g) data comparison; SWAN modality (h, i) shows higher sensitivity in petechial hemorrhage detection
As is shown in Fig. 3.1, T2-FLAIR MRI is accurate in visualizing corpus callosum damages, while T1 MRI and CT do not show these pathological changes.
Diffusion-weighted imaging (DWI) and diffusion-tensor imaging (DTI) are useful in visualizing water diffusion and anisotropy disturbances on ADC and FA maps. As is seen in Fig. 3.2, DWI shows change of intensity signal for the zones of restricted water diffusion and as such being indicative of local water electrolytic balance disturbances and cytotoxic edema development. Fractional anisotropy map and two-dimensional color-coded map demonstrate changes of anisotropy in the damage areas, while CT and T1 MRI do not reveal these damage zones.
Dynamic DWI detects reversibility of posttraumatic cytotoxic edema by the end of third week after injury (Fig. 3.3). The data obtained show a 2–3-week time interval, when nonhemorrhagic parenchymatous changes caused by a cytotoxic edema can be revealed.
It is well known that CT is very sensitive for detection of acute hemorrhages, though in the ensuing period its diagnostic value decreases along with regression of hemorrhagic zone density. CT study in Fig. 3.4 was performed in 15 days after trauma and demonstrated only low-density contusions and midline shift, while MRI revealed hemorrhagic components of a focal contusion and subdural hematoma.
Our results have proved the generally accepted opinion that gradient echo, T2* GRE, 3D GRE, or SWAN (T2*-weighted angiography) are the most sensitive methods of neuroimaging of hemorrhages, especially microhemorrhages (Figs. 3.5 and 3.6). Its sensitivity was also rather high in the acute, subacute, and chronic periods of injury.
Case Report (Fig. 3.6)
M., 23 y.o., traffic accident. Diagnosis: severe combined trauma. Diffuse axonal injury: small hemorrhages in the white matter of hemispheres, basal ganglia, brain stem at the level of the medulla oblongata on the right, pons, midbrain from both sides. Subarachnoid hemorrhage, intraventricular hemorrhage. Skull vault fractures. Hemorrhage into the right frontal and supramaxillary sinuses. Heart contusion. Lung contusion.
On admission: GCS score 4. Length of coma, 37 days.
Four months after TBI: minimally conscious state (mutism with speech comprehension), severe mostly right-sided tetraparesis with hypertonus.
GOS: severe disability.
Thus, the data mentioned above show that MRI is more sensitive in detection of DAI with nonhemorrhagic lesions or microhemorrhages as well as intracranial hemorrhages and hematomas in subacute and chronic stages. That is why it seems reasonable to use not only CT but also advantages of different MRI sequences for a more detailed analysis of interrelation between TBI mechanisms, clinical status, and neuromorphological changes.
3.2 MRI Classification of TBI
The anatomy of the brain and its physiological, metabolic, neurotransmitter, and neurophysiological mechanisms responsible for structural and functional brain integrity, consciousness, and mental recovery are of a permanent interest for experimental and clinical neuroscientists (Castaigne et al. 1981; Munkle et al. 2000; Schiff and Plum 2000; McMillan and Herbert 2004; Lammi et al. 2005; Levin 2006; Maxwell 2006; Owen et al. 2006; Posner et al. 2007; Augustenborg 2010; Alexandrova et al. 2011; Bragina et al. 2011; Oknina et al. 2011; Potapov and Likhterman 2011).
Development of modern neuroimaging technologies has opened up a new opportunity for studying this problem in normal and pathological conditions.
The first MRI classification of severe TBI was proposed by Firsching et al. (2001). They showed a high frequency of brain stem damage in patients with severe TBI in the acute phase. This classification was based on the location of brain stem injury using conventional MRI (T1, T2) sequences. The authors did not consider severity and location of supratentorial injuries and summarized all types of hemispheric damages in Grade I, regardless of deep subcortical structure involvement.
Mannion et al. (2007) analyzed 46 patients with severe TBI using T2, FLAIR, and T2*GRE MRI sequences. Unfavorable outcome was observed in 55 % of patients with supratentorial damages only and in 85 % (11 of 13 patients) of patients with brain stem damages. Though the correlation between brain stem lesions and outcome was significant, the authors did not regard brain stem damage as an absolute prognostic factor of unfavorable outcome.
These and other publications reported mostly severe TBI cases based on a limited spectrum of MRI sequences. At the same time, neither qualitative analysis of coma nor comparisons of brain stem injury rates in mild and moderate TBI have been given.
Today it is still unclear what localizations and severity of traumatic brain injury may cause disorders of consciousness and development of coma with a variable depth and duration. It equally applies not only to the brain stem but also to the thalamus, basal ganglia, corpus callosum, and cortical-subcortical structures.
To answer this question 162 patients with acute and subacute TBI of various severity were examined by different sequences of MRI (T1, T2, T2-FLAIR, DWI, T2* gradient echo, SWAN). Patients’ age varied 8–72 (mean age 29.6 ± 12.8 years). The main group of patients aged 15–59 years (91.35 %); half of the injured were young people aged 8–26 years (Fig. 3.7); 71 patients (48 %) underwent MRI within 1–7 days after injury, 33 % within 8–14 days, and 19 % within 15–21 days after injury (average 8.7 ± 5.7 days).
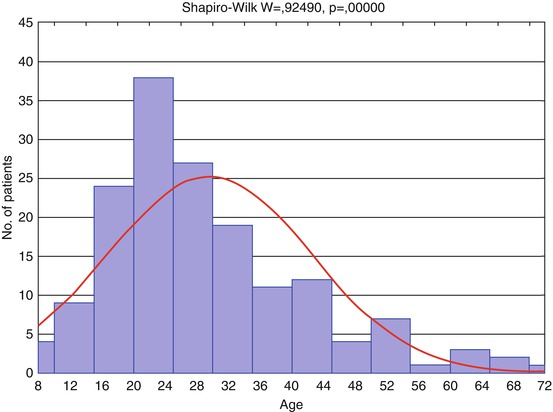
Fig. 3.7
Distribution of patients by age (n = 162). Red curve shows expected normal (Gaussian) distribution
Descriptive statistics | |||||||||
|---|---|---|---|---|---|---|---|---|---|
N | Mean | Median | Minimum | Maximum | 10th percentile | 90th percentile | Std. dev. | Standard error | |
Age | 162 | 29.61 | 26 | 8 | 72 | 16 | 48 | 12.79 | 1.005 |
MRI data were used for a more differentiated evaluation of hemispheric and brain stem damages. This analysis permitted us to propose MRI grades. The number of patients classified by this extended MRI gradation is depicted in Table 3.3; each next grade may include the lesions of previous grades.
Table 3.3
Number of patients evaluated by extended MRI gradation (n = 162)
Injury level | Occurrence (n, %) |
|---|---|
1. No signs of parenchymatous lesions | 10 (6.2) |
2. Cortical-subcortical lesions | 31 (19.1) |
3. Corpus callosum damage ± 2 | 24 (14.8) |
4. Uni- or bilateral damage of the basal ganglia and/or thalami ± (2–3) | 21 (13) |
5. Unilateral brain stem damage at different levels ± (2–4) | 29 (17.9) |
6. Bilateral midbrain damage ± (2–4) | 30 (18.5) |
7. Bilateral pons damage ± (2–6) | 15 (9.3) |
8. Bilateral medulla oblongata damage ± (2–7) | 2 (1.2) |
The histogram (Fig. 3.8) shows distribution of patients by Glasgow Coma Scale (GCS) with its score varied from 3 to 15 (average 8 ± 3; median 7; 10 and 90 percentile, scores 4 and 13 correspondingly); 65 % of 162 patients were in coma (GCS ≤ 8), 18 % had GCS score 9–12, and 17 % GCS score 13–15.
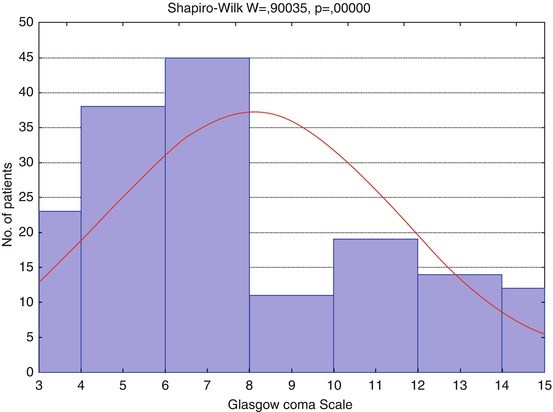
Fig. 3.8
Distribution of patients by Glasgow Coma Scale (GCS), n = 162. Red curve shows expected normal (Gaussian) distribution
Descriptive statistics | |||||||||
|---|---|---|---|---|---|---|---|---|---|
N | Mean | Median | Minimum | Maximum | 10th percentile | 90th percentile | Std. dev. | Standard error | |
GCS | 162 | 8.07 | 7 | 3 | 15 | 4 | 13 | 3.4697 | 0.273 |
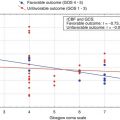
The histograms (Figs. 3.8 and 3.9) show patient distribution by GCS and GOS different from the normal due to severe TBI predominance in the analyzed groups of patients (GCS ≤ 8), and hence, severe disability prevailed in groups of outcome.
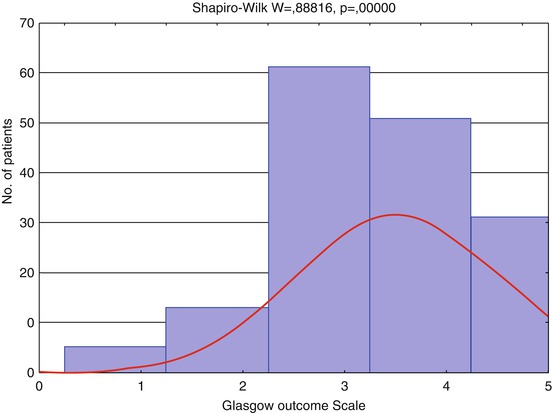
Fig. 3.9
Distribution of patients by Glasgow Outcome Scale (GOS), n = 162. Red curve shows expected normal (Gaussian) distribution
Descriptive statistics | |||||||||
|---|---|---|---|---|---|---|---|---|---|
N | Mean | Median | Minimum | Maximum | 10th percentile | 90th percentile | Std. dev. | Standard error | |
GOS | 162 | 3.55 | 4 | 1 | 5 | 2 | 5 | 0.9927 | 0.078 |
As seen from Table 3.4 the majority (65 %) of the analyzed patients was in coma; coma rate depended on levels and localization of hemispheric deep structures and brain stem lesions.
Table 3.4
Occurrence of patients in coma (GCS ≤ 8) and unfavorable outcome (GCS 1–3) in analyzed groups of patients, divided by extended MRI gradation
Injury level | Total | GCS ≤ 8 | GOS 1–3 | ||
|---|---|---|---|---|---|
n | n | % | n | % | |
1. No signs of parenchymatous lesions | 10 | 1 | 10 | 0 | 0 |
2. Cortical-subcortical lesions | 31 | 9 | 29 | 4 | 13 |
3. Corpus callosum damage ± 2 < div class='tao-gold-member'>
Only gold members can continue reading. Log In or Register to continue
Related posts: Clinical and Prognostic Value of Neuroimaging in Traumatic Brain Injury Clinical and Prognostic Value of Neuroimaging in Traumatic Brain Injury
 Clinical Evaluation and Neuroimaging Technologies Clinical Evaluation and Neuroimaging Technologies
 Mapping of Cerebral Blood Flow in Focal and Diffuse Brain Injury Mapping of Cerebral Blood Flow in Focal and Diffuse Brain Injury
 Dynamic Study of White Matter Fiber Tracts After Traumatic Brain Injury Dynamic Study of White Matter Fiber Tracts After Traumatic Brain Injury
 Dynamics of Hemispheric and Brain Stem Regional Cerebral Blood Flow Dynamics of Hemispheric and Brain Stem Regional Cerebral Blood Flow
 High-Resolution Magnetic Resonance Neurography in Upper Extremity Neuropathy High-Resolution Magnetic Resonance Neurography in Upper Extremity Neuropathy
Stay updated, free articles. Join our Telegram channel
Full access? Get Clinical Tree
 Get Clinical Tree app for offline access

| |||||