
Fig. 13.1
(a) MRI (T1) images of bvFTD. The axial (left) and coronal (right) images demonstrate frontotemporal atrophy. (b) The result of VSRAD analysis (normal healthy volunteers vs. bvFTD individual). The colored areas show the regions with atrophy in the bvFTD individual compared with the normal healthy volunteers. (c) 99mTc-ECD SPECT images of bvFTD individual. The axial views demonstrate frontal and anterior temporal hypoperfusion. (d) The result of eZIS analysis (normal healthy volunteers vs. bvFTD individual). The colored areas show the regions with hypoperfusion in the bvFTD individual compared with the normal healthy volunteers
13.2.2 Semantic Dementia
Warrington reported three cases with associative agnosia and a fluent-type aphasia characterized by anomia and impaired word comprehension attributed to circumscribed asymmetric atrophy in the anterior temporal lobe, which was considered a selective impairment of semantic memory. Also, this feature was described by Snowden et al. as semantic dementia (SD) [23]. Later, Hodges et al. provided a comprehensive characterization of SD [24]. In 1998, Neary et al. developed diagnosis criteria for SD in relation to frontotemporal lobar degeneration (FTLD) [1].
The diagnosis of SD required a gradually progressive language disorder characterized by fluent, empty, spontaneous speech, loss of word meaning manifested by impaired naming and comprehension, preserved single-word repetition, and preserved ability to read aloud and write down orthographically regular words that are dictated [25]. Instead of the language disorder, individuals with prosopagnosia (impaired recognition of identity of familiar faces) and/or associative agnosia (impaired recognition of object identity) could also be diagnosed as having SD. Other aspects of cognition could be intact or relatively well preserved. Behavioral and personality changes characterized by loss of sympathy and empathy, narrowed preoccupations, and parsimony are included in the supportive diagnostic features, as these changes are considered characteristic of SD and often associated with high diagnostic specificity.
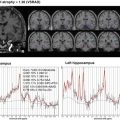
The neuroimaging shows atrophy and hypometabolism and/or hypoperfusion in the middle, inferior, and anterior temporal lobes bilaterally but asymmetrical, with the left side usually being more affected [14] (Fig. 13.2a–c).


Fig. 13.2
(a) MRI (T2: left, axial) and (FLAIR: right, coronal) images of SD. There is bilateral anterior temporal atrophy disproportionately affecting the left temporal lobe. (b) The result of VSRAD analysis (normal healthy volunteers vs. SD individual). The colored areas show the regions with atrophy in the SD individual compared with the normal healthy volunteers. (c) 99mTc-ECD SPECT images of SD individual. The axial views demonstrate bilateral temporal hypoperfusion disproportionately affecting the left temporal lobe. (d) The result of eZIS analysis (normal healthy volunteers vs. SD individual). The colored areas show the regions with hypoperfusion in the SD individual compared with the normal healthy volunteers
13.2.3 Progressive Nonfluent Aphasia
Grossmann et al. reported a different form of progressive language disorder, which was marked by dysfluent and effortful speech, hesitations, and errors in the production of speech sounds, and termed it progressive nonfluent aphasia (PNFA) [26]. In 1998, Neary et al. developed diagnostic criteria for PNFA in relation to FTLD [1].
The diagnosis of PNFA required gradually progressive nonfluent spontaneous speech with at least one of the following symptoms: agrammatism, phonemic paraphasias, or anomia [25]. Other aspects of cognition could be intact or relatively well preserved. Late behavioral changes similar to bvFTD are included as supportive diagnostic features.
The neuroimages show predominantly atrophy and hypometabolism and/or hypoperfusion in the left posterior frontal–insular region [27–29] (Fig. 13.3a–c).

Fig. 13.3
(a) MRI (T2: left, axial) and (FLAIR: right, coronal) images of PNFA. The images demonstrate asymmetric atrophy of the left Sylvian fissure. (b) 99mTc-ECD SPECT images of PNFA individual. The axial views demonstrate asymmetric hypoperfusion in the left posterior frontal–insular. (c) The result of eZIS analysis (normal healthy volunteers vs. PNFA individual). The colored areas show the regions with hypoperfusion in the PNFA individual compared with the normal healthy volunteers
References
1.
2.
Ratnavalli E, Brayne C, Dawson K, et al. The prevalence of frontotemporal dementia. Neurology. 2002;58:1615–21.CrossrefPubMed
Related posts:

Stay updated, free articles. Join our Telegram channel

Full access? Get Clinical Tree


