Fig. 14.1
Age distribution of volunteers who revealed neurological abnormalities (e.g., pathological reflex, sensory or motor abnormalities) by physical examination. Of the 685 volunteers (dark + light green), 81 revealed neurological abnormalities (dark green)

Fig. 14.2
Age distribution of volunteers who had an MMSE score of <28. Of the 685 volunteers (dark + light green), 54 did not reach an MMSE score of ≥28 (dark green)

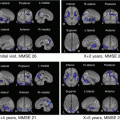
Fig. 14.3
Age distribution of volunteers who revealed asymptomatic abnormalities on brain MRI. Of the 685 volunteers (dark + light green), 69 showed asymptomatic abnormalities (dark green)

Fig. 14.4
Age distribution of volunteers who were finally considered to be normal. Of the 685 volunteers (dark + light green), 530 (77%) were finally considered to be normal (dark green). The prevalence of normal subjects declined as a function of age, and 53% (85/160) of the elderly subjects (≥70 years) were considered to be normal
14.4 Normal Database Generation
In addition to the aforementioned criteria for normal controls, how NDB is generated represents an important issue because the statistical image analysis depicts differences in images between a patient and NDB on a voxel-by-voxel basis. For example, the sample size for NDB may affect its diagnostic performance. However, there have been few data available that focused on the effect of sample size for NDB on diagnostic performance of PET and MRI using statistical image analysis. In this context, we generated nine NDB sets consisting of 4, 6, 8, 10, 20, 30, 40, 50, and 60 normal subjects to assess the diagnostic performance using these NDBs to distinguish AD patients from normal subjects [9]. We found that small NDBs (n ≤ 10) yielded poor quality of mean and standard deviation (SD) images as compared with large NDBs (n ≥ 20) as illustrated in Fig. 14.5 [9], and the area under the receiver operating characteristic (ROC) curves (AUCs) of the large NDBs (n ≥ 20) did not fall below 0.950, where AUCs of the small NDBs (n ≤ 10) never exceeded 0.950. Based on the results, we recommend to include at least 20 subjects for generating NDBs.

Fig. 14.5
Mean (left) and standard deviation (SD) (right) images generated from each normal database (NDB). NDB-n indicates normal database sample size. The quality of the mean and SD images of NDB was relatively poor when the sample size for NDB was small (n ≤ 10); however, both mean and SD image became smoother as the sample size increased. (Adopted from Chen et al. [9])
In addition to appropriate sample size, age and sex matching between a target subject and NDB is regarded as an important factor for NDB generation. We investigated whether the diagnostic performance of FDG PET for AD could be maintained even with age-mismatched and sex-mismatched NDB [10]. In that study, we generated six age-specific NDB sets consisting of participants ranging in age from 20 to 70 years and two sex-specific NDB sets, each consisting of only men or women. We found that there was no significant difference in each z-map and AUC either between age-matched and mismatched NDB sets or between sex-matched and mismatched NDB sets, as illustrated in Fig. 14.6. Thus, exact age-matched or sex-matched NDB may not be mandatory for discriminating patients with AD from normal subjects using FDG PET. However, it should be noted that these results are validated only for discrimination of AD from normal controls, and there has been no such a study on MRI. Therefore, we recommend to use age- and sex-matched NDB whenever available to avoid missing any subtle changes between a target subject and NDB.

Fig. 14.6
FDG PET z-maps of a 59-year-old woman patient with probable Alzheimer’s disease. (a) z-maps generated by each age-related normal database (NDB) set and (b) z-maps generated by each sex-related NDB set. The z-maps of FDG PET do not seem to be so different among the NDB sets. (Adopted from Chen et al. [10])
14.5 Normal Aging on FDG PET
Although the relationship between normal aging and cerebral glucose metabolism has been repeatedly examined using FDG PET, inconsistent results have been reported [11–22]. In our prior study using partial-volume effect (PVE) correction for FDG PET [3], we found that reduction in FDG uptake with advancing age, detected by FDG PET without PVE correction, could be accounted for largely by an age-related cerebral volume loss in the bilateral perisylvian and medial frontal areas; after PVE correction, the area of age-related FDG decline was confined to fewer regions, including the anterior cingulate and inferior frontal gyrus (Fig. 14.7). The effect of PVE correction was most significant in the regions showing negative correlations between age and gray matter volumes as assessed by structural MRI and voxel-based morphometry (Fig. 14.8). In a more recent study, however, Knopman et al. [23] observed a modest but significant age-related FDG decline in many brain regions, including areas that are known to be affected in AD, such as the posterior cingulate/precuneus, even after correction for atrophy. Thus, more work is necessary for better understanding of interaction between normal aging and brain glucose metabolism.


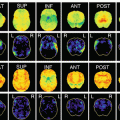
Fig. 14.7
Maximum intensity projections of SPM results for negative correlation of relative FDG activity with advancing age in men and women before (a, c) and after (b, d) partial volume effect (PVE) correction. Height threshold <0.001, corrected for multiple comparisons. (Adopted from Yanase et al. [3])
Fig. 14.8
Maximum intensity projections of SPM results for negative (a, c) and positive (b, d) correlation of regional gray matter volume with advancing age in men and women. Height threshold <0.001, corrected for multiple comparisons. (Adopted from Yanase et al. [3])
14.6 Effect of Apolipoprotein E (ApoE) ε4 Allele on Neuroimaging Biomarkers
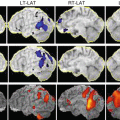
There is a general agreement that the apolipoprotein E (ApoE) ε4 is a genetic risk factor for developing AD. The ApoE ε4 allele has been associated with glucose metabolic activity impairment in AD-signature regions even in cognitively normal subjects in some studies [24, 25]. As to ApoE ε4-related structural alterations measured by MRI, conflicting results exist as to whether loss of gray matter truly occurs in ε4 carriers [25, 26]. In a study by Reiman et al. [25], the ApoE ε4 homozygotes showed nonsignificant trends for smaller hippocampal volumes, whereas there was a significant decrease of gray matter in e4 homozygous subjects, as compared both to e4 heterozygous subjects and to noncarrier subjects in a study by Lemaitre et al. [26]. In a more recent study by Knopman et al. [23], there was an APOE ε4-associated FDG decline in AD-vulnerable regions, which was independent of amyloid burden, as measured by 11C-PIB PET. In our prior study [5], however, the prevalence of AD-like imaging abnormalities, such as an FDG decline in the posterior cingulate/precuneus or hippocampal atrophy, did not differ among ApoE ε4 carriers with normal cognitive function and noncarriers, as illustrated in Fig. 14.9. Furthermore, the prevalence of FDG PET or MRI abnormalities suggestive of AD in cognitively normal ε4 carriers was rather low and did not differ from that in noncarriers, indicating that the presence of ApoE ε4 allele alone may not be sufficient to induce AD-like imaging abnormalities in the majority of cognitively normal subjects. Although the precise mechanisms explaining for the inconsistent results are unclear, there are several differences between the studies. Firstly, unlike the study by Knopman et al. [23], we did not use PVE correction for FDG PET, because we expected that uncorrected FDG signal would reflect both metabolism and atrophy due to PVE and therefore may serve as a more sensitive marker of AD-associated changes. This should particularly be the case in individuals with posterior cingulate/precuneus atrophy, which is known to occur in a subset of AD patients [6]. Secondly, our study participants were much younger (mean age: 53.6 years for the ε4 carriers and 53.5 years for the noncarriers) than those (median age: 76 years) in Knopman et al. study [23]; the majority of our participants were 30–60 years old: there were no significant differences between ε4 carriers and noncarriers in that age group in their study [23]. The ApoE ε4-associated FDG decline may be more difficult to detect in such young subjects. These circumstances, alone or in combination, may have contributed to the somewhat discordant observations between the studies. Furthermore, it should be noted that many factors other than ApoE ε4, such as diabetes mellitus, are likely to be involved in the development of AD-like imaging signatures in cognitively normal individuals, which has been demonstrated in a recent study by Roberts et al. [27]. The same study group has also demonstrated that midlife onset of diabetes may affect late-life cognition through loss of brain volume [28]. Thus, it is likely that the effect of ApoE ε4 allele on neuroimaging biomarkers can be modulated by the coexistence of non-ApoE factors, and therefore care should be taken when interpreting the results.