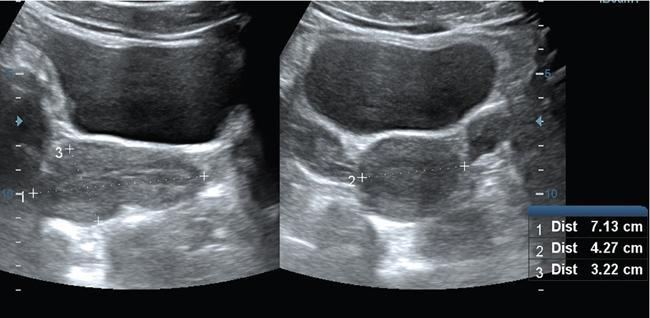
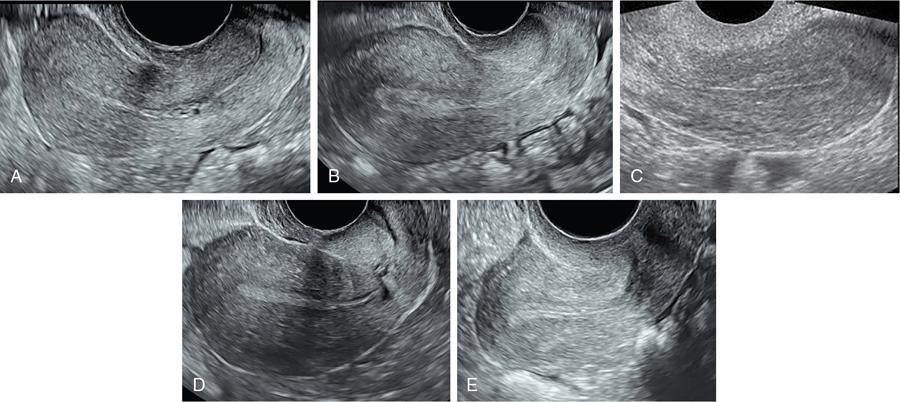
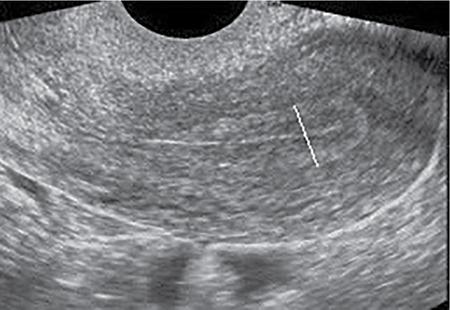
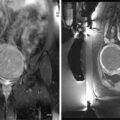
P. Reginald Wesley The imaging appearance of the uterus and ovaries depend on age and sexual maturation of the individual as they are under hormonal influence. Furthermore, the endometrium and ovaries vary their appearance depending on the time of imaging during the menstrual cycle. Fig. 11.3.1 shows the technique of measuring the uterus. Uterine length is more accurately measured with transabdominal ultrasound compared to transvaginal scan where the cervix may not be included within the field of view. Table 11.3.1 shows the normal uterine length and size ratio between the uterus and cervix in various age groups. Optimally assessed by transvaginal ultrasound. It represents the sum of the thickness of the two endometrial layers. To measure the endometrium, first the midline longitudinal image of the uterus is taken. Then place the cursor at the interface between the endometrium and the myometrium at the anterior and posterior walls of the uterus. Fig. 11.3.2 shows the appearance of the endometrium in various stages of menstrual cycle. The measurement is preferably taken at the fundal region with widest endometrium (Fig. 11.3.3). The echogenic line at the centre denotes the interface where the anterior endometrial layer opposes the posterior endometrial layer. The hypoechoic layer peripheral to the endometrium represents the inner layer of myometrium and should not be included while measuring the endometrial thickness. Table 11.3.2 shows the endometrial thickness and appearance in different stages of menstrual cycle. Ideally, transvaginal ultrasound is better because of its higher resolution especially in the assessment of polycystic ovaries. However, transabdominal scan has its use in adolescent girls and virginal women. It is also useful in cases of displaced ovaries. Fig. 11.3.4 shows the technique of measuring the ovarian volume. While measuring the volume in transabdominal scan, urinary bladder should be adequately distended. However, care should be taken not to over distend the bladder as it may compress the ovaries leading to incorrect measurement of the size. Bladder distension is not required for transvaginal ultrasound. Table 11.3.3 shows the appearance and size of ovaries in various age groups. According to the technical recommendation for the assessment of polycystic ovaries as per 2003 Rotterdam PCOS consensus: Time of performing ultrasound: Women who have regular menstrual cycles – early follicular phase between days 3 and 5. Women who are oligomenorrheic or amenorrheic – random or between 3 and 5 days after inducing withdrawal bleeding following progestin administration. Estimation of the number of follicles – done in both longitudinal and anteroposterior planes of the ovaries. The follicles which measure less than 10 mm, their size should be given as the average of the two diameters measured in each plane. Presence of 12 or more follicles in each ovary measuring 2–9 mm in size and/or ovarian volume of more than 10 mL. Ovarian volume is a surrogate measurement for stromal hypertrophy. The presence of a single polycystic ovary is sufficient for the diagnosis of polycystic ovary syndrome (PCOS). Measurement of the number of follicles (antral follicle count) should be done in longitudinal plane. Measurement of the size and distribution of the antral follicles should be done in orthogonal plane. Average of two orthogonal measurements is used for antral follicle diameter. In PCOS, there is ovarian androgenic dysfunction, which leads to stromal hypertrophy. This is called hyperthecosis where there is enlarged ovaries with increased stromal thickness and echogenicity without mature follicles. This is indicated by the stromal area. To measure the areas, first the stroma is identified which is represented by the central echogenic area of the ovary. Using the callipers, this central area is measured along with its outer margin. Then the total area of the ovary is measured by placing the callipers along with the outer margin of the ovary (Fig. 11.3.5).
11.3: Nomogram (which plane, where, in tables)
Nomograms in female reproductive system
Uterus and cervix
How to measure the uterus?
Stage
Uterine Length (cm)
Uterine Body to Cervix Ratio
Neonatal
3.5
2:1
Paediatric
1–3
1:1
Prepubertal
3–4.5
1–1.5:1
Pubertal
5–8
1.5–2:1
Reproductive
8–9
2:1
Postmenopausal
3.5–7.5
1–1.5:1
How to measure the endometrium?
Stage
Endometrial Thickness (mm)
Appearance
Menstrual phase (days 1–4)
4.6
Mildly echogenic
Proliferative phase (days 5–13)
4.6–12.4
Mildly echogenic
Luteinizing hormone (LH) surge (12–48 h before ovulation)
12.4
Striated with an inner hypoehoic and a peripheral more hyperechoic layer
Ovulatory phase (days 13–16)
Decreases slightly
Striated with an inner hypoehoic and a peripheral more hyperechoic layer
Secretary phase (days 16–28)
Increases by 2 mm
Thick and hyperechoic
Postmenopausal
1–2
Thin hyperechoic line or band
Ovaries
Technique of scanning

Stage
Ovarian Volume (cc)
Appearance
Neonatal
1–3.5
Follicles and cyst common
Paediatric
0.5–1.5
Fewer than six follicles, cysts uncommon
Prepubertal
1–4
Follicles and cysts common
Pubertal
2–6
Follicles and cysts common
Reproductive
4–16
Follicles and cysts common
Postmenopausal
1.2–5.8
Follicles and cysts in about 15%–20%
Polycystic ovarian syndrome
Criteria for diagnosis of PCOS
How to measure antral follicle count and size?
Ovarian and stromal areas
How to measure the stromal and ovarian areas?

Related posts:


Stay updated, free articles. Join our Telegram channel

Full access? Get Clinical Tree


