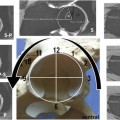
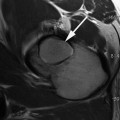
Fig. 2.1
In vivo axial sample image of a nondiffusion (left) and diffusion-weighted (right, averaged over three orthogonal directions) 3D SSFP-Echo scans with fused diffusivity map (using estimated T 1 information) of in vivo cartilage in the knee joint of a patient after matrix-associated autologous cartilage transplantation (MACT) at 3.0 T. A mean diffusivity of 1.42 ± 0.24 × 10⁻³ mm2/s was found for the control cartilage and 1.73 ± 0.54 × 10⁻³ mm2/s for the transplant (MACT). Scans were performed with 0.5 × 0.5 mm2 inplane resolution and 3 mm slice thickness; for other details, cf. [66]
A completely different approach for DWI with SSFP-Echo was proposed by Zur et al. [68], using bipolar rather than unipolar diffusion-sensitizing crusher gradients to reduce sensitivity to bulk motion. This concept was recently revisited and extended by Deimling [69], proposing a double-echo steady state (DESS) imaging technique for DWI with SSFP rather than a single echo method based on SSFP-Echo. Acquiring both primary SSFP modes with DESS, namely the Echo and the FID (also known as FISP, FAST, GRASS), offers the advance that diffusion effects are in combination with bipolar gradients and with respect to the Echo/FID signal ratio independent on relaxation times, as already noticed much earlier by Cho [70]. Unfortunately, however, bipolar gradient waveforms are not very diffusion-sensitive and thus generally require large moments and long repetition times.
Recently, a new and truly diffusion-weighted technique that is relaxation-independent SSFP technique was introduced based on a DESS approach using diffusion-sensitizing crusher moments [71]. It was shown that SSFP signal attenuation from diffusion becomes independent on relaxation with respect to the Echo-FID signal ratio, in complete analogy to what was observed by Cho et al. using bipolar gradients. As a result, quantitative SSFP DWI can be performed in the very-rapid-pulsing regime from two DESS scans, similar to what is proposed for SSFP-Echo but without the confounding influences of relaxation times, allowing high-resolution quantitative diffusion imaging of human articular cartilage in the knee joint at 3.0 T (see Fig. 2.2). Simultaneously, a similar approach for diffusion quantification was proposed by Staroswiecki et al. [72] allowing simultaneous estimation of T2 and of the apparent diffusion coefficient from two DESS acquisitions with different crusher gradients and flip angles.
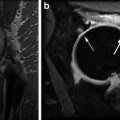
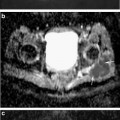
Fig. 2.2
High-resolution quantitative 3D DESS DWI of normal appearing cartilage in the ankle joint at 3.0 T. (Left) Sagittal nondiffusion-weighted DESS scan. (Middle) DESS scan with diffusion-sensitizing crusher moments along the direction indicated by the blue arrow. (Right) Fusion of the derived diffusion map onto a conventional DESS image (derived from the nondiffusion-weighted DESS scan). For cartilage, a diffusivity of D = 1.21 ± 0.48 × 10⁻³ mm2/s is found. Scans were performed with 0.4 × 0.4 mm2 inplane resolution and 3 mm slice thickness; for other details, cf. [71]
In summary, diffusion-sensitized SSFP, either based on the acquisition of the Echo only or on the double-echo approach using the FID to correct for relaxation time sensitivities in the Echo, have shown great promise for in vivo high-resolution quantitative DWI of cartilage in 3D and within reasonable scan times in a clinical setup. Sensitivity to bulk motion, however, is a major issue with diffusion-sensitized SSFP, and proper fixation seems not only mandatory but has carefully to be conducted prior to any measurement.
References
1.
2.
3.
4.
5.
6.
7.
8.
9.
Trattnig S, Mamisch TC, Welsch GH, Glaser C, Szomolanyi P, Gebetsroither S, Stastny O, Horger W, Millington S, Marlovits S. Quantitative T2 mapping of matrix-associated autologous chondrocyte transplantation at 3 Tesla: an in vivo cross-sectional study. Invest Radiol. 2007;42(6):442–8.PubMedCrossRef
10.
11.
Welsch GH, Mamisch TC, Domayer SE, Dorotka R, Kutscha-Lissberg F, Marlovits S, White LM, Trattnig S. Cartilage T2 assessment at 3-T MR imaging: in vivo differentiation of normal hyaline cartilage from reparative tissue after two cartilage repair procedures–initial experience. Radiology. 2008;247(1):154–61.PubMedCrossRef
12.
Quirbach S, Trattnig S, Marlovits S, Zimmermann V, Domayer S, Dorotka R, Mamisch TC, Bohndorf K, Welsch GH. Initial results of in vivo high-resolution morphological and biochemical cartilage imaging of patients after matrix-associated autologous chondrocyte transplantation (MACT) of the ankle. Skeletal Radiol. 2009;38(8):751–60.PubMedCrossRef
13.
Domayer SE, Welsch GH, Stelzeneder D, Hirschfeld C, Quirbach S, Nehrer S, Dorotka R, Mamisch TC, Trattnig S. Microfracture in the ankle: clinical results and MRI with T2-mapping at 3.0 T after 1 to 8 years. Cartilage. 2011;2(1):73–80.CrossRef
14.
Nehrer S, Domayer SE, Hirschfeld C, Stelzeneder D, Trattnig S, Dorotka R. Matrix-associated and autologous chondrocyte transplantation in the ankle: clinical and MRI follow-up after 2 to 11 years. Cartilage. 2011;2(1):81–91.CrossRef
15.
16.