Introduction
Worldwide, obesity has nearly tripled since 1975. The World Health Organization (WHO) reports that, as of 2016, more than 1.9 billion adults 18 years or older were overweight, and, of these, over 650 million were obese. The WHO report underscores that most of the world’s population lives in countries where overweight and obesity kills more people than underweight. As for children, the report estimated that over 340 million children and adolescents aged 5–19 years old were overweight or obese in 2016. A modeling study suggests that by 2030, the prevalence of nonalcoholic steatohepatitis (NASH) will increase 63% from the estimation made in 2015, and liver mortality and advanced liver disease are expected to more than double. These increases in the rates of obesity have prompted the WHO to identify obesity as one of the nine global noncommunicable diseases that must be addressed.
Obesity increases the risk of several diseases including nonalcoholic fatty liver disease (NAFLD), which is currently the most prevalent chronic liver disease worldwide. In fact, the prevalence of NAFLD is proportional to the increase in body mass index.
In a large U.S. cohort of asymptomatic middle-aged adults, the prevalence of NAFLD was 38% and the prevalence of NASH was 14%. Factors associated with the presence of NASH were race, obesity, and diabetes.
The rate of individuals affected by type 2 diabetes mellitus, which is another important risk factor for NAFLD and NASH, is also growing worldwide. Of note, it seems that type 2 diabetes mellitus seems to accelerate the course of NAFLD and is a predictor of advanced fibrosis and mortality. Moreover, liver steatosis can negatively affect the disease progression and treatment response in patients with viral hepatitis C and the prognosis of hepatic transplantation recipients.
NAFLD seems the most common cause of abnormal serum aminotransferase levels as well as chronic liver disease in the Western world. It is an umbrella term that includes a disease spectrum ranging from benign steatosis to NASH. The latter may progress to liver cirrhosis with its complications, namely portal hypertension and hepatocellular carcinoma. The prevalence of NAFLD in the general population is about 25% and it increases to over 90% in morbidly obese individuals. The progression to fibrosis is about 40%, and the mean annual rate of progression in NASH is 0.09%. The reason why some patients with NAFLD, even those with a low amount of fat in the liver, will develop NASH is still not clearly understood. The degree of liver steatosis is linked to metabolic syndrome and the cardiovascular risk. On the other hand, it seems that significant steatosis is associated with progression of fibrosis in patients with NAFLD. It also must be highlighted that a recent nationwide study in Sweden has shown in an adult cohort that the hazard ratio for overall mortality was significantly higher in all patients with NAFLD, including those with simple steatosis, than in controls. The results of this study confirm previous findings in small cohorts of patients with NAFLD with paired liver biopsy, , suggesting that simple steatosis may clearly progress, with around one quarter of patients developing bridging fibrosis over a relatively short time period. Of note, baseline steatosis grade was higher in those with progressive fibrosis. Alarmingly, similar findings were observed in children and young adults with biopsy-confirmed NAFLD: they had significantly higher rates of overall, cancer-, liver- and cardiometabolic-specific mortality compared with matched general population controls. Simple steatosis was associated with a 5.26-fold higher adjusted rate of mortality compared with controls.
Therefore an accurate estimate of the quantity of the fat in the liver is of great importance in the diagnostic work-up of patients with liver steatosis.
A panel of experts has recently proposed to adopt a new term based on a holistic approach to the disease, metabolic dysfunction–associated fatty liver disease (MAFLD). The diagnosis of MAFLD is based on the evidence of liver steatosis together with three positive criteria: overweight/obesity, presence of type 2 diabetes mellitus, or evidence of metabolic dysregulation.
In this chapter, we mostly use the term NAFLD because of the criteria that were followed to enroll patients in the cited studies.
Reference standard for liver fat quantification
For decades, liver biopsy has been considered the reference standard for detecting and grading liver steatosis. In the histologic Kleiner classification, the amount of fat in the liver is graded as S0, steatosis in less than 5% of hepatocytes; S1, 5%–33%; S2, 34%–66%; and S3, more than 66%.
Liver biopsy is an invasive procedure with some risks of complications that can be severe in up to 1% of cases. , On the other hand, the biopsy specimen is obtained from a very small part of liver, and fatty infiltration could be heterogenous. Moreover, a substantial intraobserver and interobserver variability between readings has been reported. , Considering the obesity epidemic, biopsy is not a practical approach for screening in patients with MAFLD who may have simple steatosis in most cases. Liver steatosis is a dynamic process that may change in short periods of time (weeks), requiring a noninvasive technique that can be repeated at multiple times to accurately assess progression or regression of disease.
Magnetic resonance imaging–derived proton density fat fraction (MRI-PDFF) is a quantitative noninvasive biomarker that objectively estimates the liver fat content and has been accepted as an alternative to the histological assessment of liver steatosis in patients with MAFLD. MRI-PDFF is not influenced by confounding factors, including body weight, and is operator-independent. Currently, it is an accepted noninvasive tool to diagnose and quantify liver steatosis and is used in clinical trials as an accurate reference standard method as an alternative to liver biopsy. , Also, when assessing the performance of new noninvasive tools for the detection and grading of liver steatosis, liver biopsy is not the best reference to compare the results with, given the very small size of the biopsy specimen and the dynamic nature of liver fat content.
The ultrasound (US) attenuation working group of the American Institute of Ultrasound in Medicine (AIUM) and the Radiological Society of North America (RSNA) Quantitative Imaging Biomarkers Alliance (QIBA) Pulse Echo Quantitative Ultrasound (PEQUS) initiative, which was formed to help develop and standardize acquisition protocols and to better understand confounding factors of US-based fat quantification, has recently advised that MRI-PDFF should be used in studies as the reference standard.
Noninvasive assessment: Ultrasound
B-mode imaging
B-mode US imaging allows to subjectively estimate the degree of fatty infiltration in the liver. The evaluation of liver steatosis is usually based on a series of US findings including liver echogenicity, hepatorenal echo contrast, visualization of intrahepatic vessels, and visualization of the liver parenchyma and the diaphragm. Steatosis is scored as follows: absent (score 0) when there is a normal liver echotexture; mild (score 1) steatosis, in the case of a slight and diffuse increase in fine parenchymal echoes with normal visualization of diaphragm and portal vein borders; moderate (score 2) steatosis, in the case of a moderate and diffuse increase in fine echoes with slightly impaired visualization of portal vein borders and diaphragm; severe (score 3) steatosis, in the case of marked increase of fine echoes with poor or no visualization of portal vein borders, diaphragm, and posterior portion of the right liver lobe. , Chapter 2 provides a more detailed discussion of the use of B-mode imaging in fat quantification.
The performance of B-mode US imaging for the detection of mild steatosis (fat content ≥5%) is low, with reported sensitivity of 53.3%–63.6%. A metaanalysis reported that, for the detection of moderate to severe fatty liver (>20%–30% steatosis), B-mode US had a performance similar to computed tomography or MRI. There is also a substantial interobserver variability. However, it must be underscored that, despite these limitations, B-mode US has been recommended as the preferred first-line diagnostic procedure for imaging of NAFLD in adults by the clinical practice guidelines of the European Association for the Study of the Liver released together with the European Association for the Study of Diabetes and the European Association for the Study of Obesity.
To improve the accuracy of B-mode US imaging, other scoring systems have been proposed and are reported below.
Semiquantitave assessment
Hamaguchi score
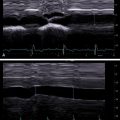
The Hamaguchi score combines four US findings: hepatorenal echo contrast, bright liver, deep attenuation, and vessel blurring, and a number is assigned to each of them.
Hepatorenal echo contrast is based on the ultrasonographic contrast between the hepatic and right renal parenchyma evaluated in an intercostal scan in the mid-axillary line; bright liver is based on abnormally intense high level echoes arising from the liver parenchyma and is graded as none, mild, or severe in accordance with intensity brightness; deep attenuation is based on the US attenuation in the deep portion of the liver and impaired visualization of the diaphragm; vessel blurring is based on impaired visualization of the borders of the intrahepatic vessels and narrowing of their lumen ( Fig. 11.1 ).

Bright liver and hepatorenal echo contrast are evaluated together, and the score ranges from 0 to 3. If they are both negative, the final score is 0. Deep attenuation goes from 0 to 2, and vessel blurring can be positive (score 1) or negative (score 0).
In a small series of patients undergoing liver biopsy, Hamaguchi et al. found that a score ≥2 had 91.7% sensitivity and 100% specificity for diagnosing NAFLD with an area under the receiver operating characteristic curve (AUROC) of 0.98. A score ≥1 had high specificity (95.1%) to detect visceral obesity. However, this score has not been validated in large series of patients.
Ultrasonographic fatty liver indicator score
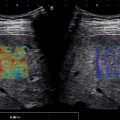
The ultrasonographic fatty liver indicator (US-FLI) score is based on the following features: intensity of liver/kidney contrast, posterior attenuation of the US beam, vessel blurring, difficult visualization of the gallbladder wall, difficult visualization of the diaphragm, and areas of focal sparing. Focal fat sparing is considered to be present when a focal geographic hypoechoic area is observed next to the gallbladder wall, portal vein, or the falciform ligament ( Fig. 11.2 ).

“Conditio sine qua non” is the presence of the contrast between the liver and the kidney, which is scored 2 if mild/moderate and 3 if severe. The presence of each other finding is scored 1.
The score ranges from 2 to 8 and NAFLD is diagnosed by a score at least >2.
In a small series of nonconsecutive patients, using liver histology as the reference, it has been reported that the US-FLI score was an independent predictor of NASH and a US-FLI <4 had a high negative predictive value (94%) in ruling out the diagnosis of severe NASH, but its specificity was low (45.7%). The AUROCs were 0.76 for the diagnosis of NASH and 0.80 for the diagnosis of severe NASH. As for the Hamaguchi score, the US-FLI score still lacks validation.
Hepatorenal index
The hepatorenal index (HRI) is calculated on the basis of the ratio between the echogenicity of the liver and that of the right kidney cortex (see also Chapter 2 ).
In the past, free software programs available online were used to analyze the pixels of the images.
To obtain the HRI, two regions of interest (ROIs) are positioned in the liver and the renal cortex. Both must be at the same depth in the hepatic parenchyma and the renal cortex, avoiding vascular and biliary structures or masses. Artifacts, especially from ribs or lung, must be avoided.
Literature data show significant variability with optimal cutoff for the detection of steatosis ranging from 1.24 to 2.2. Moreover, this method is limited by using postprocessing data, which is influenced by the time gain compensation setting as well as other settings.
Currently, most vendors have implemented this feature and the index is directly calculated using preprocessed data and displayed on the monitor of the US equipment ( Fig. 11.3 ). Generally, the intensity data from raw data per pixel are used to calculate the average intensity of pixels. Therefore the influence of gain, dynamic range, time gain compensation, or other scanner parameters is eliminated. However, HRI is affected by operator’s experience, depth of measurement, and variability between vendors in calculating this measurement. Moreover, it lacks validation in large series of patients; thus the applicability of the findings to the general population is unclear.

Quantitative ultrasound imaging techniques for fat quantification
Currently, the commercially available tools for quantification of liver fat include measuring the attenuation coefficient (AC), the backscatter coefficient (BSC), and the speed of sound. Presently most of them are based on the estimate of the attenuation of the backscattered echo signals originating along the direction of the transmitted US beam. The attenuation is due to absorption and conversion of sound energy into heat, reflecting some sound energy back to transducer, and scattering of the sound energy in several directions.
Attenuation and scattering are important properties of tissue that contribute to diagnostic information in medical US. In conventional gray-scale imaging, these tissue characteristics are acquired from differences in image brightness. However, the brightness displayed on the monitor of the US systems depends on operator settings and system-dependent factors so that attenuation and scattering can only be assessed in a qualitative manner. The algorithms for the quantitative estimate of the attenuation make use of the raw data of the backscattered echo signals, therefore they are not influenced by the system settings.
Liver steatosis causes an increase of the attenuation of the US beam as it traverses the liver parenchyma. The factors affecting the accuracy of attenuation estimate include backscattering variation, speed of sound variation, focus location, imaging artifacts, imaging resolution, and signal-to-noise ratio. The depth of ROI can be limited by the signal-to-noise ratio level.
Quantitative ultrasound (QUS) methods display the properties of tissue in a numerical way: by using proprietary algorithms, the attenuation can be objectively quantified, and an AC is calculated and usually displayed in decibels per meter (FibroScan) or decibels per centimeter per megahertz (US systems).
Ultrasound attenuation for liver fat quantification: Some basic information
Attenuation measurements are usually performed using backscattered echo signals originating along the direction of the transmitted US beam. The algorithms are generally based on the frequency domain approach in which the signals are divided in windows and for each window the frequency content is calculated. Thereafter, the change of US amplitude for all frequency components in the range of the transducer’s bandwidth is calculated over the depth. In fact, attenuation measurement can vary depending on the frequency bandwidth. Measurements performed with a narrow band frequency assume that the intercept is zero. Measurements over a broadband frequency range (i.e., that of the US transducer for clinical use) need to calculate attenuation at discrete frequencies and present the average value.
The attenuation estimate in the frequency domain approach can be obtained through the spectral difference methods or the spectral shift methods. The spectral difference methods assess the decrease of the echo signal power spectra along the path of the transmitted US beam. Spectral shift methods use the presence of a downshift of the power spectra toward lower frequencies as the US beam propagates in the medium. This shift in the power spectra obtained from two different depths is related to the attenuation characteristics of the medium.
The attenuation estimation techniques using a spectral shift are more precise than spectral difference methods but are more prone to local spectral noises and have a difficulty of accounting for the imaging system-dependent factors.
A hybrid method, which combines the advantages of the two methods and overcomes their specific limitations, has been introduced.
How to perform the examination
In many US systems the attenuation estimate can be obtained together with liver stiffness estimate. Therefore it is advised that the protocol for accurate liver stiffness values is maintained. The examination should be performed in a supine or slight (<30 degrees) lateral decubitus position in a neutral breath-hold when liver stiffness values are obtained at the same time. As of early 2022, no studies have evaluated different patient positions if only liver fat is quantified. Theoretically, the phase of respiration should not affect the measurement of the AC, but a breath-hold should be used during the measurement. Large blood vessels, artifacts, and masses should be avoided.
As in liver stiffness measurements, reverberation artifact may occur up to 2 cm below the liver capsule; therefore this area should be avoided. When a color map of the attenuation is available, areas that are markedly different from the majority of the color in the ROI should be avoided ( Fig. 11.4 ). A depth dependence of the measurement is likely, although recent studies have obtained clinically acceptable values using vendor guidelines. When there is significant attenuation of the US beam, deep areas may have a marked change in the color map due to the weak signal; these areas should also be avoided. The quality of the measurement is strictly linked to the quality of the B-mode image; that is generally better with the transducer at 90 degrees with respect to the liver capsule.

Currently, it is advisable to perform measurements in a homogeneous area of the liver, avoiding focal fatty deposition or fatty sparing. Presently, the ROI size cannot be changed in most systems, and the ROI is usually large to average over a large portion of the liver as more samples provide a better estimate.
For liver stiffness measurements at least a 4-hour fast is recommended, but the literature suggests that fasting may not be required for liver fat assessment.
It is expert opinion that at least five measurements be performed, and the median value used. The interquartile range/median (IQR/M) and/or the vendor’s recommendations should be reported as a quality measure. Presently there are no published studies on this matter. We suggest that the IQR/M be maintained up to 10%–15%.
Commercially available algorithms
Controlled attenuation parameter (Echosens, France)
Controlled attenuation parameter (CAP) is the algorithm available on the FibroScan system for the quantification of liver steatosis. The AC is given in decibels per meter and ranges from 100 to 400 dB/m; it is calculated together with the liver stiffness value ( Fig. 11.5 ).

The technique is available on the M and XL probe of the FibroScan system, and the choice between the two probes is based on the skin-to-liver capsule distance. Based on this parameter, the system software automatically recommends the choice of the probe. The M probe is used for a skin-to-liver capsule distance up to 25 mm, and the XL probe is used when this distance is greater than 25 mm. A correct choice of the probe is mandatory because the use of the M probe in patients with a skin-to-liver capsule distance greater than 25 mm may lead to an overestimation of liver steatosis. The US attenuation is computed at the US frequency of 3.5 MHz independently from the probe used. The rate of failure, which was initially reported at 7.7% of cases when only the M probe was used, is reported to be around 3% when both probes are available.
CAP and vibration controlled transient elastography (VCTE) liver stiffness values are obtained at the same time; therefore, the protocol for measurement is that recommended for liver stiffness measurement with VCTE.
The interobserver reproducibility of the measurements seems high, even though the agreement between observers decreases for CAP values in the normal range (<240 dB/m). This is likely due to the uneven distribution of other tissue scatterers that prevail over fat content in determining the attenuation of the US beam.
Generally, the quality criteria that were set for liver stiffness measurements (i.e., median value of 10 acquisitions with an IQR/M up to 30%) are used. Therefore every CAP measurement that is obtained together with a reliable liver stiffness measurement is accepted as reliable. Specific quality criteria for CAP measurements are not yet clearly defined, and the results are conflicting in the literature. A study suggested that the accuracy is significantly decreased when the IQR of the 10 consecutive CAP acquisitions was higher than 40 dB/m; another study reported that the IQR value should be less than 30 dB/m. , However, these results were not confirmed in a multicenter study and a metaanalysis. ,
CAP is not affected by liver fibrosis. Using CAP, a study found that steatosis was a confounding factor in fibrosis staging with VCTE. However, this finding was not confirmed in another study.
The cutoff for the detection of liver steatosis (≥5%) reported in the literature ranges from 219 dB/m in a cohort of patients with chronic hepatitis C to 294 dB/m in a metaanalysis of patients with NAFLD. , Therefore uncertainty remains about the cutoff value to be used in the real-world clinical practice for steatosis detection (S >0). It has been suggested that the cutoffs are etiology-specific. However, it must be highlighted that it is likely that the disease prevalence in the studied population rather than the etiology of liver disease might have accounted for the reported differences. In fact, the attenuation of the US beam is directly related to the liver fat content that has the same histological appearance in the majority of cases no matter what the etiology of liver disease is.
The data of an individual patient data metaanalysis have shown that CAP was unable to satisfactorily grade steatosis.
Studies performed in children to evaluate the diagnostic performance of CAP are generally underpowered, including small numbers of subjects. As observed in adults, the cutoff value for the diagnosis of steatosis ranges from 225 dB/m in an unselected pediatric population to 277 dB/m in a series of severely obese children. , This difference is likely due to the disease prevalence in the studied cohorts.
CAP has been used as a tool to noninvasively assess the prevalence of NAFLD in groups at risk or in the general population. It should be highlighted that different CAP cutoffs for the detection of steatosis (S >0) were used in different studies, and this limits the robustness of the findings. Apart from the uncertainty regarding the optimal cutoff of CAP for detection of steatosis, it is likely that an overestimation or underestimation of liver steatosis prevalence might have occurred in the published studies.
CAP, alone or combined with other noninvasive indices or biomarkers, has been proposed as a tool for assessing NASH or as a noninvasive predictor of prognosis in patients with chronic liver disease. Using liver biopsy as the reference, a score (FAST score) that combined liver stiffness, CAP, and aspartate aminotransferase (AST) was derived. The FAST score cutoffs were 0.35 and 0.67 for ruling out and ruling in NASH, an elevated NAFLD activity score, and significant fibrosis, respectively. The positive predictive value ranged from 33% to 81% and the negative predictive value from 73% to 100% in the external validation cohorts.
Of note, in several NAFLD/NASH cases with advanced liver disease, small amounts of fat in the liver have been observed, and the term burnt-out NASH has been proposed. A “protective” effect for the development of a first hepatic decompensation has been reported for CAP value ≥220 dB/m.
It must be highlighted that, before using CAP as tool to noninvasively monitor changes of liver fat content over time, it is important to set what is a meaningful change (i.e., the one that is not the result of a mere chance). In this regard, studies that have assessed the interobserver concordance in the CAP measurements have shown that the mean difference in CAP values between two observers is up to 20 dB/m; therefore, in the follow-up of patients, this difference should be taken into account.
An upgraded CAP algorithm named SmartExam is able to acquire much more data with respect to the previous algorithm and may lead to an improvement in accuracy. This new method uses US signals acquired continuously during the A-mode phase of the examination with the FibroScan device. The major improvements of this new CAP method are the higher number of individual US attenuation measurements (20 times more data) in a larger volume of liver tissue and an automatically adapted measurement depth. The final CAP result is expressed as the mean with the standard deviation.
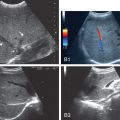
Attenuation imaging (Canon medical systems, Japan)
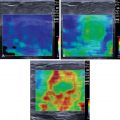
Two-dimensional attenuation imaging (ATI) is the technique implemented in the Aplio i-series US systems. The degree of the attenuation of the US beam is color-coded and obtained in a large ROI in real time. Vessels or strong artifacts are automatically filtered out by the software and appear as colorless areas in the color map. The radiofrequency data are used; thus the influence of the gain and US beam profiles does not affect the calculation of the AC, which is given in decibels per centimeter per megahertz. In the ATI display mode, the B-mode image is shown on the left side and the corresponding ATI color-coded image is shown on the right side. A single measurement box is placed inside the ROI, guided by the B-mode image ( Fig. 11.6 ). A dark orange area, which may be present in the proximal part of the ROI, or dark blue areas posterior to blood vessels or in the distal part of the ROI must not be included in the measurement box as these are artifacts due to reverberation or high noise with weak echo signal by less penetration ( Fig. 11.7 ). As of early 2022, it is suggested that the final AC value is the median of five consecutive measurements. The reliability of the measurement is displayed on the monitor with a linear regression coefficient of determination, or R 2 value: an AC value of best quality is the one with an R 2 ≥0.90 as recommended by the manufacturer. The font color of the ATI measurement and R 2 displayed on the monitor varies with the quality of the measurement. The white font represents high-quality measurement (R 2 ≥0.90), the yellow font represents moderate-quality (0.70< R 2 <0.90) and red font represents low-quality (R 2 <0.70) ( Fig. 11.8 ).