Chapter 5 Normal Mitral Valve Anatomy and Measurements
The complexity of the mitral valve is such that two-dimensional (2D) imaging does not adequately describe its anatomy and function. Indeed, the mitral valve apparatus is a dynamic three-dimensional (3D) structure composed of the saddle-shaped annulus; two asymmetric leaflets; multiple chordae tendineae of various lengths, thicknesses, and points of attachment; the left ventricular wall and the attached papillary muscles; and parts of the left atrium (Figure 5-1). During normal function, this array of parts constantly shifts in a complex but defined pattern. Normal alignment of all aspects of this biologic machine is required to avoid dysfunction. Therefore, full understanding of the mitral valve anatomy is not ascertained without 3D imaging. Real-time 3D echocardiography (RT3DE) gives echocardiographers a rapid and easily accessible method of identifying the entire mitral valve apparatus in most patients. As a prominent structure in the posterior left heart, the mitral valve often can be displayed in 3D using either a transthoracic approach or a transesophageal approach. Furthermore, detailed volumetric and positional analysis of the various mitral valve components often is possible (Table 5-1). RT3DE, however, is a novel modality, and its use in mastering the analysis of the intricate mitral valve requires a substantial time commitment. This chapter highlights the use of RT3DE in imaging the normal mitral valve, demonstrating usual transthoracic and transesophageal views for each of its components. It also provides an overview of typical 3D quantitative analyses of the size and position of the mitral valve structures.
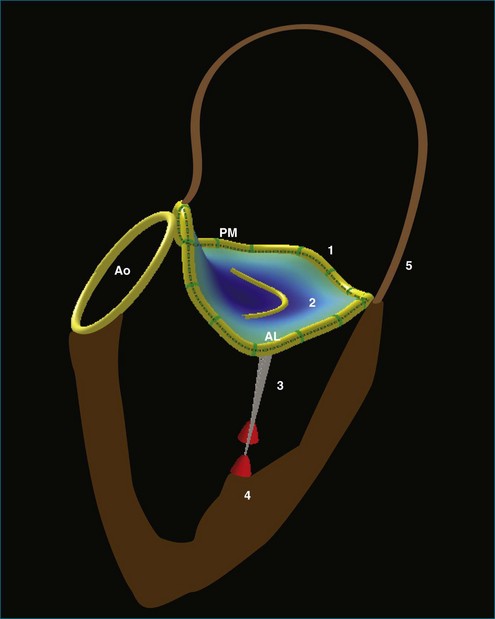
Table 5-1 Key Normal Measurements Obtained by Real-Time Three-Dimensional Echocardiography for Each Mitral Valve Structure
| Key Measurements | Normal Values | Reference |
|---|---|---|
| Mitral Valve Annulus | ||
| Anteroposterior dimension | 30.8 ± 4.4 mm | Sonne et al7 |
| 24 ± 1 mm | Kwan et al41 | |
| Commissural dimension | 35.1 ± 4.9 mm | Sonne et al7 |
| 28 ± 1 mm | Kwan et al41 | |
| Circumference | 10.5 ± 1.4 mm | Sonne et al7 |
| 10.0 ± 0.8 mm | Watanabe et al40 | |
| Height | 4.3 ± 2.1 mm | Sonne et al7 |
| 3.0 ± 1.0 mm | Flachskampf et al12 | |
| 4.5 ± 1.1 mm | Watanabe et al40 | |
| Area/BSA (end diastole) | 4.6 ± 1.3 cm2/m2 | Qin et al10 |
| 5.9 ± 1.2 cm2/m2 | Flachskampf et al12 | |
| Area/BSA (mid systole) | 5.1 ± 0.8 cm2/m2 | Sonne et al7 |
| Area/BSA (end systole) | 3.8 ± 1.1 cm2/m2 | Qin et al10 |
| Area change | 23.8% ± 5.1% | Flachskampf et al12 |
| 15% ± 16% | Qin et al10 | |
| Linear systolic motion | 16 ± 3 mm | Qin et al10 |
| 10 ± 3 mm | Flachskampf et al12 | |
| Mitral Valve Leaflets | ||
| Volume | 4.5 ± 0.7 cm3 | Limbu et al28 |
| Maximum tenting height | 5.3 ± 2.4 mm | Sonne et al7 |
| 3.1 ± 1.2 mm | Watanabe et al40 | |
| 5 ± 0.2 mm | Kalyanasundaram et al5 | |
| Mean tenting height | 1.9 ± 1.5 mm | Sonne et al7 |
| 0.7 ± 0.5 mm | Watanabe et al40 | |
| Tenting volume | 1.5 ± 0.9 cm3 | Sonne et al7 |
| 0.45 ± 0.29 cm3 | Watanabe et al40 | |
| Papillary Muscles (Indexed to BSA) | ||
| AL papillary to annular distance | 21.0 ± 5.8 mm/m2 | Sonne et al7 |
| PM papillary to annular distance | 22.3 ± 5.6 mm/m2 | Sonne et al7 |
| Interpapillary muscle angle | 17.6 ± 9.1 degrees/m2 | Sonne et al7 |
| Interpapillary distance | 10.5 ± 3.3 mm/m2 | Sonne et al7 |
| Left Ventricle | ||
| End-systolic volume | 43.7 ± 10.7 mL | Chukwu et al56 |
| 59 ± 18 mL | Corsi et al69 | |
| 43 ± 18 mL | Zeidan et al70 | |
| 47 ± 6 mL | Nosir et al71 | |
| End-diastolic volume | 115 ± 22.6 mL | Chukwu et al56 |
| 143 ± 30 mL | Corsi et al69 | |
| 108 ± 32 mL | Zeidan et al70 | |
| 113 ± 16 mL | Nosir et al71 | |
| Left Atrium | ||
| End-diastolic volume | 48.9 ± 25.1 cm3 | Azar et al68 |
| End-systolic volume | 62.3 ± 17.2 cm3 | Azar et al68 |
In some cases, values vary due to technique and studied population.
AL, anterolateral; BSA, body surface area; PM, posteromedial.
Mitral Valve Annulus
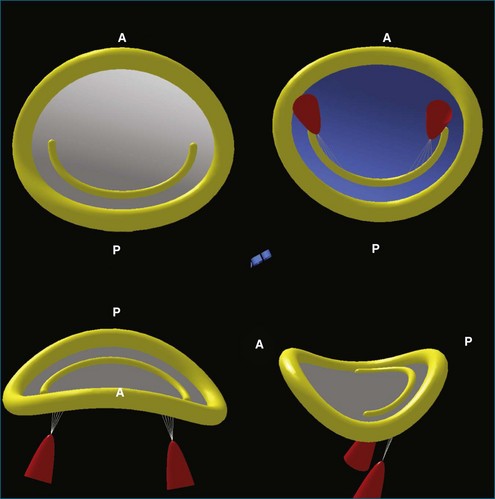
3DE has increased the understanding of the anatomy of the mitral valve annulus more than that of any other structure in the heart. 3D reconstructions identified the mitral valve annulus as a hyperbolic paraboloid or a saddle-shaped structure with curved planes parallel to the anteroposterior axis opening upward and orthogonal curved planes that open downward (Figure 5-2).1 This complex shape is not appreciated on 2D imaging, which tends to simplify the annulus as a planar ring. In fact, the anterior and posterior portions of the mitral valve annulus are about 5 mm higher than the medial and lateral commissural points.1 This height, along with the commissural diameter (the distance between the two low points) and the anteroposterior diameter (the distance between the two high points), can be easily measured with 3D imaging. The nonplanar shape of the mitral valve annulus is very important in reducing leaflet stress, which is increased when the annulus flattens.2 As such, the hyperbolic paraboloid annular shape with a height/commissural width ratio of 15% to 20% is preserved in many mammalian species, including humans.2–4
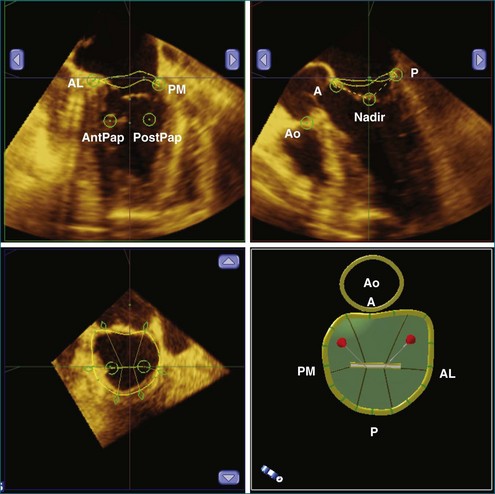
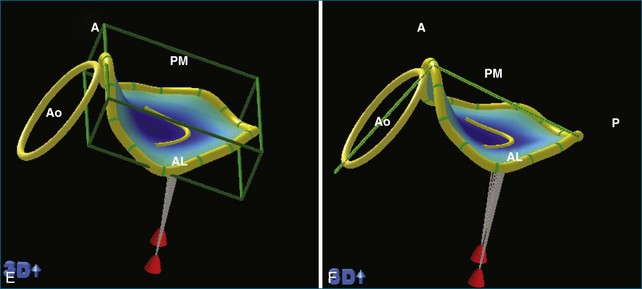
RT3DE is fundamental to clarifying annular geometry. In fact, obtaining accurate annular dimensions is best done with 3D datasets because 2DE underestimates these values by 6% to 14%.5 The mitral valve annulus is best seen using the large-sector (3D full volume) and wide-sector focused (3D zoom) formats. In particular, computer remodeling from large-sector datasets can quickly measure and display these changes without requiring the time-consuming reconstructions from multiple 2D images. 3D volume data can be obtained from either transthoracic or transesophageal exams. These models are obtained offline by tracing the mitral valve annulus contours in relation to other structures (such as the papillary muscles and aortic valve) in several 3D views (Figure 5-3). From these computer renditions, several annular dimensions, including circumference, anteroposterior (high-point) dimension, commissural (low-point) dimension, height, and annular area, can be measured (Figure 5-4).6

Recognizing the mitral valve annulus as a nonplanar structure is very important to understanding mitral valve function. For example, the complex shape of the mitral valve annulus has led to the overdiagnosis of mitral valve prolapse with 2DE. In certain 2D views, particularly the apical four-chamber view, which shows the mitral valve annulus in mediolateral directions, the leaflets appear to be on the atrial side of the mitral valve annulus, when, in fact, they are still inferior to the high anterior and posterior points. In 2DE imaging without fully realizing the nonplanarity of the mitral valve annulus, this normal anatomy can be mischaracterized as mitral valve prolapse.1
RT3DE has also shown that annular area significantly depends on body size and height.7 The normal diastolic mitral valve area (which is a projection onto the least squares plane) is 5 to 6.5 cm2 (indexed to body service area).8 The mitral valve annulus, however, is a dynamic structure whose complex motion throughout the cardiac cycle has not been fully ascertained.9–11 On the basis of early studies in 3DE from 2D renditions, it was believed that the mitral valve area decreases during systole by up to 24%, which is thought to occur as the anterior and lateral high points move closer together, increasing the height and eccentricity of the annulus.8,12 In addition to a decrease in annular area, there is a significant apical displacement of the annulus during systole, with an average annular motion of 16 ± 3 mm in normal hearts.10
Recent investigations using RT3DE with volumetric reconstructions have further characterized this motion in both normal ventricles and those with cardiomyopathy. In disease states, the shape and dynamic function of the mitral valve can change dramatically. For example, in dilated cardiomyopathy, especially with functional mitral regurgitation, the annulus flattens, dilates, and becomes more circular.8 These annuli also demonstrate less dynamic variability. During systole, they may have less change in height and diameter, leading to a smaller change in the projected valve area.12,13 Most significantly, those with cardiomyopathy have less apical excursion during systole. In fact, the degree of annular displacement correlates well with ejection fraction; a linear motion less than 12 mm accurately identifies those with an ejection fraction less than 50%.10
Mitral Valve Leaflets
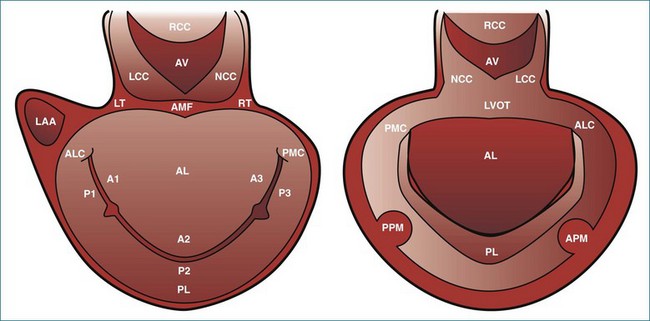
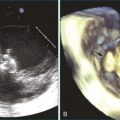
Like the annulus, the attached mitral valve leaflets are 3D dynamic structures. The anterior leaflet covers two thirds of the orifice and is attached to the part of anterior annulus adjacent to the aortic valve near the right fibrous trigone, aortic-mitral fibrosa, and left fibrous trigone (Figure 5-5). The posterior leaflet, although smaller, covering only one third of the mitral orifice, is semicircular in shape and borders most of the annulus from one commissure to the other.6 Figure 5-5 shows the mitral valve leaflets and related cardiac structures as seen from the left atrium (the surgeon’s view) and the left ventricle. Each leaflet is composed of three scallops. Scallops A1 and P1 are the most lateral, located near the left atrial appendage; the middle scallops, A2 and P2, are the most posterior; and A3 and P3 are the most medial.
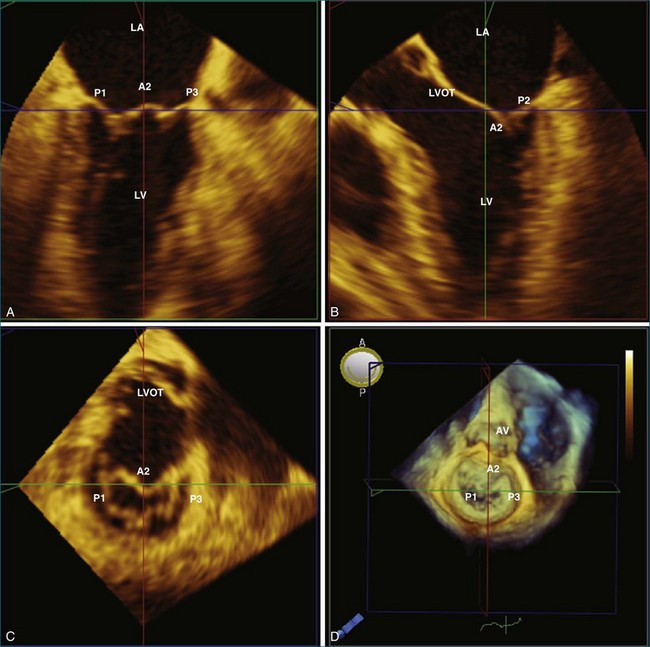
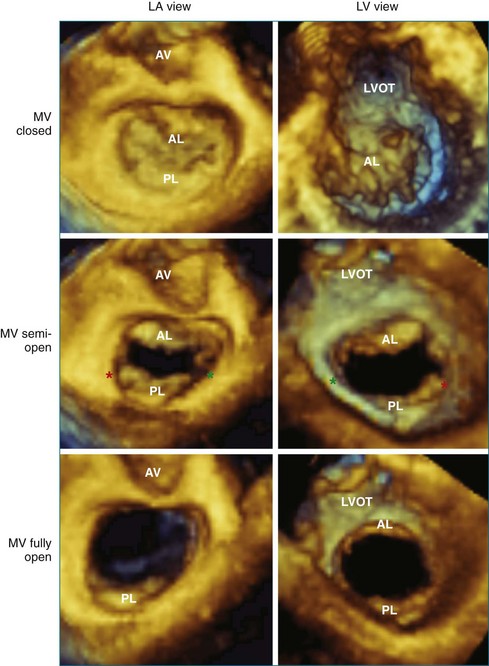
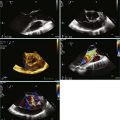
With 3DE, all six scallops of the mitral valve leaflets can be clearly visualized from either the left atrium or the left ventricle. These views can be obtained offline from cropping 3D full-volume (large-sector) datasets, which can be obtained by either a transthoracic or a transesophageal approach (Figure 5-6 and Video 5-1). During transesophageal exams, the 3D zoom (wide-sector focused) format also is helpful, especially to obtain real-time information on leaflet function during surgery or catheter procedures. In this case, the images are obtained by identifying the entire mitral valve on orthogonal biplane 2D images. The resulting 3D zoom display is rotated with the aortic valve in the 12 o’clock position to obtain the surgeon’s view from the left atrium. In this view, normal systolic bulging of the central part of the anterior leaflet can be visualized. When this image is flipped 180 degrees, the leaflet scallops are displayed as viewed from the left ventricle (Figure 5-7). In transthoracic exams, similarly detailed 3D images also can be obtained. Figure 5-8 demonstrates how clearly the mitral valve leaflets can be displayed from a 3D full-volume dataset acquired during a transthoracic exam. In this case, the image is rotated and the vertical axis is cropped from the atrial side to obtain the surgeon’s view. By flipping the image 180 degrees and cropping from the ventricular side, the valve leaflets can be seen as viewed from the apex in relation to the commissures and papillary muscles.
Related posts:
 Integration of Three-Dimensional Echocardiography in Routine Clinical Practice
 Three-Dimensional Transesophageal Echocardiography Systems
 Evaluation of the Aortic Valve
 Guidance of Catheter-Based Cardiac Interventions
 Historical Perspective on Three-Dimensional Echocardiography
 Evaluation of Intracardiac Masses
Stay updated, free articles. Join our Telegram channel

Full access? Get Clinical Tree


