Nuclear Transformations
2.1. RADIOACTIVITY
Radioactivity, first discovered by Antonio Henri Becquerel (1852 to 1908) in 1896, is a phenomenon in which radiation is given off by the nuclei of the elements. This radiation can be in the form of particles, electromagnetic radiation, or both.
Figure 2.1 illustrates a method in which radiation emitted by radium can be separated by a magnetic field. Since α particles (helium nuclei) are positively charged and β− particles (electrons) are negatively charged, they are deflected in opposite directions. The difference in the radii of curvature indicates that α particles are much heavier than β particles. On the other hand, γ rays, which are similar to x-rays except for their nuclear origin, have no charge and, therefore, are unaffected by the magnetic field.
It was mentioned in Chapter 1 (Section 1.6) that there is a potential barrier preventing particles from entering or escaping the nucleus. Although the particles inside the nucleus possess kinetic energy, this energy, in a stable nucleus, is not sufficient for any of the particles to penetrate the nuclear barrier. However, a radioactive nucleus has excess energy that is constantly redistributed among the nucleons by mutual collisions. As a matter of probability, one of the particles may gain enough energy to escape from the nucleus, thus enabling the nucleus to achieve a state of lower energy. Also, the emission of a particle may still leave the nucleus in an excited state. In that case, the nucleus will continue stepping down to lower energy states by emitting particles or γ rays until the stable (ground) state has been achieved.
2.2. DECAY CONSTANT
The process of radioactive decay or disintegration is a statistical phenomenon. Whereas it is not possible to know when a particular atom will disintegrate, one can accurately predict, in a large collection of atoms, the proportion that will disintegrate in a given time. The mathematics of radioactive decay is based on the simple fact that the change in the number of atoms per unit time, (δN/δt), is proportional to the number of radioactive atoms, (N) present. Mathematically,

where λ is a constant of proportionality called the decay constant. The minus sign indicates that the number of the radioactive atoms present decreases with time.
If δN and δt are so small that they can be replaced by their corresponding differentials, dN and dt, then Equation 2.1 becomes a differential equation. The solution of this equation yields the following equation:
where N0 is the initial number of radioactive atoms and e is the number denoting the base of the natural logarithm (e ≈ 2.718). Equation 2.2 is the well-known exponential equation for radioactive decay.
2.3. ACTIVITY
The number of disintegrations per unit time is referred to as the activity of a radioactive material. If δN/δt in Equation 2.1 is replaced by A, the symbol for activity, then
where the negative sign in Equation 2.1 has been left off because activity is the disintegration rate rather the change in the number of atoms.
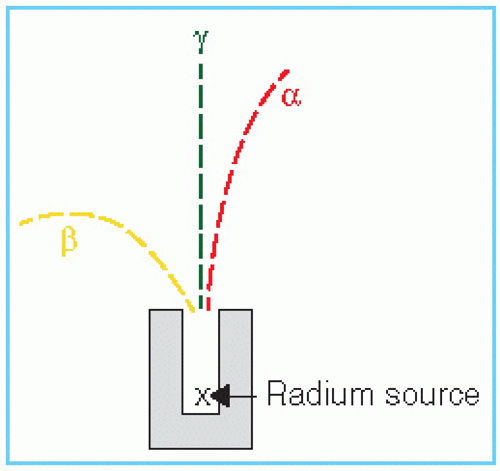 Figure 2.1. Diagrammatic representation of the separation of three types of radiation emitted by radium under the influence of magnetic field (applied perpendicular to the plane of the paper). |
Similarly, Equation 2.2 can be expressed in terms of activity:
where A is the activity remaining at time t, and A0 is the original activity equal to λN0.
The SI unit for activity is becquerel (Bq), defined as one disintegration per second (dps). In radiation therapy, a more common unit of activity is the curie (Ci), defined as
1 Ci = 3.7 × 10¹⁰ Bq1
Fractions of this unit are
1 mCi= 10-3 Ci = 3.7 × 10⁷ Bq
1 µCi = 10-6 Ci = 3.7 × 10⁴ Bq
1 nCi = 10-9 Ci = 3.7 × 101 Bq
1 pCi= 10-12 Ci = 3.7 × 10⁻² Bq
1This definition is based on the rate of decay of 1 g of radium which was originally measured to be 3.7 × 10¹⁰ dps. Although the recent measurements have established the decay rate as 3.61 × 10¹⁰ dps/g of radium, the original definition of curie remains unchanged.
2.4. THE HALF-LIFE AND THE MEAN LIFE
The term half-life (T1/2) of a radioactive substance is defined as the time required for either the activity or the number of radioactive atoms to decay to half the initial value. By substituting N/N0 = ½ in Equation 2.2 or A/A0 = ½ in Equation 2.4, at t = T1/2, we have

where ln 2 is the natural logarithm of 2 having an approximate value of 0.693. By replacing ln 2 above by 0.693, we get

Figure 2.2A illustrates the exponential decay of a radioactive sample as a function of time, expressed in units of half-life. It can be seen that after one half-life, the activity is ½ the initial value, after two half-lives, it is ¼, and so on. Thus, after n half-lives, the activity will be reduced to ½n of the initial value.
Although an exponential function can be plotted on a linear graph (Fig. 2.2A), it is better plotted on a semilog paper because it yields a straight line, as demonstrated in Figure 2.2B. This general curve applies to any radioactive material and can be used to determine the fractional activity remaining if the elapsed time is expressed as a fraction of half-life.
The mean or average life (Ta) is the average lifetime of a radioactive atom before it decays. It is the sum of the lifetimes of all the individual nuclei divided by the total number of nuclei involved. Although, in theory, it will take an infinite amount of time for all the atoms to decay, the concept of average life can be understood in terms of an imaginary source that decays at a constant rate equal to the initial activity of the exponentially decaying source. Such a source would produce the same total number of disintegrations in time Ta as the given source decaying exponentially from time t = 0 to t = ∞. Because the initial activity = λN0 (from Equation 2.3),
the imaginary source would produce a total number of disintegrations = TaλN0. Also because the total number of disintegrations must be equal to N0, we have
the imaginary source would produce a total number of disintegrations = TaλN0. Also because the total number of disintegrations must be equal to N0, we have
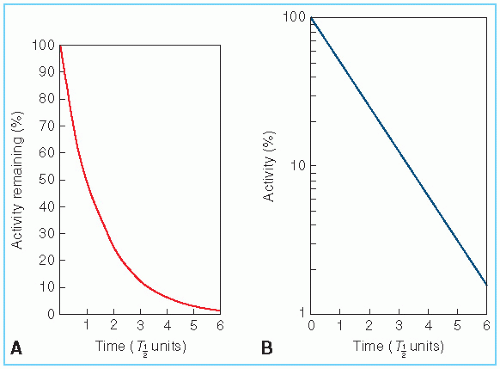 Figure 2.2. General decay curve. Activity as a percentage of initial activity plotted against time in units of half-life. A: Plot on inear graph; B: Plot on semilogarithmic graph. |

Comparing Equations 2.5 and 2.6, we obtain the following relationship between half-life and average life:
EXAMPLE 1
1. Calculate the number of atoms in 1 g of 226Ra.
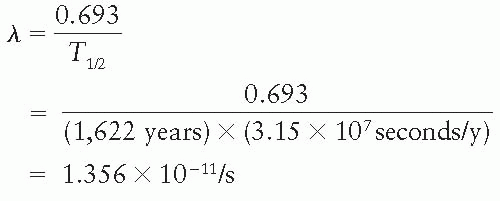
2. What is the activity of 1 g of 226Ra (half-life = 1,622 years)?
a. In Section 1.3, we showed that

where NA is Avogadro’s number (6.02 × 10²³ atoms per gram atomic weight) and AW is the atomic weight. Also, we stated in the same section that Aw is very nearly equal to the mass number. Therefore, for 226Ra

Therefore,
Activity = 2.66 × 1021 × 1.356 × 10-11 dps/g
= 3.61 × 10¹⁰ dps/g
= 0.975 Ci/g
The activity per unit mass of a radionuclide is termed the specific activity. As shown in the previous example, the specific activity of radium is slightly less than 1 Ci/g, although the curie was originally defined as the decay rate of 1 g of radium. The reason for this discrepancy, as mentioned previously, is the current revision of the actual decay rate of radium without modification of the original definition of the curie.
High specific activity of certain radionuclides can be advantageous for a number of applications. For example, the use of elements as tracers in studying biochemical processes requires
that the mass of the incorporated element should be so small that it does not interfere with the normal metabolism and yet it should exhibit measurable activity. Another example is the use of radioisotopes as teletherapy sources. One reason why cobalt-60 is preferable to cesium-137, in spite of its lower half-life (5.26 years for 60Co vs. 30.0 years for 137Cs), is its much higher specific activity. The interested reader may verify this fact by actual calculations. (It should be assumed in these calculations that the specific activities are for pure forms of the nuclides.)
that the mass of the incorporated element should be so small that it does not interfere with the normal metabolism and yet it should exhibit measurable activity. Another example is the use of radioisotopes as teletherapy sources. One reason why cobalt-60 is preferable to cesium-137, in spite of its lower half-life (5.26 years for 60Co vs. 30.0 years for 137Cs), is its much higher specific activity. The interested reader may verify this fact by actual calculations. (It should be assumed in these calculations that the specific activities are for pure forms of the nuclides.)
EXAMPLE 2
1. Calculate the decay constant for cobalt-60 (T1/2 = 5.26 years) in units of month-1.
2. What will be the activity of a 5,000-Ci 60Co source after 4 years?
a. From Equation 2.5, we have

since T½ = 5.26 years = 63.12 months. Therefore,

b. t = 4 years = 48 months. From Equation 2.4, we have
A = A0e-λt
= 5,000 × e-1.0979 × 10-2 × 48
= 2,952 Ci
Alternatively,

Therefore,

Alternatively, reading the fractional activity from the universal decay curve given in Figure 2.2 at time = 0.760T1/2 and then multiplying it with the initial activity, we get the desired answer.
EXAMPLE 3
When will 5 mCi of 131I (T1/2 = 8.05 days) and 2 mCi of 32P (T1/2 = 14.3 days) have equal activities? For 131I,
A0 = 5 mCi
and

For 32 P,
A0 = 2 mCi
and

Suppose the activities of the two nuclides are equal after t days. Then, from Equation 2.4,
5 × e-8.609 × 10⁻² × t
Taking the natural log of both sides,
ln 5 – 8.609 × 10⁻² × t = ln 2 – 4.846 × 10⁻² × t
or 1.609 – 8.609 × 10⁻² × t = 0.693 – 4.846 × 10⁻² × t
or t = 24.34 days
Alternatively, one may plot the activity of each sample as a function of time. The activities of the two samples will be equal at the time when the two curves intersect each other.
2.5. RADIOACTIVE SERIES
There are a total of 118 elements known today. Of these, the first 92 (from Z = 1 to Z = 92) occur naturally. The others have been produced artificially. In general, the elements with lower Z tend to be stable whereas the ones with higher Z are radioactive. It appears that as the number of particles inside the nucleus increases, the forces that keep the particles together become less effective and, therefore, the chances of particle emission are increased. This is suggested by the observation that all elements with Z greater than 82 (lead) are radioactive.
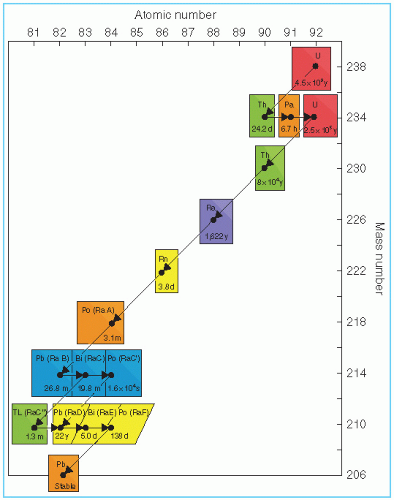
All naturally occurring radioactive elements have been grouped into three series: the uranium series, the actinium series, and the thorium series. The uranium series originates with 238U having a half-life of 4.51 × 10⁹ years and goes through a series of transformations involving the emission of α and β particles, λ rays are also produced as a result of some of these transformations. The actinium series starts from 235U with a half-life of 7.13 × 10⁸ years and the thorium series begins with 232Th with half-life of 1.39 × 10¹⁰ years. All the series terminate at the stable isotopes of lead with mass numbers 206, 207, and 208, respectively. As an example and because it includes radium as one of its decay products, the uranium series is represented in Figure 2.3.
2.6. RADIOACTIVE EQUILIBRIUM
Many radioactive nuclides undergo successive transformations in which the original nuclide, called the parent, gives rise to a radioactive product nuclide, called the daughter. The naturally occurring radioactive series provides examples of such transitions. If the half-life of the parent is longer than that of the daughter, then after a certain time, a condition of equilibrium will be achieved, that is, the ratio of daughter activity to parent activity will become constant. In addition, the apparent decay rate of the daughter nuclide is then governed by the half-life or disintegration rate of the parent.
Two kinds of radioactive equilibria have been defined, depending on the relative half-lives of the parent and the daughter nuclides. If the half-life of the parent is not much longer than that of the daughter, then the type of equilibrium established is called the transient equilibrium. On the other hand, if the half-life of the parent is much longer than that of the daughter, then it can give rise to what is known as the secular equilibrium.
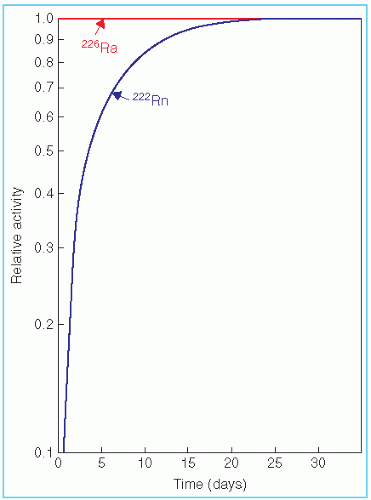
Figure 2.4 illustrates the transient equilibrium between the parent 99Mo (T1/2 = 67 h) and the daughter 99mTc (T1/2 = 6 h). The secular equilibrium is illustrated in Figure 2.5 showing the case of 222Rn (T1/2 = 3.8 days) achieving equilibrium with its parent, 226Ra (T1/2 = 1,622 years).
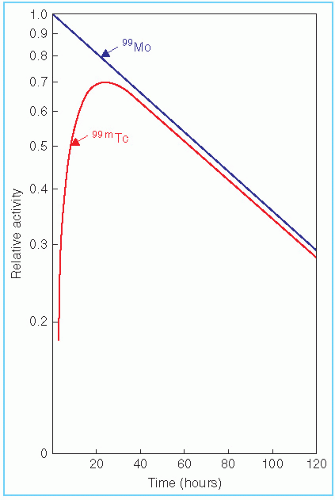 Figure 2.4. Illustration of transient equilibrium by the decay of 99Mo to 99mTc. It has been assumed that only 88% of the 99Mo atoms decay to 99mTc. |
A general equation can be derived relating the activities of the parent and daughter:

where A1 and A2 are the activities of the parent and the daughter, respectively. λ1 and λ2 are the corresponding decay constants. In terms of the half-lives, T1 and T2


Stay updated, free articles. Join our Telegram channel

Full access? Get Clinical Tree


