Obstetric Ultrasound First Trimester
The first trimester covers the period from conception to the end of the 13th menstrual week. This is a time of dynamic growth and the differentiation and development of most organ systems. The embryo has the greatest risk of maldevelopment, injury, and death during this period because of external factors (infection, drugs, radiation) or chromosome abnormalities. Approximately 40% of implanted zygotes are lost as a result of unrecognized abortion with menstruation, whereas another 25-35% of the surviving embryos will threaten to abort during the first trimester. Approximately 1-2% of pregnancies will be ectopic, and these pregnancies are a major cause of pregnancy-related morbidity and mortality. Patients presenting with vaginal bleeding or pelvic pain in early pregnancy require urgent and accurate diagnosis (Box 6.1).
Imaging Technique
US remains the imaging method of first choice for diagnostic evaluations in obstetrics. Transvaginal (TV) US is particularly valuable in the first trimester because of its capability to demonstrate in high resolution the detailed anatomic changes of early pregnancy.
Examinations are usually begun using a transabdominal (TA) approach scanning the pelvis through a full bladder with a 3.5-5.0-MHz sector transducer. In our practice, if this examination demonstrates a normal-appearing intrauterine pregnancy with no adnexal abnormalities, the examination is considered satisfactory and is terminated. If the TA examination yields any other result, then TV examination is performed whenever possible. The patient is asked to empty her bladder and the examination continues utilizing a condom-covered 5.0-7.5-MHz intravaginal transducer.
Guidelines for first trimester sonography are provided by the American Institute of Ultrasound in Medicine and endorsed by the American College of Radiology [1]. The location of the gestational sac (GS) is documented. The embryo is identified and its crownrump
length (CRL) measured. If no embryo is present the mean diameter of the GS is measured. Gestational age (GA) is estimated by reference of the measurements made to appropriate tables. The presence or absence of embryonic life is determined by real-time observation. M-mode US is utilized to document cardiac activity and to measure cardiac rate. Doppler confirmation of embryonic cardiac activity is not recommended because of the higher US energy involved. Fetal number is documented. The uterus, cervix, and adnexa are carefully examined for any abnormalities.
length (CRL) measured. If no embryo is present the mean diameter of the GS is measured. Gestational age (GA) is estimated by reference of the measurements made to appropriate tables. The presence or absence of embryonic life is determined by real-time observation. M-mode US is utilized to document cardiac activity and to measure cardiac rate. Doppler confirmation of embryonic cardiac activity is not recommended because of the higher US energy involved. Fetal number is documented. The uterus, cervix, and adnexa are carefully examined for any abnormalities.
Normal First Trimester Pregnancy
Gestational Dating
In clinical obstetrics GA is determined from the first day of the mother’s last menstrual period, assuming a regular menstrual cycle of 28 days. In embryology, GA is dated from conception providing a 2-week difference in embryologic dating compared with menstrual dating. In clinical practice and in this text all dating parameters will refer to menstrual dating. For example, 13 weeks GA means that 13 weeks have elapsed since the first day of the mother’s last menstrual period. Technically, the developing human is considered an embryo up to 10 weeks menstrual age and a fetus thereafter until birth. Normal pregnancies last 40 weeks with a range of 37-42 weeks.
In the first trimester, GA is determined by measurement of mean sac diameter (MSD) before the embryo is visualized and by measurement of CRL from when the embryo is apparent to 12 weeks GA. MSD is determined by measuring the length (L), width (W), and height (H) of the GS in perpendicular planes, adding the results together and dividing by 3 (MSD = [L + W + H]/3). Measurements of MSD are made from the fluid/tissue interface of the sac and do not include any portion of the wall of the sac (Fig. 6.1). CRL is determined by measuring the maximum length of the visualized embryo (Fig. 6.2). No portion of the yolk sac, umbilical cord, or limbs is included in the measurement. A straight-line measurement is always used even if the torso of the embryo is flexed. Appropriate charts relate the measurements to menstrual age (Table 6.1) [2,3]. Both MSD and CRL measurements are accurate to ±1 week. These early pregnancy charts are acceptably accurate in the first trimester without correction for race, parental size, altitude, or other parameters known to affect birth weight.
Normal Gestation
Understanding the physiology and detailed anatomy of early gestation as shown by TV US is essential to understanding the pathologic changes that occur in early pregnancy.
Ovulation and Fertilization
In a “normal” menstrual cycle of 28 days, days 1-14 are the follicular phase during which the ovary responds to follicle stimulating hormone (FSH) secreted by the pituitary gland [4]. FSH promotes development of a group of follicles that enlarge and produce and release estrogen.
Rising estrogen levels suppress secretion of FSH, resulting in atresia of all but one of the stimulated follicles. This dominant follicle (graafian follicle) continues to mature and enlarge and will be the source of ovulation. Ovulation occurs around day 14 (range, day 10-18) when the dominant follicle ruptures, releasing the ovum and a small amount of fluid into the peritoneal cavity. The corpus luteum develops at the site of the dominant follicle, forming a highly vascular mass that often becomes cystic as it fills with blood and lymph. The corpus luteum produces progesterone that maintains the secretory phase endometrium for successful implantation during the second half of the menstrual cycle. If fertilization of the ovum fails to occur, the corpus luteum will degenerate within 14 days. If fertilization occurs, human chorionic gonadotropin (hCG) from the fertilized ovum stimulates the corpus luteum to continue hormone secretion to support the developing pregnancy. The corpus luteum continues to function through the tenth week of gestation when the placenta replaces its hormone production. The corpus luteum may persist as a visible structure throughout pregnancy and must be recognized and differentiated from pathologic structures.
Rising estrogen levels suppress secretion of FSH, resulting in atresia of all but one of the stimulated follicles. This dominant follicle (graafian follicle) continues to mature and enlarge and will be the source of ovulation. Ovulation occurs around day 14 (range, day 10-18) when the dominant follicle ruptures, releasing the ovum and a small amount of fluid into the peritoneal cavity. The corpus luteum develops at the site of the dominant follicle, forming a highly vascular mass that often becomes cystic as it fills with blood and lymph. The corpus luteum produces progesterone that maintains the secretory phase endometrium for successful implantation during the second half of the menstrual cycle. If fertilization of the ovum fails to occur, the corpus luteum will degenerate within 14 days. If fertilization occurs, human chorionic gonadotropin (hCG) from the fertilized ovum stimulates the corpus luteum to continue hormone secretion to support the developing pregnancy. The corpus luteum continues to function through the tenth week of gestation when the placenta replaces its hormone production. The corpus luteum may persist as a visible structure throughout pregnancy and must be recognized and differentiated from pathologic structures.
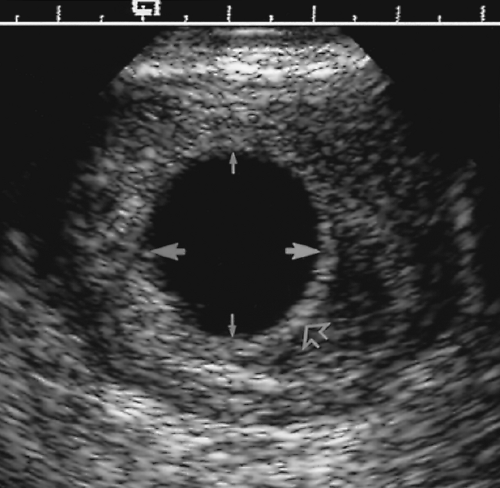 Figure 6. 1 Measurement of Mean Sac Diameter. The diameter of the gestational sac is measured between fluid-soft tissue interfaces (between pairs of closed arrows). No portion of the wall of the sac is included. Three orthogonal measurements are made in perpendicular imaging planes. These three measurements are averaged to calculate mean sac diameter. Standardized tables (Table 6.1) are consulted to relate mean sac diameter to gestational age. Most US scanners provide these tables in the computer memory. The choriodecidual reaction (open arrow) that defines the wall of the gestational sac is well defined and uniformly echogenic. |
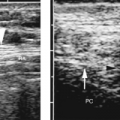
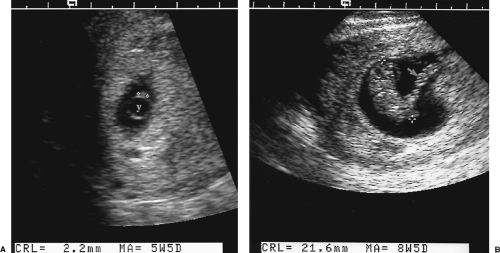 Figure 6. 2 Measurement of Crown-Rump Length. The crown-rump length is measured as the maximum length of the visualized embryo (between cursors, +) when the embryo is small (A). When the embryo is larger (B), crown-rump length is measured as the straight-line distance from the top of the cranium to the end of the torso (between cursors, +) of the embryo. No compensation is made for curvature of the embryo. Care must be taken to avoid including limbs or cord in the measurement. Standardized tables (Table 6.1) relate the crown-rump length measurement to gestational age. The umbilical cord (arrow) is visualized. y, yolk sac. |
Table 6.1: Gestational Age Estimation | |||||||||||||||||||||||||||||||||||||||||||||||||||||||||||||||||||||||||||||||||||||||||||||||||||||||||||||||||||||||||||||||||||||||||||||||||||||||||||||||||||||
|---|---|---|---|---|---|---|---|---|---|---|---|---|---|---|---|---|---|---|---|---|---|---|---|---|---|---|---|---|---|---|---|---|---|---|---|---|---|---|---|---|---|---|---|---|---|---|---|---|---|---|---|---|---|---|---|---|---|---|---|---|---|---|---|---|---|---|---|---|---|---|---|---|---|---|---|---|---|---|---|---|---|---|---|---|---|---|---|---|---|---|---|---|---|---|---|---|---|---|---|---|---|---|---|---|---|---|---|---|---|---|---|---|---|---|---|---|---|---|---|---|---|---|---|---|---|---|---|---|---|---|---|---|---|---|---|---|---|---|---|---|---|---|---|---|---|---|---|---|---|---|---|---|---|---|---|---|---|---|---|---|---|---|---|---|---|
| |||||||||||||||||||||||||||||||||||||||||||||||||||||||||||||||||||||||||||||||||||||||||||||||||||||||||||||||||||||||||||||||||||||||||||||||||||||||||||||||||||||
Primordial follicles are too small to see with US [4].
Developing follicles appear as thin-walled, anechoic cysts that may enlarge up to 14 mm. These follicles are randomly distributed over the surface of the ovary (see Figs. 5.6 and 5.29). They are seen most prominently during cycle days 5-7.
A follicle larger than 14 mm is likely to be the dominant follicle, which continues to enlarge up to 25-30 mm prior to ovulation. In 5-11% of menstrual cycles, dominant follicles develop on each ovary.
Rupture of the dominant follicle with ovulation results in partial or complete collapse of its cystic structure (Fig. 6.3). Clotted blood and invading fibroblasts occupy the site, which appears as a partially collapsed cyst with wrinkled walls or as an echogenic mass. Fluid volume in the cul-de-sac averages 15-25 mL following ovulation [4].
The corpus luteum initially appears as small irregular cyst containing echogenic blood products (the corpus hemorrhagicum). In most patients the corpus luteum disappears with menstruation. In some patients it continues to enlarge through menstruation up to approximately 40-mm size. This persistent corpus luteum appears as a cystic structure containing anechoic fluid or fluid with particulate matter. It usually disappears within 1 or 2 subsequent menstrual cycles.
The corpus luteum of pregnancy is nearly always identified (98%) with TV US but has a variety of appearances [5,6]:
Identification of origin of the corpus luteum on the ovary is key to its recognition and differentiation from other similar appearing structures.
Size of the corpus luteum averages 2 cm and varies up to 5-6 cm.
A solid-appearing hypoechoic structure on the ovary is most common (34%) (Fig. 6.4).
A cyst containing anechoic fluid and having a thick wall is seen in 27% (Fig. 6.5).
A cyst with floating debris and particulate matter is present in 23%.
A thin-walled cyst with anechoic fluid is seen in 15% (Fig. 6.6).
Intense blood flow surrounds the corpus luteum on color Doppler and may resemble the intense trophoblastic flow surrounding a GS (see Fig. 6.22). Spectral Doppler shows a low-resistance, spectral pattern with mean resistance index of 0.50.
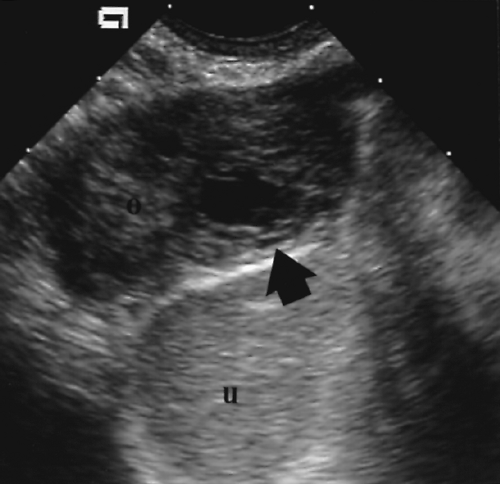 Figure 6. 3 Early Corpus Luteum. The site of rupture of the dominant follicle soon after ovulation appears as a collapsed cystic structure (arrow) on the ovary (o). u, uterus. |
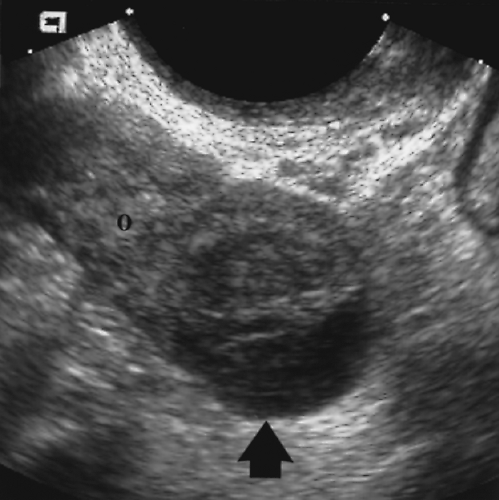 Figure 6. 4 Corpus Luteum–Hypoechoic Solid Appearance. The corpus luteum appears as a hypoechoic solid mass (arrow) on the right ovary (o) on this transvaginal image. |
Implantation and Early Appearance of the Gestational Sac
A zygote is formed when a sperm fertilizes the ovum, usually in the ampullary portion of the fallopian tube. Cell division occurs as the zygote migrates to the endometrial cavity. A
cystic structure called the blastocyst is formed with two cell layers present. The outer cell layer is the trophoblast that forms the chorion and the fetal components of the placenta. The inner cell layer forms the embryo, umbilical cord, amnion and secondary yolk sac. The blastocyst implants 7-10 days after fertilization (around menstrual day 23) by burrowing into the endometrium. The thickened, secretory-phase endometrium, characteristic of the second half of the menstrual cycle, begins to secrete glycogen rich in mucin to support the pregnancy. The thickening and functional change of the endometrium in response to pregnancy is called decidual reaction, and the endometrium is now called decidua. The blastocyst continues to develop forming a recognizable GS completely covered by decidua.
cystic structure called the blastocyst is formed with two cell layers present. The outer cell layer is the trophoblast that forms the chorion and the fetal components of the placenta. The inner cell layer forms the embryo, umbilical cord, amnion and secondary yolk sac. The blastocyst implants 7-10 days after fertilization (around menstrual day 23) by burrowing into the endometrium. The thickened, secretory-phase endometrium, characteristic of the second half of the menstrual cycle, begins to secrete glycogen rich in mucin to support the pregnancy. The thickening and functional change of the endometrium in response to pregnancy is called decidual reaction, and the endometrium is now called decidua. The blastocyst continues to develop forming a recognizable GS completely covered by decidua.
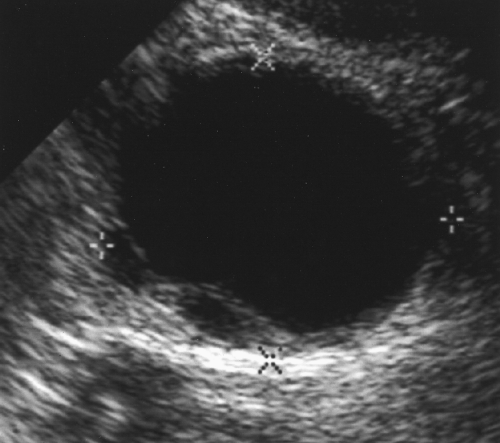 Figure 6. 5 Corpus Luteum–Thick-Walled Cyst Appearance. Transvaginal scan shows an anechoic ovarian cyst (between calipers, +, x) with moderately thick walls. |
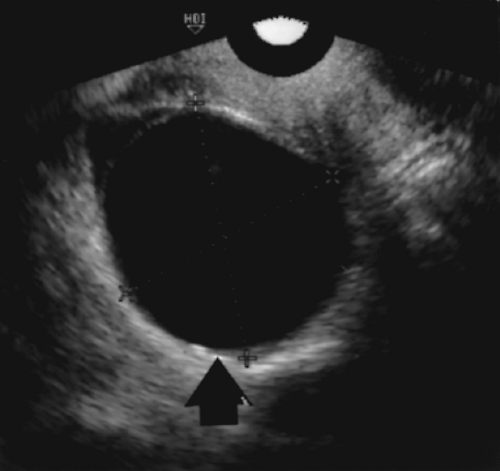 Figure 6. 6 Corpus Luteum–Thin-Walled Cyst Appearance. This corpus luteum (arrow, between cursors, +, x) has a thin wall and contains anechoic fluid. |
The early GS is first visible by TV US at approximately 4.5 weeks menstrual age. A small cystic structure 2-3 mm in size is seen burrowed into and completely covered by echogenic decidua, giving it the appearance of a thick-walled cyst (Fig. 6.7). The appearance of this very early GS is called the intradecidual sign [7]. This appearance is highly characteristic of early intrauterine pregnancy, although care must be taken to avoid mistaking fluid in the uterine cavity or an endometrial cyst for an early GS [8]. The thin
echogenic line of the uterine cavity must be recognized and observed to pass by, rather than meet, the sac burrowed in the decidual lining [9]. A fluid collection that meets or forms a beak with the uterine cavity line represents fluid in the uterine cavity and not an intradecidual GS. Endometrial cysts are found close to the basal layer of the endometrium and have a thin wall (Fig. 6.8), rather than the thick wall characteristic of a GS.
The secondary yolk sac is the first structure visible within the GS and is a finding that unequivocally confirms identification of the GS (Fig. 6.9). The yolk sac is usually visible by TV US at the start of the sixth menstrual week when the GS measures 8-10 mm. It serves a primary source of nutrients for the embryo before placental function is established. The yolk sac should always be visible on TA US when the GS measures 20-mm MSD [10]. It should always be seen with TV US when the GS measures 8-mm diameter [11]. The normal yolk sac is a thin-walled, fluid-filled cyst that does not normally exceed 6 mm in diameter [12]. The yolk sac is located in the chorionic cavity (Fig. 6.10). It is connected to the umbilicus of the embryo by the vitelline duct (omphalomesenteric duct).
The double bleb sign describes the early appearance of the amniotic cavity and the yolk sac seen as early as 5.5 weeks [13]. The yolk sac and amniotic cavity appear as two fluid-filled, thin-walled, spherical structures approximately equal in size within the GS (Fig. 6.11).
The embryo is first visualized as an echogenic, disk-like structure approximately 2 mm long within the amniotic cavity. The embryo is normally seen by the end of the fifth menstrual week (Figs. 6.2A, 6.11). The normal embryo grows approximately 1 mm per day in length.
Embryonic cardiac activity may be seen with TV US when the embryo is as small as 1-2 mm. All normal embryos should have cardiac activity visible on TV US when the embryo measures 5 mm or more in length [14]. Initial visible embryonic heart rate at 5-6 weeks GA is 100 beats/minute. The rate increases over the next 2-3 weeks to 140 beats/minute [15].
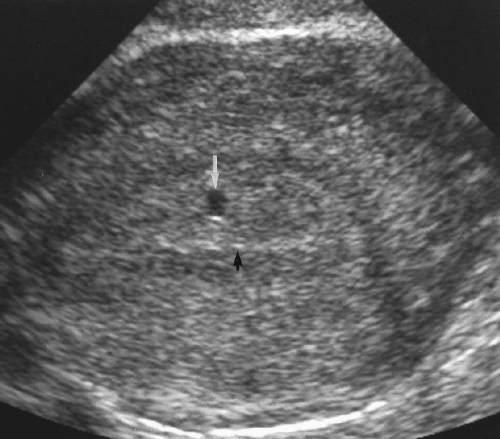 Figure 6. 7 Intradecidual Sign. A 3-mm gestational sign (white arrow) is seen burrowed within the decidua. An echogenic line (black arrow) represents the uterine cavity. |
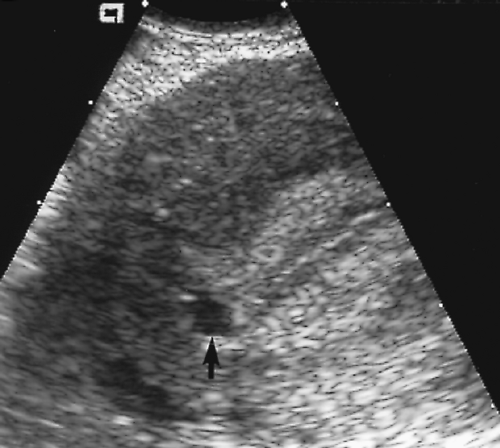 Figure 6. 8 Endometrial Cyst. An endometrial cyst (arrow) in a non-pregnant patient has an appearance very similar to the early gestational sac shown in Figure 6.7. Note the location of the endometrial cyst in the basal layer of the endometrium near the myometrium. |
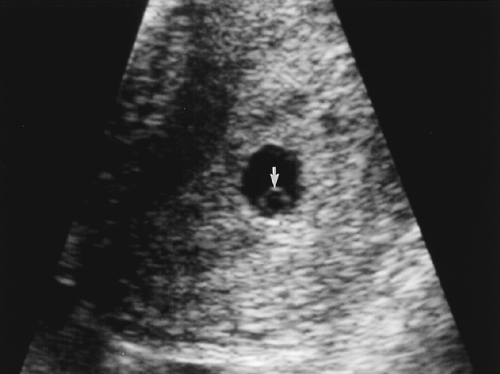 Figure 6. 9 Yolk Sac in Early Pregnancy. Magnified transvaginal image shows a tiny cystic structure that contains a yolk sac (white arrow). Visualization of the yolk sac is diagnostic of this cystic structure being a gestational sac. |
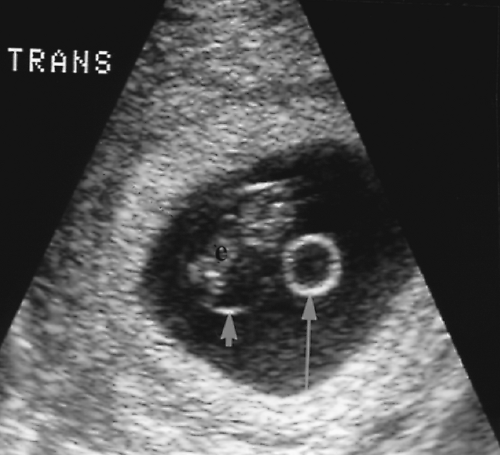 Figure 6. 10 Yolk Sac in Chorionic Cavity. In a more advanced gestation with an embryo (e) present, the yolk sac (long arrow) is a prominent cystic structure in the chorionic cavity outside of the amnion (short arrow). |
Normal Structure of the Gestational Sac
The normal anatomy of the GS must be recognized to correctly interpret early pregnancy US examinations (Fig. 6.12). The maternal decidua consists of three layers (Fig. 6.13). The decidua capsularis covers the surface of the expanding GS as it protrudes into the uterine cavity. The decidua basalis combines with chorion frondosum to form the placenta at the site of implantation. The decidua vera (also called decidua parietalis) lines the remainder of the uterine cavity away from the placenta. Because the GS is implanted within and is covered
by decidua, the uterine cavity remains open to the cervix. Bleeding associated with the pregnancy occurs into the uterine cavity and exits the uterus via the cervix. The outer membrane of the GS is the chorion. The inner membrane is the amnion (Fig. 6.10), which defines the amniotic cavity containing the developing embryo. The yolk sac is in the chorionic cavity, between amnion and chorion (Fig. 6.10). Low-level echoes are commonly seen within the fluid of the chorionic cavity. As the embryo grows, the amnion expands and becomes adherent to the chorion, obliterating the chorionic cavity at 15-16 weeks. Occasionally the amnion and chorion remain unfused throughout pregnancy. US features of the normal GS are listed below:
by decidua, the uterine cavity remains open to the cervix. Bleeding associated with the pregnancy occurs into the uterine cavity and exits the uterus via the cervix. The outer membrane of the GS is the chorion. The inner membrane is the amnion (Fig. 6.10), which defines the amniotic cavity containing the developing embryo. The yolk sac is in the chorionic cavity, between amnion and chorion (Fig. 6.10). Low-level echoes are commonly seen within the fluid of the chorionic cavity. As the embryo grows, the amnion expands and becomes adherent to the chorion, obliterating the chorionic cavity at 15-16 weeks. Occasionally the amnion and chorion remain unfused throughout pregnancy. US features of the normal GS are listed below:
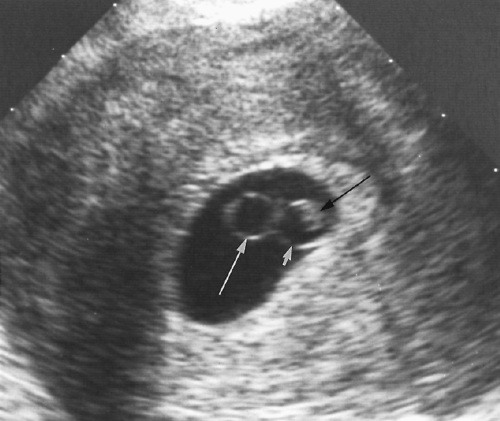 Figure 6. 11 Double Bleb Sign. The yolk sac (long white arrow) and amniotic sac (short white arro w) appear as two cystic structures of equal size within the fluid of the chorionic cavity. The embryo (black arrow) is seen within the amniotic cavity. |
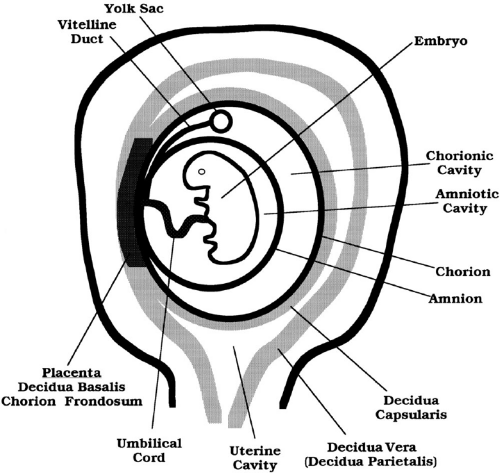 Figure 6. 12 Anatomy of Early Pregnancy. A line drawing illustrates the anatomic structures of early pregnancy. |
The normal GS is round or oval in shape, smooth in contour, and is positioned in the fundus of the uterus. The choriodecidual reaction produces a smooth echogenic rim >2 mm in thickness around the GS (Fig. 6.1) [10].
The double decidual sign describes the appearance of two echogenic arcs of decidual tissue separated by a hypoechoic arc of fluid in the endometrial cavity (Fig. 6.14) [16].
The visualized decidual arcs consist of decidua vera and decidua capsularis. The double decidual sign partially encircles the GS. The decidual arcs are incomplete because of development of the placenta at the site of implantation.
Normal growth of the GS is 1.1 mm/day MSD for the first 8 weeks.
Doppler examination of the trophoblastic tissue that surrounds a pregnancy shows intense vascularity with a high-velocity, low-resistance spectral waveform. This vascular pattern has been characterized as a “ring of fire.” The presence of this rim of high vascularity can be used to differentiate intrauterine pregnancy (IUP) from the intrauterine pseudogestational sac of ectopic pregnancy [17]. The use of Doppler is controversial in early pregnancy because of the higher US energies utilized and concern for potential, but unproven, adverse effects on a normal embryo.
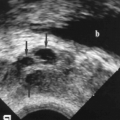
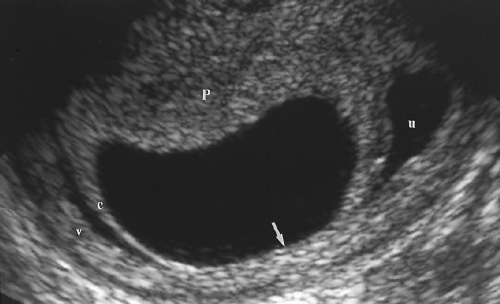 Figure 6. 13 Three Layers of Decidua. Transvaginal image illustrates the three layers of decidua. The amniotic sac and a normal embryo were visible elsewhere within this gestational sac. The placenta (P) forms from decidua basalis and chorion frondosum at the site of implantation of the blastocyst. Decidua capsularis (c) covers the portion of the gestational sac that protrudes into the uterine cavity (u). Decidua vera (v) lines the remainder of the uterine cavity. This uterine cavity contains a small amount of blood. The chorion is a very thin membrane defined only by the sharp fluid-tissue interface (arrow) of the gestational sac. |
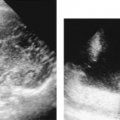
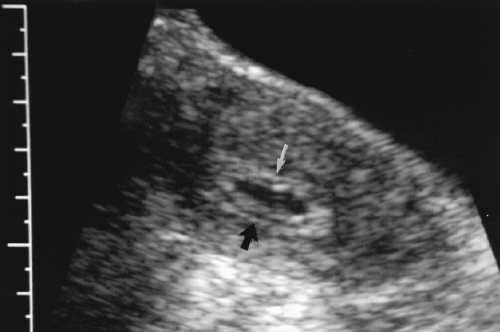 Figure 6. 14 Double Decidual Sign. Transabdominal image illustrates the two layers of echogenic decidua separated by a thin echolucent line that make up the double decidual sign (black arro w). The double decidual appearance extends only part way around the circumference of the sac. It is not present at the site of placental development (white arrow). |
Role of Quantitative β-hCG Determinations
Radioimmunoassay (RIA) for the serum beta subunit of human chorionic gonadotropin (β-hCG) provides a specific and sensitive laboratory test for the presence of a fertilized ovum. If the RIA is negative, the patient is not pregnant. If RIA is positive, serial quantitative measurements are useful in diagnosis of normal and abnormal pregnancy. The problem comes in interpretation of results. Numerous papers have been written touting the value of “discriminatory levels” of β-hCG. For example, one study states that if serum β-hCG exceeds 1000 mIU/mL, then an intrauterine GS should always be identified in a normal pregnancy on TV US [18]. To apply this criterion, the first pitfall is to correlate the reporting standard used in the published study with the reporting standard used by the laboratory where you practice. Since the 1960s, a number of reporting standards have been utilized, including the First International Standard, the Second International Standard, the Third International Standard, and the International Reference Preparation. Reported values differ significantly depending on which standard is used. The second pitfall is that different laboratories using the same standard will report different results depending on which laboratory test kit they use. The range of normal values for a given week of pregnancy varies widely from one laboratory to another. These pitfalls make the use of reported discriminatory levels hazardous in any given practice unless specific correlation has been individually studied for a given laboratory and patient population. Further caution is warranted because even if these studies are correlated at each practice location, hospitals commonly change laboratories and test kits for cost considerations without informing practicing physicians.
Related posts:

Stay updated, free articles. Join our Telegram channel

Full access? Get Clinical Tree


