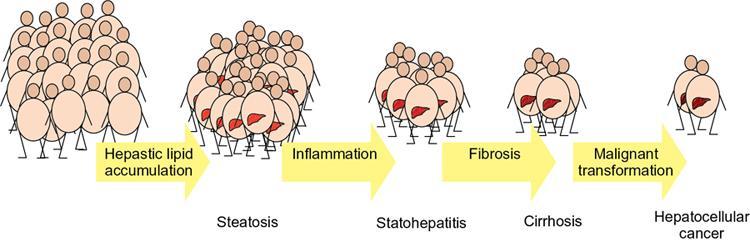
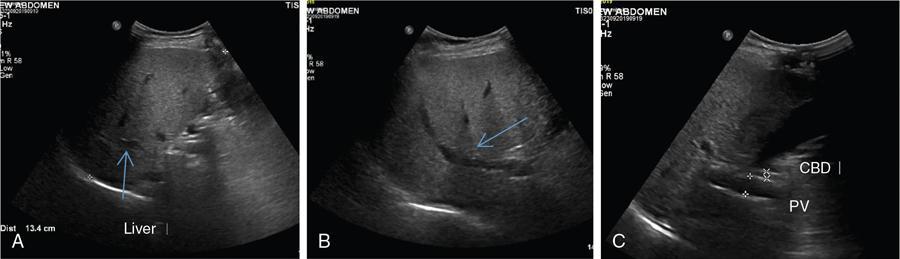
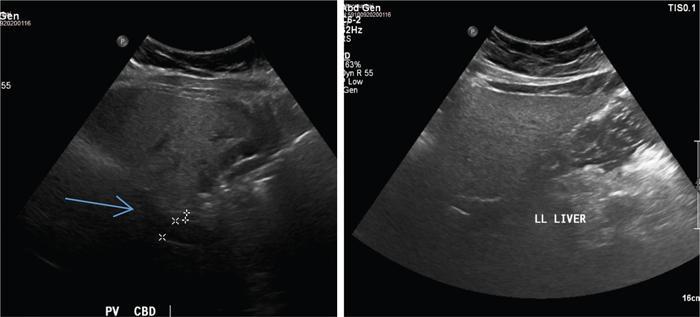
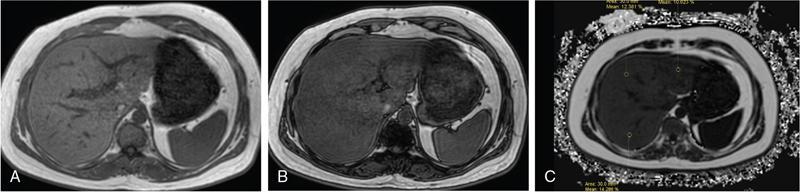
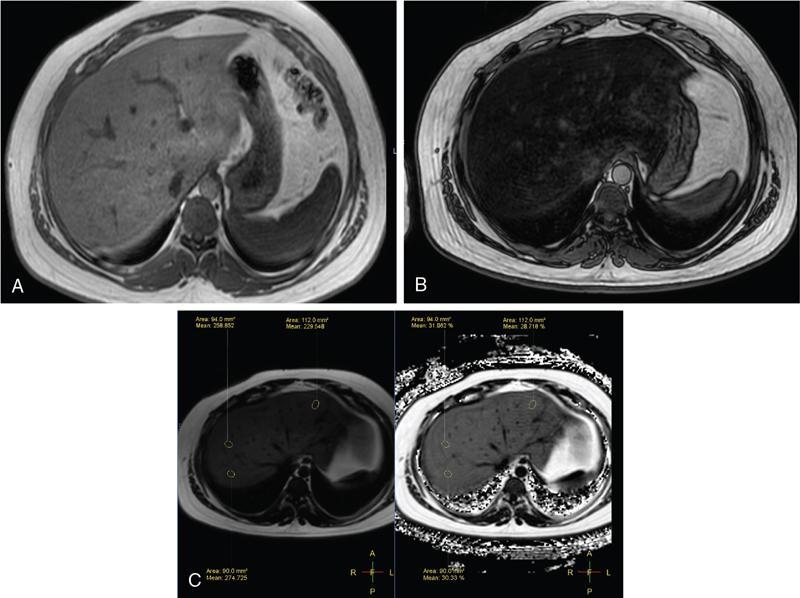
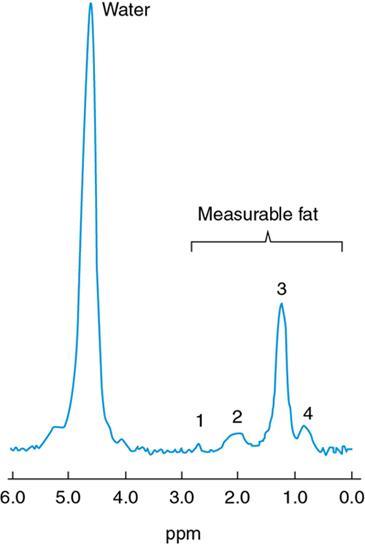
Excessive triglyceride accumulation within hepatocytes is defined as hepatic steatosis. Major conditions associated with hepatic steatosis include alcoholic fatty liver disease (AFLD) and nonalcoholic fatty liver disease (NAFLD). Causes of hepatic steatosis are discussed in Table 9.10.3. NAFLD is the most common form of hepatic steatosis and discussed in detail below. Up to 90% of patients with chronic alcoholic intake have fatty liver. Those with pure AFLD have a 10% risk of progressing to cirrhosis. Consumption of 30 g ethanol/day shows increased risk of chronic liver disease and cirrhosis. Other risk factors include female sex, obesity, cigarette smoking, obesity and associated risk factors. These factors are divided into 2 main categories which can cause fatty liver: inborn errors of metabolism and acquired metabolic disorders. Inborn errors of metabolism include abetalipoproteinemia, galactosemia, glycogen storage disease, hereditary fructose intolerance, homocystinuria and Wilson disease. Inflammatory bowel disease, jejunoileal bypass, malnutrition, starvation and total parenteral nutrition are acquired metabolic factors associated with increased risk. Chronic HCV infection, is associated with hepatic steatosis, with prevalence of 40%–80%. Hepatic steatosis can be seen as an adverse reaction to some medications such as tetracycline, valproic acid, some of chemotherapeutic agents, dexamethasone, amiodarone, methotrexate, tamoxifen and acetylsalicylic acid. Either microvesicular or macrovesicular steatosis can be observed in drug-induced hepatic steatosis. It generally occurs with therapy lasting several weeks or months and is reversible after discontinuation. The leading cause of hepatic steatosis in paediatric population is NAFLD. Six per cent of these patients develop cirrhosis and end-stage disease. Other less common causes include starvation and malnutrition, drugs (glucocorticoids, oestrogens, tetracyclines, and methotrexate), intoxications (carbon tetrachloride, organic phosphates, organic solvents, and alcohol), metabolic disorders, hepatitis C infection, and total parenteral nutrition. NAFLD is defined as steatosis affecting >5% of hepatocytes in the absence of a secondary cause. NAFLD represents a spectrum of disease, ranging from simple steatosis to steatohepatitis through to fibrosis and cirrhosis and in some cases hepatocellular carcinoma. NAFLD is a growing epidemic worldwide in part due to obesity and insulin resistance leading to liver accumulation of triglycerides and free fatty acids. Nonalcoholic steatohepatitis (NASH) is defined by histologic terms as a necroinflammatory process whereby the liver cells become injured in a background of steatosis. 20% of patients with NAFL progress to NASH, which progresses to fibrosis and cirrhosis over a 15-year time period (Fig. 9.10.3). The definition of NAFLD requires imaging or histology evidence of steatosis and no causes for secondary hepatic fat accumulation like significant alcohol intake, drugs or hereditary disorders (Table 9.10.4). The incidence of NAFLD ranges from 20% to 30% in Western countries and 5%–18% in Asia. As it currently stands, NAFLD represents the second most common reason to be listed for a liver transplant. The prevalence of NAFLD is higher in patients with obesity, diabetes, and patients with hyperlipidaemia. Prevalence increase with age from less than 20% at age 20 to more than 40% over 60 years of age. Males show a higher risk for progression to NASH and fibrosis (Table 9.10.5). Up to 90% of patients with NAFLD have simple steatosis, and about 30% of patients with NAFL develop NASH, and in again about 30%–40% of NASH patients the disease progresses to manifest fibrosis and cirrhosis NAFLD related cirrhosis has a 10-year mortality of 25% and a 5% chance of developing end-stage liver disease and HCC. The theory implicated in the pathogenesis of NAFLD is the two-hit theory. Insulin resistance, enhanced dietary influx and increased hepatic lipogenesis leading to accumulation of triglycerides (TG) and FFA in the hepatocytes is the first hit. The lipid peroxidation, mitochondrial dysfunction and inflammation resulting in hepatocyte damage and development of liver fibrosis is the second hit. The stages of NAFLD on histology range from steatosis initially to hepatic fibrosis in late stages. In the steatotic stage large (macro-) and small (micro-) vesicles of fat, predominately triglycerides, accumulate within hepatocytes. The affected parenchyma is divided into thirds: 5%–33%, 34%–66% and >66% and graded as mild, moderate and respectively. Ballooned hepatocytes with accompanied steatosis and inflammation are characteristic of the steatohepatitis stage. Fibrosis has a characteristic appearance with early lesions showing a perisinusoidal deposition followed by periportal fibrosis which progresses to bridging. Raised GGT is the most common liver enzyme elevated in NAFLD. Transaminases are within normal range in 80% patients. No specific blood tests can diagnose NAFLD. Liver biopsy has remained the gold standard for diagnosis and quantification of liver fat. Drawbacks, however, include invasive nature, sampling error and procedure related complications like bleeding. Various imaging techniques are currently available in diagnosing and quantifying liver fat. MRI in particular proton density imaging and MR Spectroscopy have revolutionized imaging of fatty liver. Normal liver parenchyma is the same as or slightly more echogenic than the adjacent kidney and spleen. Fat deposition leads to increased echogenicity of liver. Decreased beam attenuation in patients with fatty change leads to poor visualization of structures such as intrahepatic vessels, bile ducts and liver lesions and in severe cases diaphragm (Table 9.10.6). Fatty liver can be graded on USG as: US has a fair accuracy of detecting the moderate to severe hepatic steatosis with sensitivity of about 90% and specificity of about 95% for patients without concomitant chronic liver disease. Ultrasound is observer and equipment dependent. Confounding factors such as large body hiatus may lead to overestimation of hepatic steatosis due to beam attenuation by overlying fat. Conditions like fibrosis, inflammation can affect interpretation. The ratio between the mean brightness level of liver and right kidney is called the Hepatorenal sonographic index. A cut off of 1.49 has a high sensitivity and specificity for diagnosis of steatosis >5%. The main advantages of CT for assessing steatosis are relatively fast acquisition, ease of performance, and quantitative results. Estimation of fatty liver is done on non-contrast enhanced images. The normal liver density is around 60 HU, which is approximately 10 HU higher than normal spleen. Fat accumulation in the liver manifests as proportionate decrease in density. Both the absolute and relative (to the spleen) values are used to characterize steatosis; a cut-off value of 40 HU has been suggested to predict fat content greater than 30% (Figs. 9.10.6 and 9.10.7) Attenuation difference between liver and spleen on unenhanced CT scan is a commonly used quantitative parameter to evaluate hepatic steatosis. This avoids errors in attenuation value measurement from different CT scanners and different reconstruction algorithms. Normal liver parenchymal attenuation on nonenhanced CT is slightly higher than the spleen. Liver attenuation progressively decreases as percentage steatosis increases (Table 9.10.7) (Fig. 9.10.8) Methods of liver fat quantification on CT have been discussed in details in chapter on liver transplant. Limited diagnostic accuracy for detecting mild degree hepatic steatosis is one of major drawback of CT. Disorders causing hyperdensity of liver such as iron, glycogen deposition can lead to errors in interpretation. The concomitant presence of iron and fat may not be accurately diagnosed on CT. Low CT density values may also be caused by oedema and inflammation. Likewise, the spleen is an imperfect reference standard as it can be affected by haemosiderosis and haemochromatosis in a small minority of patients. Dual-energy CT with its ability to perform material decomposition is more accurate in quantifying hepatic steatosis and allows staging of fibrosis. Imaging is done with two different energies (typically 80 kVp and 140 kVp). DECT has the potential to quantitate liver fat content independent of ROI (region of interest) placement. Magnetic resonance imaging (MRI) is presently the most accurate imaging modality for the evaluation of hepatic steatosis. Several different methods have been developed and introduced in MRI for the evaluation of hepatic steatosis. In this technique typically, two gradient echoes are acquired, one employing a TE in which the water peak (4.7 ppm) and the dominant fat peak (1.3 ppm) are ‘out of phase’ and hence subtractive (SOP), and the other using a TE in which the two peaks are ‘in phase’ and therefore additive (SIP). Because two echoes are acquired, this is often called ‘dual-phase’ or ‘dual echo’ imaging. Fat Signal Percentage is calculated as [SIP – SOP]/[2 × SIP] ×100. The dynamic range of magnitude based chemical shift techniques has typically a 0%–50% signal fat-fraction (Fig. 9.10.9) This technique uses both magnitude and phase information from three or more images acquired at different echo times appropriate for more accurate separation of water and fat signals as against only magnitude information in dual-echo. These methods provide estimates of fat fraction with a dynamic range of 0%–100%. Proton density Fat fraction (PDFF) is calculated as Sf/(Sw + Sf) where Sw = SI of the water component, Sf = SI of the fat component. PDFF specifically reflects the concentration of triglycerides in the hepatocytes as lipids within the other structures such as cell membranes and organelles are occult. Sensitivity up to 96% and specificity up to 100% for detecting any degree of steatosis have been reported. A fat-fraction threshold of 5.56% is commonly used to define steatosis; however, the optimal cut-off value still needs to be defined (Figs. 9.10.10 and 9.10.11). MRS can directly measure the chemical composition within tissue based on the frequency composition of the signal originated from the voxel of interest. Water proton peak appears as a single peak at 4.7 ppm, whereas fat peaks appear as multiple peaks around 1.3 ppm. PDFF can be calculated as the ratio of the sum of the signal intensities derived from the protons in fat divided by the sum of the signal intensities originated from the protons in both fat and water (Fig. 9.10.12). TABLE 9.10.8 MRS data are usually obtained from a single voxel manually placed in the liver parenchyma usually right posterior segment of the liver. Reported MRS sensitivities and specificities for detection of mild hepatic steatosis are 80.0%–91.0% and 80.2%–87.0%, respectively, outperforming CT and US. MRS can also provide excellent reproducibility of measurement. It is also unaffected by confounding factors like fibrosis, iron overload and glycogen. Small sample volume usually less than 3 × 3 × 3 cm3 is a major limitation of MRS, particularly in patients with uneven fatty change. Despite these practical limitations, MRS is considered to be the gold standard MR method for hepatic fat quantification. This is the most frequently encountered pattern and considering the homogenous involvement poses no diagnostic dilemma. Focal fat deposition and focal sparing in diffuse fatty liver are less common. These usually occur in specific locations like adjacent to falciform ligament or ligamentum venosum, in portal hepatis or gallbladder fossa. Imaging findings are suggestive of fatty pseudolesions rather than true masses. Occurrence in characteristic locations, absence of mass effect on vessels and structures, geographic configuration and contrast enhancement similar to or less than adjacent liver (Fig. 9.10.13). Fat deposition around insulinoma metastasis can occur as a local effect of insulin on the liver parenchyma. On ultrasound, it appears as an echogenic rim shows signal drop on out of phase images. Eisenberg has reported perilesional steatosis around focal nodular hyperplasia. Sometimes multiple small foci and seen scattered throughout the liver. These may appear as small round nodules (Fig. 9.10.14). Opposed phased imaging is more useful than CT or US to establish diagnosis. These may, however, pose a diagnostic dilemma in patients with known malignancy. Perivascular fatty infiltration is a recently described entity, mostly seen in alcoholic patients. This pattern is characterized by halos of fat that surround the hepatic veins, the portal veins, or both hepatic and portal veins (Fig. 9.10.15). Normal vessels coursing through the lesion without attenuation in calibre suggest the diagnosis. Peritoneal dialysis with insulin in the dialysate in patients with renal failure and insulin-dependent diabetes. Exposure of subcapsular hepatocytes to a higher concentration of insulin results in fat deposition in the subcapsular regions. Some hepatic lesions such as hepatic adenoma, hepatocellular carcinoma, regenerative nodules and focal nodular hyperplasia can show intracellular steatosis (Fig. 9.10.16). These areas show signal drop on opposed phase. However, postcontrast imaging characteristics of these lesions allow differentiation from areas of focal steatosis. Perilesional sparing has been reported in haemangioma and hepatocellular carcinomas. This may mainly represent decreased portal flow due to either compressed or atrophic hepatocyte cords in expanding metastases or arterioportal perfusion abnormalities in haemangiomas. The differential diagnosis of focal fat infiltration is discussed in Table 9.10.9. Accurate history and chemical shift imaging showing signal drop help in differentiation of focal fat from metastasis. These are visible only during the arterial and portal venous phases after contrast agent administration. The morphologic appearance of fat deposition and perfusion abnormalities is similar. Perfusion abnormalities however are visible only during the arterial and portal venous phases (Fig. 9.10.17). They are not seen as an attenuation difference on nonenhanced CT. Periportal oedema, inflammation, haemorrhage and lymphatic dilatation may mimic perivascular fat. With the exception of haemorrhage all other conditions affect periportal region symmetrically (Fig. 9.10.18). Patients with haemorrhages may show other signs of injury. Chemical shift imaging is helpful in cases with diagnostic challenges.
Abnormalities of attenuation
Fatty liver
Causes of fatty liver
Paediatric hepatic steatosis
Nonalcoholic fatty liver disease
Definitions
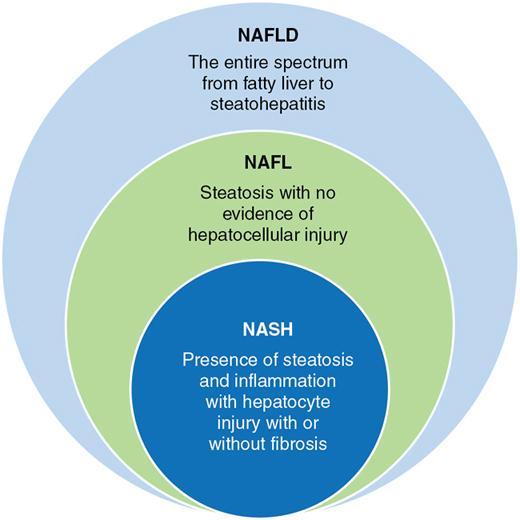
Nonalcoholic Fatty Liver Disease and Related Definitions
Nonalcoholic Fatty Liver Disease (NAFLD)
This term denotes the entire spectrum of fatty liver disease ranging from fatty liver to steatohepatitis to cirrhosis.
Nonalcoholic Fatty Liver (NAFL)
Presence of fatty liver without evidence of hepatocellular injury and a minimal risk of progression to cirrhosis and liver failure.
Nonalcoholic steatohepatitis (NASH)
Hepatic steatosis and inflammation with hepatocyte injury with or without fibrosis occur in NASH. progression to liver cirrhosis, failure can occur
NASH Cirrhosis
Presence of cirrhosis with current or previous histological evidence of steatosis or steatohepatitis
Epidemiology
Natural history of NAFLD
Pathogenesis of NAFLD
Two hit hypothesis
Histopathology
Serology
Imaging in fatty liver
Assessment of hepatic fat content
USG
Ultrasound is accurate for a diagnosis of >20%–30% steatosis, that is, moderate and severe cases but is poorly sensitive for mild steatosis
Grading of liver steatosis by ultrasound (Qualitative)
Operator – and equipment – dependent and has substantial intra- and interobserver variability
Disadvantages
Hepatorenal sonographic index
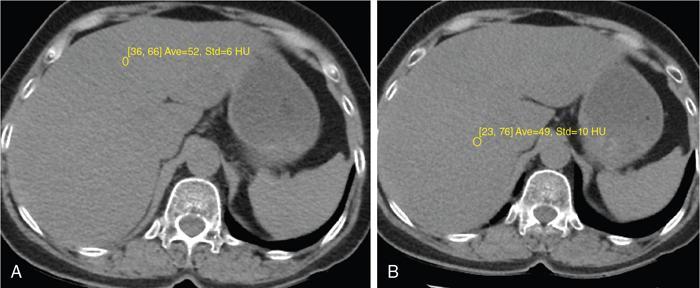
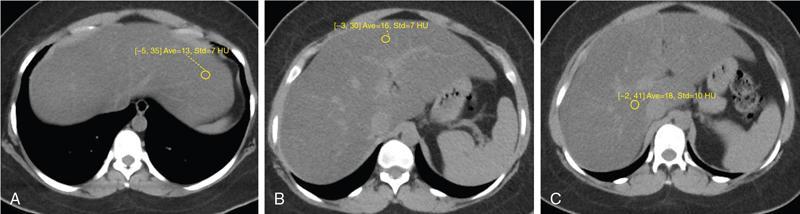
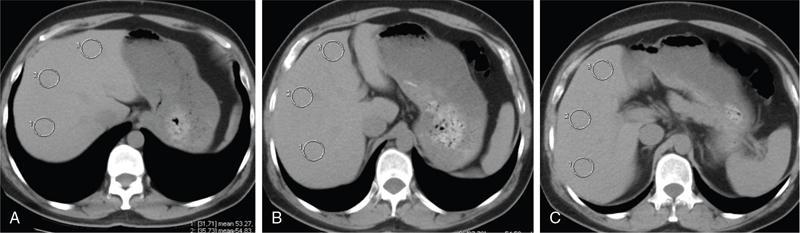
CT
Liver attenuation index
Principle: Fat has low attenuation a proportionate decrease in density is seen with increasing fat accumulation in liver
Assessment of hepatic steatosis using CT is based on the measurement of attenuation value of liver parenchyma, expressed as Hounsfield units (HU)
Attenuation difference between liver and spleen on unenhanced CT scan has been the most commonly used
Cut-off value of attenuation difference to detect moderate to severe degree hepatic steatosis-9
Not accurate for detecting mild steatosis
Disadvantages
Dual-energy CT
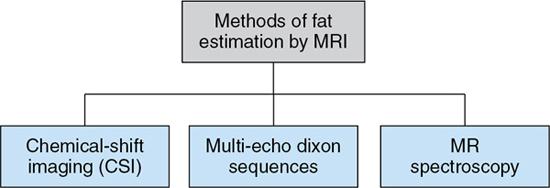
MRI
Chemical shift imaging (dual echo)
Multi-echo dixon sequences
MRS
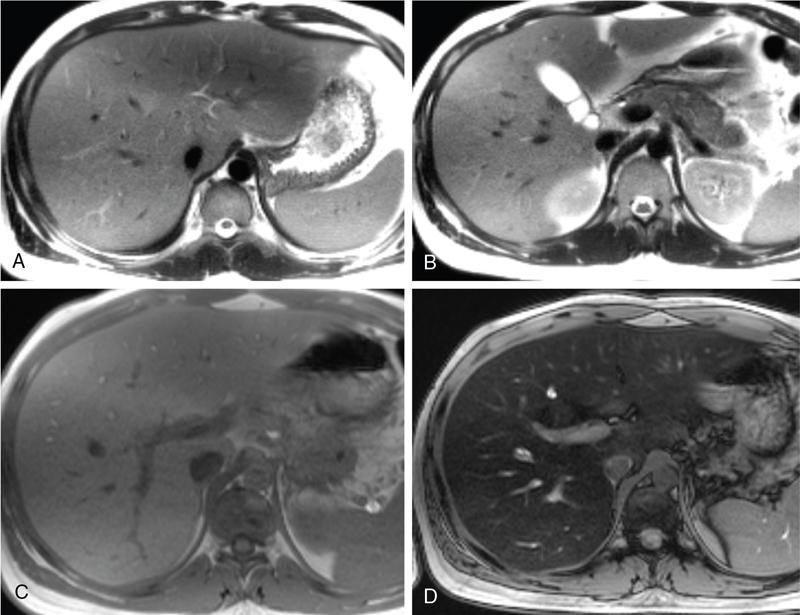
Patterns of fat deposition
Diffuse deposition
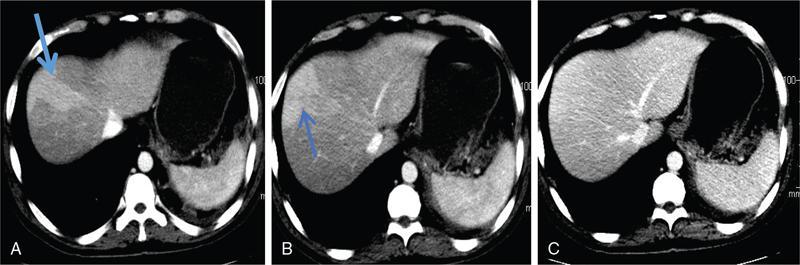
Focal deposition and focal sparing
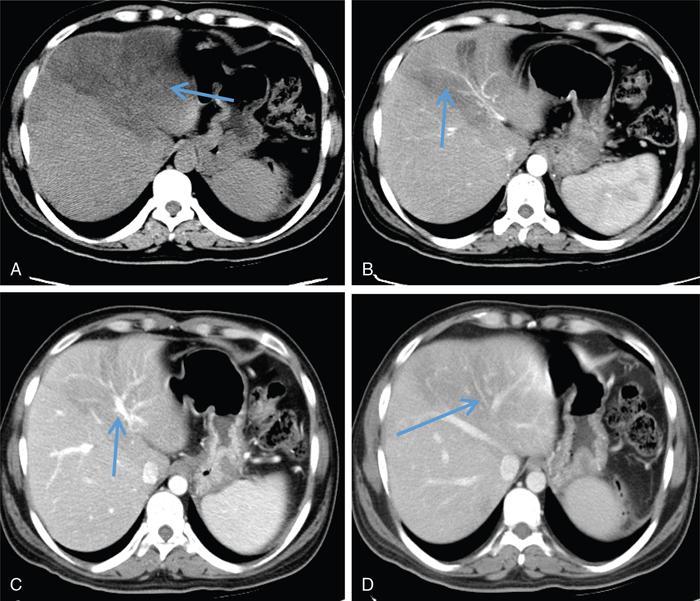
Perilesional steatosis
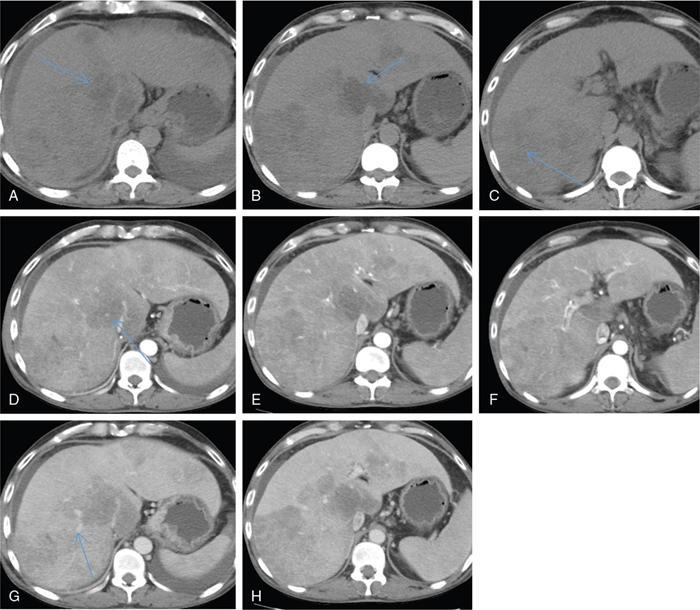
Multifocal deposition
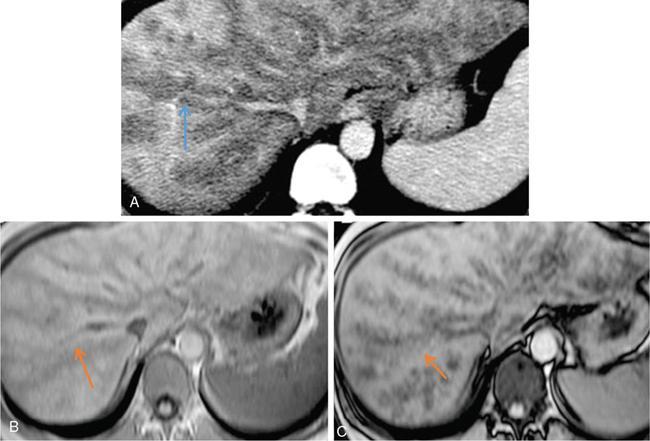
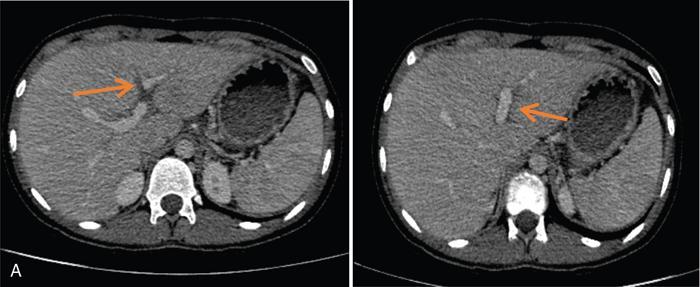
Perivascular deposition
Subcapsular deposition
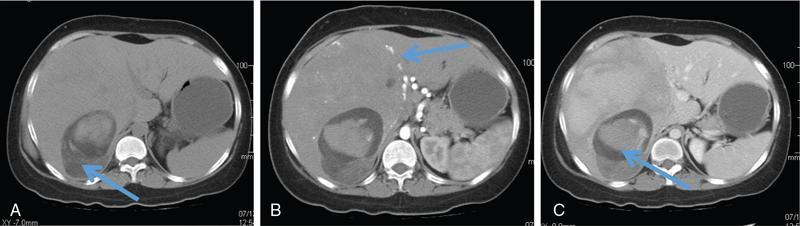
Intracellular lipid containing lesions (intratumoural or intralesional steatosis)
Perilesional or peritumoural fatty sparing
Differential diagnosis
Hypovascular metastases
Perfusion anomalies
Periportal abnormalities
Related posts:


Stay updated, free articles. Join our Telegram channel

Full access? Get Clinical Tree


