Fig. 1
Low-dose axial CT image performed during test bolus of contrast injection with ROI placed over the region of the carotid bifurcations and revealing peak contrast enhancement 17 s after injection initiation
Contrast Issues
The bolus rate and iodine concentration affect the quality of three-dimensional (3D) CTA reconstructions. Injections of high-concentration contrast with an increased iodine-delivery rate produce improved arteriovenous contrast differentiation at the level of the cavernous internal carotid artery (ICA). With the same rate of iodine delivery, injections of intermediate-concentration contrast agents increase the HU of both the cavernous ICAs and also the cavernous sinuses, with poorer resultant arteriovenous differentiation [11].
The optimal phase of arterial enhancement has been a topic of discussion in multiple studies, with the optimal arterial attenuation on CTA typically deemed to be ≥150 HU [12]. An attenuation difference of at least 50 HU between arterial and venous structures on CTA has proved to be the threshold for 3D rendering purposes with intensity-based software [13]. Studies have demonstrated that early arterial phase examinations may overestimate severe/critical carotid artery stenosis [14]. Early arterial phase acquisitions also have an affect on the evaluation of CTA source images (CTA-SI) and intracranial collateral flow [15, 16].
Several variations of the general carotid CTA protocol have been suggested, including rapid injection of smaller contrast volumes and also those using slower injection methods. One method of rapid injection is characterized by injecting a small contrast bolus (35–50 ml) at 6 ml/s after timing assessment with generation of a TDC. This technique allows for a tight contrast bolus, which is beneficial to obtain the maximal vessel opacification. Alternately, injection of iodinated contrast at a slower rate of 3.5–4.0 ml/s followed by imaging after a 25 s delay is less prone to timing errors that could result in unacceptable vessel opacification [17].
For patients requiring both cervical vessel evaluation and parenchymal evaluation, such as in the setting of radiation-induced cervical atherosclerotic disease in patients with head and neck cancer, a split-bolus technique may be employed. Approximately half of the standard contrast bolus is initially given. After a delay of approximately 45 s, the second half of the bolus is then given either followed by a bolus-tracking scan or a set time delay after which the scan is then performed. This method provides good parenchymal enhancement and robust arterial opacification with the benefit of only a single radiation exposure to the patient. The limitations of this protocol however include slightly more complex timing required for the technologist and suboptimal arteriovenous contrast for a dedicated arterial evaluation.
Dual Energy
The photon array from a source at a single peak kilovoltage (kVp) consists of a continuum of energies including the characteristic energies of the anode material. The average energy of a photon array (i.e., X-ray beam) is approximately one-third of the energy of the kVp. Conventional “single”-energy CT depicts various anatomic regions on the basis of differences in photon attenuation between adjacent structures. This difference in attenuation is primarily a function of the photoelectric effect and Compton scattering and is largely dependent on the atomic number of the materials involved. “Dual”-energy CT (DECT) extends the capabilities of single-energy CT so that structures with similar densities but different elemental compositions are distinguished according to their electron density differences in addition to their atomic number [18]. Furthermore, DECT may be desirable because of the superior imaging capabilities that can be achieved without a substantial increase in radiation dose. The basic principle of the DECT is to obtain two datasets with different X-ray energy levels from the same anatomic region and material decomposition on the basis of attenuation differences at different energy levels [19, 20].
DECT acquisition is manufacturer dependent and can be achieved by different physical implementations, including dual-spin CT, dual-source CT (DSCT), fast kilovoltage switching in a single source CT, or a sandwich detector–based CT which produces projections with two different energy levels for each exposure [21].
Dual energy imaging exploits the energy dependence of the CT attenuation of calcium and iodine, thus the Hounsfield units will differ at varying energy levels due to a difference in electron density. With a dual-source CT scanner, one tube can be set to 80 kV and the other to 140 kV, enabling two different energy data sets to be acquired simultaneously with one acquisition. DECT then enables digital subtraction of bone and calcified structures from CTA images, thus allowing for evaluation of carotid stenosis in the presence of large calcified plaques. However, dual-energy subtraction CT may overestimate the degree of carotid stenosis compared to other methodologies, such as multiplanar CTA reformats (MPR) and conventional angiography [22].
Optimization for 3D
Multiple techniques for carotid CTA image reformation can be performed using dedicated post-processing software, including multiplanar reformats (MPR), maximum intensity projection (MIP), and three-dimensional (3D) volume-rendering (VR) reformatting techniques [23]. A high-resolution dataset of approximately 1 mm slice thickness and no interslice gap allows for excellent quality 3D reconstructions. Finer datasets such at 0.9 mm slice thickness with a 0.45 mm interval between slices (50 % slice overlap) allows for preservation of maximal data from the helical scan acquisition at the cost of significantly greater slice number. Datasets of a more coarse nature, such as 1.5–2.0 mm slice thickness, result in mild degradation of reconstructed images, but are much less processor intensive for computer workstations.
Post-Processing
The practitioner of CTA should be knowledgeable about workstation-based post-processing techniques. Post-processing should include evaluation of the CTA source images as well as the reformatted images such as MPR, MIP, or volume-rendering images.
Once the data sets have been generated, post-processing must be applied to segment the helical volume and harness the information contained therein. The large volume of data typically obtained with CTA requires accurate, time-efficient, and reproducible image post-processing to enable disease interpretation. The axial image plane, formerly the plane with the highest image quality in a single detector CT scanner acquisition, is no longer the only plane available for image interpretation. Axial image viewing is time-consuming, inefficient, and possibly less accurate than viewing reformatted images. With modern CTA acquisition, near isotropic data sets can be obtained, which allow manipulation in all imaging planes and projections without significant loss of image quality. Therefore, a dedicated 3D workstation to enable a real-time interactive approach to image manipulation and interpretation has now become a necessity. Furthermore, many authors advocate the use of 3D image display for both diagnosis and procedure planning. Available post-processing techniques on the clinical 3D workstations include multiplanar reconstruction (MPR), maximum intensity projection (MIP), volume rendering (VR), and shaded surface display (SSD).
High efficiency in detecting and evaluating stenoses has made cross-sectional evaluation of MPR aligned to the vessel course the gold standard in analyzing CTA images. On the other hand, freely rotatable maximum intensity projection images (3D-MIP) can be created for a quick assessment of vessel status. Using conventional single energy CT, the ability to quantify highly calcified stenoses is often limited, as the vascular lumen within the calcified area is often obscured after 3D-MIP reconstruction [23].
Multiplanar Reconstruction (MPR)
The MPR algorithm enables a reordering of specific acquired image voxels along a predefined vascular centerline to provide a 2D image of the vessel of interest. As all arteries are curved at some point in their distribution, curved MPR (cMPR) is an extension of the MPR process that enables display of a curved plane prescribed along an individual vessel contour or centerline, thus displaying the entire vessel midline on a single 2D image. Curved MPRs provide a comprehensive cross-sectional display of arterial luminal sizes over long segments and can be especially useful in reviewing large vascular territories such as the brachiocephalic trunk through to the middle cerebral artery (Fig. 2). CMPRs are the most equipped post-processing method to reduce artifact from vessel calcification and arterial stents. However, cMPR can be user-dependent and requires manual or semi-automated tracing of each vessel centerline (Fig. 3). Also, it is imperative that at least two orthogonal planes for each arterial segment are created to ensure accurate quantification of eccentric atherosclerotic plaque. The orthogonal planes are essential for determining the true cross-sectional diameter of a vessel (Fig. 4). Other limitations of cMPR are that only one arterial segment can be displayed at a time and the limited spatial perception due to the absence of anatomical landmarks such as vessel bifurcations. A new potential solution for these limitations has been described: multipath curved planar reformations (MPCPRs). The MPCPR method allows multiple longitudinal vessel cross-sections to be displayed simultaneously and therefore allows branching patterns to be seen without obscuring vessel wall calcifications and stents, thus restoring spatial perception.
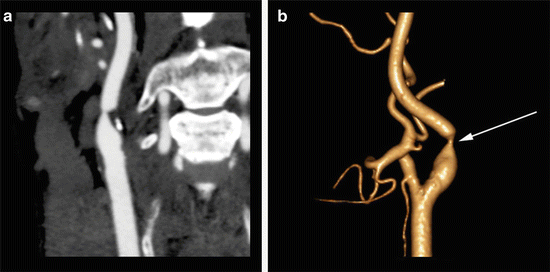
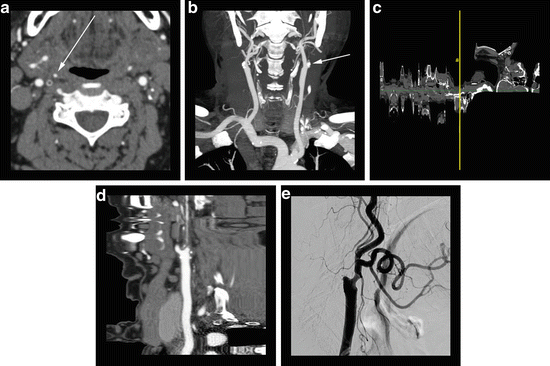
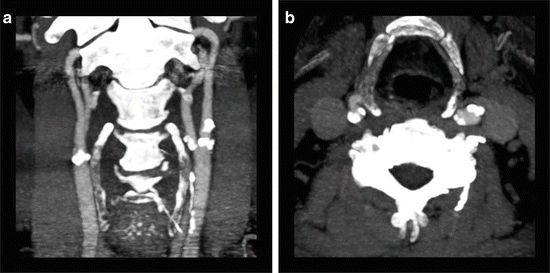

Fig. 2
63-year-old male with abnormal carotid Doppler ultrasound. (a) A curved MPR CTA reveals severe stenosis of the proximal right internal carotid artery leading to a “string” sign. (b) A surface-shaded display image shows the degree of focal high-grade stenosis (arrow) without the “straightening” of the curved MPR function. This display can be useful for the interventionalist in pre-procedure planning. Images courtesy of Daniel Ginat, M.D.

Fig. 3
75-year-old male presenting for cerebrovascular evaluation. (a) Axial CTA image reveals a completely occluded left internal carotid artery at the origin and a critical stenosis of the right internal carotid artery origin with a residual “hairline” lumen (arrow). (b) Coronal CTA MIP image reveals prominent bilateral external carotid arteries with poor visualization of the residual right internal carotid artery. The left internal carotid artery “stump” (arrow) is visualized. (c) Computer generated “straightened” curved MPR reveals failure of the computer algorithm to accurately assign the centerline to the residual internal carotid artery vessel—a common pitfall seen with critical stenoses. (d) “Straightened” curved MPR of the same vessel with manual assignment of the centerline depicts the long segment of critical stenosis. (e) Lateral projection digital subtraction angiography of the right carotid artery with injection of the common carotid artery reveals long segment critical stenosis of the proximal right internal carotid artery as seen best in (d)

Fig. 4
88-year-old male presenting with transient ischemic attack. (a) A coronal CTA MIP image displays moderate predominantly calcified atherosclerotic disease of the bilateral carotid bifurcations. The MIP technique allows the higher density calcified atherosclerotic plaques to obscure the vessel lumen. (b) An axial CTA MIP image through the level of the carotid bifurcations more accurately displays the mild left and moderate right stenosis at the level of the internal carotid artery origins
MIP
The technique of MIP provides images that most closely resemble those obtained with conventional DSA and therefore are often desired by interventionalists to enable a quick overall review of the vasculature for significant lesion determination prior to endovascular or surgical treatment. To obtain a MIP image, a specific algorithm is applied to the source data within the 3D workstation. This algorithm involves applying a threshold attenuation value and selecting out the highest attenuation voxels along lines projected through the given volume data set. These selected high-attenuation voxels are then incorporated into a 2D angiogram-like image, useful for demonstrating vessel opacification and residual vessel lumen. The limitations of MIP include vessel obscuration by other high-attenuation voxels, such as calcification, stents or bone, and the inability to display 3D relationships of vessels and adjacent anatomical structures. These limitations become a major problem with heavy arterial wall calcification or arterial stents, as the vessel lumen can become obscured. Also, when vessel relationships need to be determined prior to surgical intervention, this 2D MIP method is limited. However, MIP weaknesses can be partially mitigated by selectively cropping adjacent high-density structures (bones, vessel wall calcification, and stents), using alternate planes of projection and setting variable attenuation threshold values (Fig. 5).
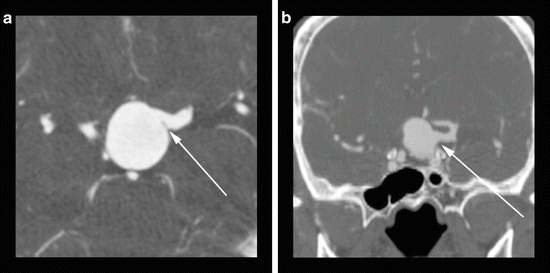

Fig. 5
(a) An axial CTA image reveals a giant basilar tip aneurysm with apparent incorporation of the left posterior cerebral artery (arrow). (B) A coronal CTA MIP image reveals that the left vertebral artery origin arises (arrow) from the middle aspect of the body of the aneurysm which would preclude a traditional coil embolization without protective measures
Shaded Surface Display (SSD)
SSD is a process in which apparent surfaces are determined within the volume of data and an image representing the derived surfaces is displayed. SSD provides an anatomical overview but like MIP and VR, has difficulty discriminating calcification, fails to display lumen detail and can over-estimate stenosis; therefore, SSD is generally not recommended for vessel caliber measurements (Fig. 2b).
Volume-Rendering (VR)
Dedicated computer software on 3D workstations allows for a VR algorithm to be applied to the source data. Volume rendering (VR) represents the most advanced form of 3D post-processing. The principle of VR involves taking the entire volume of source data, adding the contributions of each voxel along a line from the viewer’s eye through the data set, and displaying the resulting composite for each pixel of the display. It is of high fidelity to the acquired data set, preserving all the density values within the voxels. Histogram trapezoids with various user-defined settings of opacity, brightness, and color may be applied to create attractive carotid artery images (Fig. 6). However, one must interpret volume rendering with caution, as many of the user-adjusted variables may dramatically alter the apparent size of the vessel lumen. Although VR can be used to illustrate vessel opacification, stenoses, and course, MIP is the better choice to quantify lumen change. VR preserves 3D anatomical relationships, unlike MIP; however, VR, like MIP, still has limitations with vessel calcification and arterial stents. Therefore, this fundamental limitation precludes the exclusive use of VR and MIP techniques in a large proportion (approximately 60 %) of patients undergoing cerebrovascular evaluation (Figs. 7 and 8).
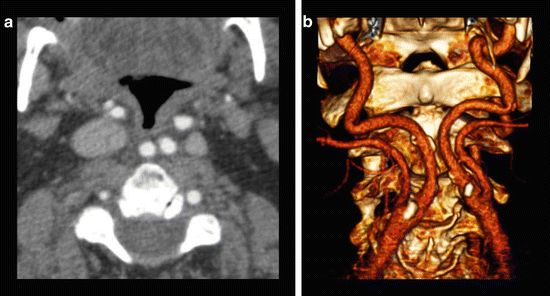
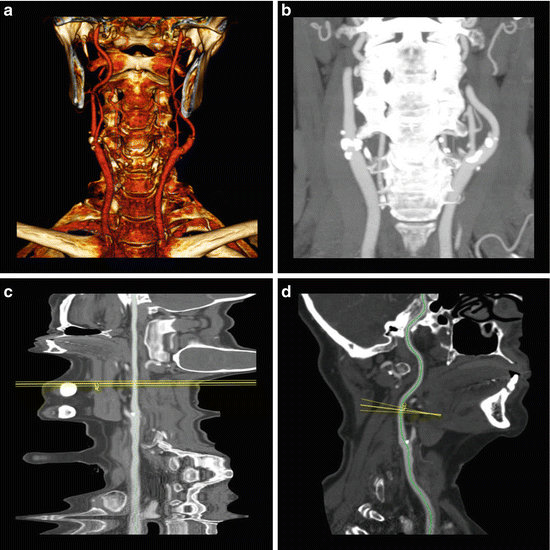
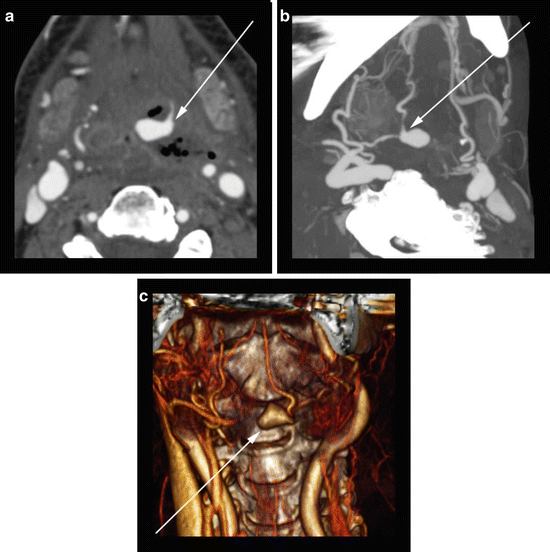

Fig. 6
88-year-old male presenting with stroke-like symptoms. (a) Axial CTA image reveals “kissing” internal carotid arteries (arrow) which lie in a retropharyngeal location. (b) 3D volume rendering better displays the abnormal medial orientation of the carotids

Fig. 7
73-year-old female presenting with stroke-like symptoms. (a) A coronal orientation 3D volume rendering reveals bilateral calcified plaque at the carotid bifurcations, but does not allow for accurate assessment of the degree of stenosis. (b) A coronal orientation CTA MIP also displays the presence of calcified plaque but offers little information on the effects on the underlying artery lumen. (c) A “straightened” curved MPR CTA image of the left carotid artery shows that the atherosclerotic plaque has negligible effects on the vessel lumen. (d) A “stretched” curved MPR CTA image from the same dataset provides another view of the left common carotid artery with display of the centerline from the aortic arch through to the ipsilateral middle cerebral artery

Fig. 8
52-year-old woman with head and neck cancer status post-surgical resection, flap reconstruction, and radiation therapy. (a) Axial CTA image reveals a large pseudoaneurysm (arrow) involving a branch of the external carotid artery surrounded by necrotic oropharyngeal tissue. (b) Oblique MIP CTA image displays the course of the parent branch artery from the external carotid artery origin (arrow). (c) Coronal orientation 3D volume rendering reveals the irregular shape of the aneurysm (arrow) along with information on the relationship to surrounding anatomic structures
Combined 3D Methods
In clinical practice, a combination of the available 3D reformatting methods is employed to accurately diagnose cerebrovascular disease. In the event that complete evaluation of all arterial segments is felt to be limited, then review of the original source images should be performed. Anatomical overview and quick significant disease localization can be achieved with the MIPs or the VR images. If arterial calcification or a stent obscure the arterial lumen, then a combination of MPR/CMPR is used. Dual-energy CT acquisition is a potential option for severe arterial calcification, as this tool enables subtraction of the wall calcification to unmask the adjacent arterial lumen. A dual-energy post-processing software program is available to enable calcified structures (atherosclerotic plaque and bone) to be identified separately from iodinated contrast, and subsequently calcification can be subtracted.
Billing and Documentation
According to the American College of Radiology (ACR), post-processing to provide multiplanar reformations through 3D renderings is mandatory for the exam to be considered CT angiography. Thus, two-dimensional (2D) post-processing no longer constitutes a CTA study. When CT scanning is performed using contrast enhanced dynamic-timed imaging and 2D reformatted axial images are obtained or multiplanar reconstructions (MPR) (e.g., coronal, sagittal, or even an off-axis view) are obtained, this should be reported with a standard CT with contrast code that identifies the anatomic area studied. None of these 2D planar reconstructions qualify as “angiographic” reconstruction. A full documentation and interpretation of a CTA includes not only vessel pathology, but also an assessment of the end organs of the vessels examined for secondary findings and potential alternative causes for the patient’s symptoms. Organs adjacent to the examined vessels should also be viewed for potential pathology.
Acceptable post-processing techniques that constitute a CTA study include the following, and physicians must state in their dictation that one of these 3D techniques was utilized: maximum intensity pixel (MIP), volume-rendered images, surface-shaded rendering, and/or 3D reconstructed images. Archival of these 3D renderings is also clearly defined by the ACR. It is necessary to have a permanent archive of 3D images acquired on a CTA study. When reformatted images are acquired and interpreted in addition to the CT axial images, the reformatted images are a part of the study and should be permanently archived.
Reports should also document the degree of any hemodynamically significant stenosis (typically regarded as greater than 50 %). The North American Symptomatic Carotid Endarterectomy Trial (NASCET) described a method of quantifying internal carotid artery stenosis. The diameter of the stenotic segment is divided by the diameter of a normal, distal segment of internal carotid artery (where walls are parallel) and subtracted from 1 (1 − (A/B)) [24].
Image Processing Limitations
Technical limitations to post-processing may exist, with the main ones being secondary to heavy arterial wall calcification or the presence of an arterial stent, as discussed above. Reviewing the axial source data can be a simple measure to overcome these problems. Post-processing artifacts can also occur, secondary to inadvertent vessel subtraction, particularly with MIP images. Other limitations of MIPs include anatomic overlap of adjacent structures and loss of structural detail with increasing slab thickness. MIP images can be degraded by high-density structures within the imaged field of view, including bone, calcium, stents, and coils. There can also be limited grading of stent lumens on MIP images and thus difficulty with evaluating in-stent restenosis.
With MPRs (especially curved MPRs), artifacts, such as production of pseudostenoses and/or occlusions as a result of inaccurate centerline definition, can occur (Fig. 3c). There can also be limited spatial perception with MPR data sets. Operator dependence is another potential limitation of CMPRs. Eccentric atherosclerotic plaque may be underestimated with the CMPR technique as a result of tracing only the centerline of the artery. Volume-rendered images may not demonstrate aneurysmal dilation of a vessel due to partial luminal thrombosis. Again, review of the axial source data can help solve these problems. Also, anatomic overlap of adjacent structures and loss of structural detail with increased slab thickness may occur with VR post-processing techniques similar to MIP.
To date, there are no fully automated algorithms to detect vessel centerlines, to segment out bony structures, or to detect/subtract vessel wall calcification. However, with constant software updates, these tools are likely to become available in the near future. A new investigational tool is dual-energy MDCTA that allows automatic subtraction of bone and potentially calcified atherosclerotic plaque, based on differential attenuation of bone, calcium, and iodine on a dual-energy scan as discussed above.
Safety
Carotid CTA is noninvasive and is associated with fewer risks than traditional carotid angiography. However, the exposure to ionizing radiation and the intravenous administration of iodinated contrast material should be considered when prior to carotid CTA.
Radiation
American exposure to medically related ionizing radiation doses has increased nearly sevenfold since the 1980s and accounts for approximately 50 % of the total radiation dose to the population [25]. As the population ages, the increasing utilization of medical imaging will necessitate the discussion of dose-reduction techniques amongst radiologists and clinicians. Appropriate patient selection is an important factor that can be achieved by identifying patients who will most benefit from CTA. Nonionizing radiation imaging modalities, such as ultrasound and MRI, should be considered for patients when feasible and in the absence of factors favoring the use of CT imaging.
Optimization of CT imaging parameters can allow for image acquisition with a lower radiation dose. For example, a dose reduction from 120 to 100 kVp and a reduction from 235 to 140 mA have been shown to lead to a dose reduction of 62 % while still producing source images and 3D reconstructions of diagnostic quality [26]. In a related study, improved signal to noise ratio of the intracranial vessels was demonstrated at 80 kVp compared to 120 kVp despite an increased image noise [27].
Contrast Media
Nonionic, low-osmolar contrast media is associated with a variety of allergic reactions, which rarely (approximately 4 in 10,000 [28]) can be life-threatening. Proper training is essential for both the supervising physician and support staff in the recognition of and appropriate treatment for a range of contrast reactions. Identifying patients at increased risk of severe contrast reactions prior to injection of iodinated contrast is important to ensure patient safety. Premedication regimens including corticosteroids and anti-histamines should be considered in patients with prior allergic reactions to contrast media or a history of other serious allergies, as these patients are at increased risk for future reactions.
Contrast-induced nephropathy (CIN) is another risk of the administration of iodinated contrast, which tends of occur more frequently in patients with acute kidney injury and/or chronic renal insufficiency. While there is no absolute renal function cutoff, risks and benefits of carotid CT imaging must be weighed with the patient’s underlying renal function when deciding whether to proceed with carotid CTA.
The rapid intravenous injection of iodinated contrast material may rarely be associated with the development of contrast extravasation in 0.1–0.9 % of cases [29]. While most episodes of contrast extravasation resolve without major complication, compartment syndrome may develop if a large volume of contrast material is introduced into a small body compartment. In the setting of large volume contrast extravasation, patients should be evaluated by a physician for evidence of increased compartment pressures including findings of neuromuscular compromise such as pain or paresthesias [30]. Reduction of the volume of contrast media as well as multiphase injections methods have been investigated to reduce the risk of contrast associated complications following carotid CTA [31].
Anatomy of the Carotid Arteries
Although many anatomic variants exist, the classical anatomy of the aortic arch includes an independent origin of the left common carotid artery from the aortic arch. The right common carotid artery classically originates from the bifurcation of the brachiocephalic (innominate) artery into the right subclavian and right common carotid arteries (Fig. 9).
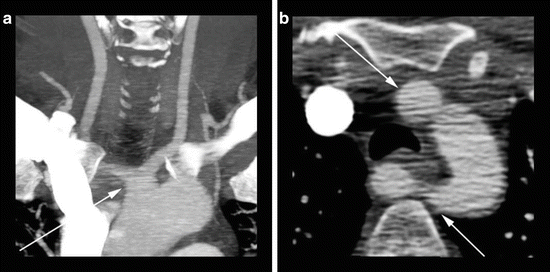

Fig. 9
64-year-old female presenting for acute stroke evaluation. (a) A coronal CTA MIP image displays a common origin (arrow) of the bilateral common carotid arteries in the setting of an aberrant right subclavian artery. (b) A standard axial CTA image reveals the common origin of the carotid arteries (top arrow) as well as the aberrant right subclavian artery (bottom arrow) coursing behind the esophagus and trachea
The bifurcation of the common carotid arteries typically occurs at the level of the C3-C4 vertebral bodies. After the carotid bifurcation, the external carotid artery (ECA) typically courses anteromedially through the neck, and the ICA courses posterolaterally (Fig. 6). The ICA provides the arterial supply to the brain and eyes, while multiple branches of the ECA supply the remainder of the head and neck. The ICA is generally larger in caliber, but does not demonstrate any branch vessels in the neck [32].
The intracranial portion of the ICA is divided into multiple segments. The petrous segment traverses the petrous portion of the temporal bone and extends to the level of foramen lacerum. The cavernous sinus surrounds the cavernous portion of the intracranial ICA. The ophthalmic segment of the ICA is the first intradural portion contained within the subarachnoid space. The intracranial ICA gives off multiple branches, including the vidian and ophthalmic arteries, with the terminal portion branching into the posterior communicating and anterior choroidal arteries, as well as the anterior and middle cerebral arteries (Fig. 10).
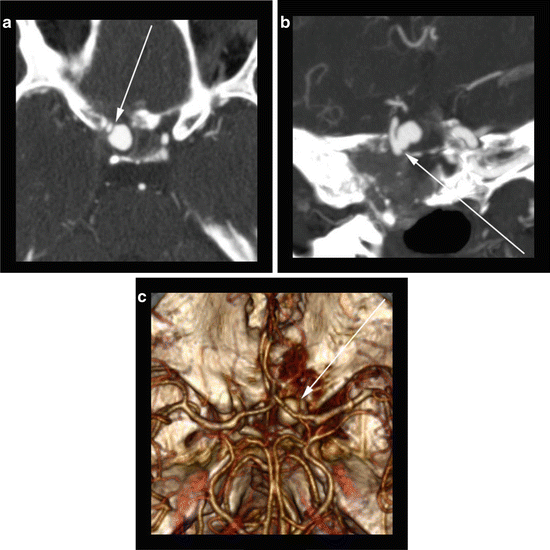

Fig. 10


55-year-old with history of recurrent invasive nasopharyngeal carcinoma. (a) Axial CTA image reveals a saccular aneurysm arising (arrow) from the communicating segment of the right internal carotid artery just distal to the ophthalmic segment. The “raw” axial image at the level which best shows the aneurysm does not reveal the aneurysm neck or display the origin. (b) An oblique coronal CTA MIP reveals the irregular shape of the aneurysm neck (arrow) along with the relationship of the aneurysm to the parent vessel. (c) A craniocaudal view of a 3D volume rendering allows for visualization of the aneurysm (arrow) along with providing anatomic information about the surrounding structures. These types of views can be extremely helpful for pre-procedure planning
Stay updated, free articles. Join our Telegram channel

Full access? Get Clinical Tree


