Fig. 1
Impact of field strength on imaging. (a) Axial maximum intensity projection (MIP) slab from 3D TOF MRA study at 1.5 T. (b) Axial MIP slab from 3D TOF MRA study at 3.0 T in the same patient. The higher signal-to-noise ratio enables vessels which run close to the plane of the images to be seen more clearly, particularly the posterior cerebral arteries (arrow) and distal M2 branch arteries (arrowhead)
Magnetic Resonance Techniques
Anatomical Imaging
Structural brain imaging is most useful for the detection of cerebral infarcts resulting from intracranial atherosclerotic disease (ICAD). The anatomical detail provided by MRI is considerably greater than CT and permits detection and quantitation of both acute and chronic infarcts and of white matter ischaemia. Certain patterns of ischaemic disease, such as borderzone infarction, have a correlation with patterns of vascular disease, e.g. MCA atherosclerosis [2] (Fig. 2).
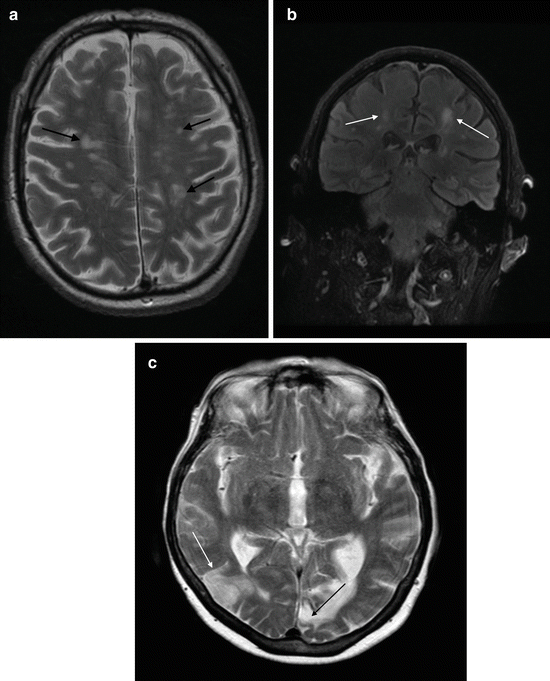

Fig. 2
Cerebral borderzone ischaemia. (a and b) T2 axial and T2 FLAIR coronal images showing ischaemic lesions (arrows) along the deep ACA/MCA borderzone. (c) T2 axial image showing right posterior MCA borderzone cortical infarction (white arrow) and an old left occipital lobe infarct (black arrow)
A minimum structural imaging protocol is suggested to include T1, T2 fluid-attenuated inversion recovery (FLAIR) and T2-weighted imaging. Imaging planes should include the axial plane, and preferably at least one orthogonal plane. FLAIR is useful for the detection of infarcts in the periventricular white matter and within the cortex by virtue of suppression of CSF signal [3]. However, FLAIR is susceptible to a variety of artefacts and is not adequate as a sole technique.
T2*, or more recently, susceptibility-weighted imaging is commonly used in the context of acute stroke for the detection of intracranial haemorrhage (including microhaemorrhage). However, because of the sensitivity to magnetic susceptibility of this technique, it can also be used to detect intravascular thrombus/clot due to the paramagnetic properties of deoxyhemoglobin. This phenomenon has been termed the hypointense vessel sign, in a manner analogous to the hyperdense artery sign on CT [4]. In practice, the sensitivity and specificity are poor, and given the easy availability of MR angiography techniques, the value of this sign is limited.
Physiological Imaging
Diffusion-Weighted Imaging
The development of diffusion-weighted imaging (DWI) has revolutionised the imaging of acute stroke due to very high sensitivity and specificity for cerebral infarction. The principle of DWI is the quantitation of molecular diffusion of water within tissue, which is typically performed by using an imaging sequence modified with the addition of a diffusion-sensitising gradient [5]. The underlying technique is typically an ultra-fast T2-weighted imaging sequence. The measure of diffusion sensitivity as defined by the prescribed sensitising gradient is termed the b-value. Much of the literature is based on imaging with b-value of 1,000 s/mm2, but there has been interest in the use of higher b-values of up to 3,000 s/mm2, for the detection of cerebral ischaemic lesions [6].
The resulting DWI images demonstrate loss of signal in the presence of diffusion (or bulk patient motion) giving a dark appearance. From these images may be computed a map of apparent diffusion coefficient (ADC) which represents a measure where the main structural imaging contrast (T2 effects) on the base sequence has been removed, effectively generating an image based almost solely on diffusion effects, although some contamination from non-diffusion effects such as bulk motion may remain.
Acutely infarcted and critically ischaemic brain parenchyma shows restriction of water diffusion due to cytotoxic edema. This is shown as high intensity on DWI images, and restriction of diffusion can be confirmed by corresponding low values on the ADC map (Fig. 3).
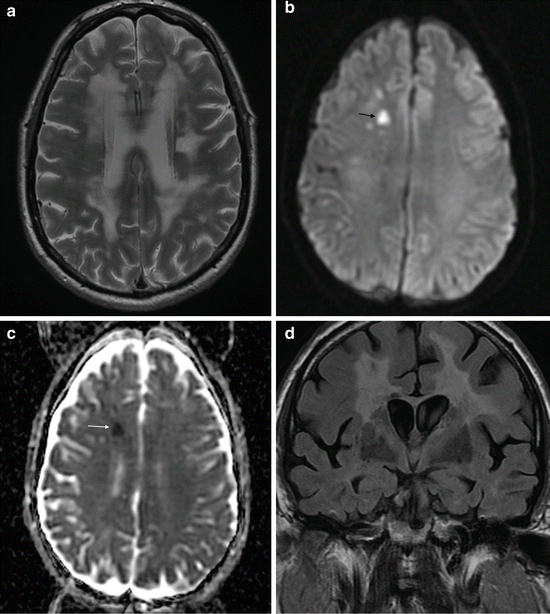

Fig. 3
Detection of acute cerebral infarction with diffusion-weighted imaging. (a) T2 axial imaging showing extensive, confluent white matter abnormality with a discrete left corona radiata lacunar infarct. (b) Diffusion-weighted imaging (DWI) shows focal hyperintensity in the right frontal white matter. (c) Apparent diffusion coefficient (ADC) map demonstrates low ADC, i.e. restricted diffusion, in the right frontal white matter lesion, indicating acute infarction. (d) Coronal T2 FLAIR image fails to distinguish the acutely infarcted region from the background of small vessel ischaemic disease
Because the white matter of the brain shows directional diffusion parameters, this technique can be extended to estimate the diffusion tensor by using multiple directional diffusion measurements, providing an estimate of the predominant direction of diffusion and its anisotropy [7]. Diffusion tensor imaging (DTI) provides a number of quantitative measures, in addition to ADC, which include the fractional anisotropy (FA) and radial and longitudinal diffusivities. The role of these additional parameters is a field of active exploration, but they may be of value in detecting chronic regional cerebral ischaemia [8].
Perfusion Imaging
The aim of perfusion-weighted imaging is the quantitation of blood flow through the cerebral tissue. The most studied method, dynamic susceptibilty contrast (DSC), utilises a bolus of an intravascular contrast agent. The contrast agent results in a quantifiable loss of signal during its passage through the intravascular space. From a curve of signal intensity, maps of cerebral blood flow and volume can be synthesised [9]. Non-contrast methods based on arterial spin labelling (ASL) have also been developed, but there are challenges and pitfalls [10].
Perfusion imaging has proved useful in the context of acute stroke imaging for early prognostication and stratification for treatment by identifying tissue at risk of infarcting (the ischaemic penumbra) prior to DWI changes [11].
Outside of the acute phase, there is scope for the determination of cerebrovascular reserve. This technique is reasonably established in selecting patients for intervention in severe carotid stenosis and in Moyamoya vasculopathy. However, it has been demonstrated in the context of MCA stenosis (Fig. 4) [12].
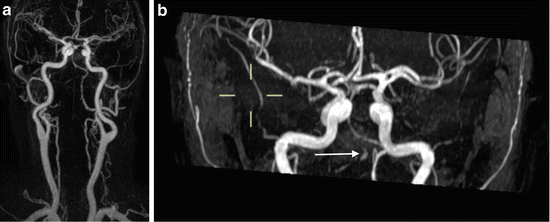

Fig. 4
Contrast-enhanced MRA. (a) Thick-slab MIP image from contrast-enhanced MRI of cervical and intracranial arteries. The right intracranial VA shows no opacification. (b) Thick-slab MIP image from 3D TOF MRA in the same patient performed at the same time as (a). There is high signal visible in the right VA. This was subsequently shown to be hyperintense on T1 imaging, indicating that this is intravascular thrombus, and not flow-related signal. The underlying cause in this case was thought to be arterial dissection
Vascular Imaging
There are several MRA techniques available for assessment of the intracranial arteries. Broadly, they are divisible into flow-sensitive techniques, in which image contrast is derived from the effects of bulk motion, and contrast-enhanced techniques, in which a contrast agent changes the imaging properties of the blood within the vascular lumen.
While it is unnecessary to have a detailed knowledge of the fundamental physics and techniques to interpret MRA images, appreciation of the limitations and artefacts is important to avoid error and to be able to develop and apply imaging protocols.
Time of Flight
Technical Background
Time of flight (TOF) effects alter the signal returned by flowing blood, and can commonly be seen as flow-related enhancement on conventional gradient echo (GE) T1-weighted images. Flowing blood results in bulk movement of magnetised spins. If the direction of flow is perpendicular to the plane of the imaging slice, unsaturated spins from outside of the imaging slice will replace those which have been partially saturated by the imaging sequence. In a heavily T1-weighted imaging sequence, the stationary spins have an attenuated signal due to partial saturation, whereas the moving blood returns a more intense signal.
The technique of two-dimensional GE TOF was introduced by Wehrli and Gullberg [13, 14]. Sequential axial sections acquired with this technique could be used to examine the intracranial arteries as well as the carotid bifurcations. The development of three-dimensional Fourier transform techniques permitted the acquisition of numerous thin sections, with isotropic voxel resolution. This improved resolution was of substantial benefit for assessment of the intracranial circulation when compared with 2D techniques [15]. The benefits of the reduced voxel size go beyond that of higher spatial resolution and include improved signal-to-noise ratio and reduced susceptibility effects. The 3D TOF technique represents the most commonly used technique for assessment of the intracranial arteries [16]. A variant which uses relatively thin, stacked, overlapping volumes (multiple overlapping thin-slab acquisition, MOTSA) has been the most effective in combining the technical advantages of both the 2D technique (reduced spin saturation) and 3D technique (improved SNR and resolution) [17].
Potentials, Limitations and Artefacts
Early reports of the performance of TOF MRA against intra-arterial digital subtraction angiography (IADSA) reported 100 % agreement for detection of occlusions and 61 % agreement for grade of stenosis [18], and showed sensitivity and specificity for occlusion of up 85–100 % and 95–97 %, respectively, and lower values for non-occlusive stenosis [19, 93]. A more recent, prospective, multicentre trial (SONIA) compared detection of non-occlusive stenosis by TOF MRA against the gold standard of IADSA [20]. Negative predictive value (NPV) was good (91 %), but positive predictive value (PPV) was only fair at 59 %, leading to the recommendation that a positive 3D-TOF MRA study should be followed by confirmatory testing. Smaller studies have quoted similar figures at 1.5 T [21]. At 3 T, however, both NPV and PPV are substantially increased [22], although this study examined a different population and the NPV/PPV may be confounded by different disease prevalence.
A tendency for TOF MRA to overestimate stenosis is recognised in the intracranial arteries [23]. The two most important causes are turbulent flow and slow velocity flow. Turbulent flow, resulting in disordered motion, can result in signal dropout due to intra-voxel spin dephasing, for example within the cavernous segment of the ICA [18] (Fig. 5). This problem can be exacerbated by the presentation of images in the form of maximum intensity projection (MIP) images. Review of the source images may assist in recognition of this artefact [24]. Slow flow can also result in loss of flow-related signal and this has been recognised following severe stenosis and proximal ICA stenosis [22]. However, this sign can also be used as a marker of severe stenosis [25].
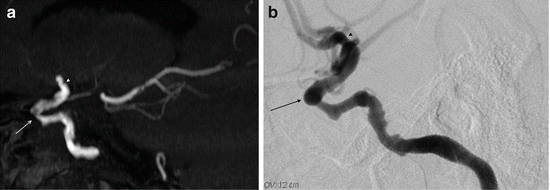

Fig. 5
TOF MRA in vascular stenosis. Sagittal thin-slab MIP projection to show the right cavernous ICA. The right carotid siphon appears critically stenosed (arrow) and there is irregularity of the terminal ICA (arrowhead). IA-DSA of the right ICA shows that the stenosis of the carotid siphon (arrow) and terminal ICA (arrowhead) are not as severe as the TOF MRA had suggested
As the base sequence for TOF imaging is inherently T1-weighted images, there is potential for other sources of T1 hyperintensity to be visible on TOF MRA. This can be seen in thrombus and haemorrhage, as well as fat.
Contrast-Enhanced MRA
Contrast-enhanced (CE) MRA utilises the paramagnetic effect of an intravenously administered gadolinium compound. The T1 shortening effect of the contrast agent results in increased signal intensity within the vessels [26].
CE MRA is technically challenging due to the requirement for rapid acquisition and precise timing so as to avoid venous enhancement. The advantage is the avoidance of saturation effects which may result in signal dropout. Time-resolved examination is also possible. Various techniques have been described to achieve this, albeit with some compromise to image resolution [27, 28].
Despite this, intracranial CE MRA has been reported to have similar diagnostic performance to 3D-TOF MRA with the benefit of faster image acquisition, which may be particularly advantageous in the acute situation, and a larger field of view which can include the extracranial arteries [29] (Fig. 4).
Disadvantages of the use of CE MRA relate primarily to the use of the contrast agent: occasional idiosyncratic/anaphylactic reactions and nephrogenic systemic fibrosis [30] are potential risks.
Early reports of the use of blood-pool contrast agents for intracranial MRA suggest that image quality can be improved and gadolinium dosage reduced [31]. Enhanced relaxivity due to macromolecular binding of the agent is thought to be a major contributor to the image quality, even during first-pass circulation [32].
The technique of CE TOF MRA provides flow-based imaging and the increased signal provided by the relaxivity contributed by the contrast agent. This technique could be of value for the assessment of stented arteries [33].
Other Vascular Imaging Techniques
There has been some interest in the technique of quantitative MRA to measure posterior circulation hemodynamics in patients with vertebrobasilar disease, where it has shown some benefit in risk stratification [34], and in the detection of in-stent restenosis [35]. However, despite initial promise of a reliable non-invasive technique, for assessment of stent patency, there has not yet been any robust independent validation of this technique.
A variety of high-resolution (HR) techniques have been described in recent years for the assessment of the intracranial arteries, including assessment of the arterial wall [36–39, 94]. These protocols have varying degrees of similarity to protocols based upon proximal ICA plaque imaging [40]. These techniques have had limited penetration into routine practice, and have not been incorporated into acute stroke/TIA imaging guidelines where established MRA techniques, potentially supplemented with perfusion imaging, are the mainstay [41].
High-resolution black-blood MRI is one technique for detection and classification of MCA stenoses [36]. The demonstration and measurement of plaque size and volume, as well as measure wall thickness, have been demonstrated together with differences between symptomatic and asymptomatic plaques [42].
Also echoing techniques in the ICA, there have also been reports of the detection of direct thrombus imaging for the identification of intraplaque haemorrhage or dissection by the presence of T1 hyperintensity within the arterial wall [43].
The disappointing results of the Stenting versus Aggressive Medical Management for Preventing Recurrent Stroke in Intracranial Arterial Stenosis (SAMMPRIS) trial [44, 45] have resulted in changes in practice away from intracranial stenting [46]. However, the SAMMPRIS trial has been criticised on a number of fronts, and there is ongoing interest in the refinement of interventional techniques and patient selection, and plaque imaging may play a role in this. Early reports of the reproducibility of these HR techniques show excellent inter- and intra-observer reliability for identification of plaques, and contrast enhancement, with substantial agreement for presence of intra-plaque haemorrhage [47]. However, future work to correlate clinical outcomes with HR imaging findings is required.
Mechanisms of Stroke
Ischaemic stroke resulting from occlusive disease of the intracranial arteries can be broadly classified according to its mechanism into thrombotic occlusions, embolic occlusions and perforator occlusions. Initially introduced as part of the TOAST study [48], this traditional classification is limited because a proportion of strokes remain unclassifiable, or represent a mixture of aetiologies. Newer classification systems, such as the Causative Classification System (CCS) [49] and ASCOD phenotypic system [50], aim to improve classification in these circumstances. The prevalence of individual subtypes is widely variable between studies, and between populations and races [51]. Broadly, however, the relative prevalence of the major subtypes ranges between 15 and 40 % for large artery atherosclerosis, 15 and 30 % for embolic and 15 and 30 % for lacunar infarcts [52]. The coexistence of multiple mechanisms is also recognised as is the importance of factors such as cerebrovascular reserve and collateral circulation [53].
Patterns of Atherosclerosis
The most common site of intracranial atherosclerosis is the carotid siphon. However, atherosclerotic disease at this site has a relatively more benign course than extracranial carotid disease; one study found no relation between disease at the siphon and recurrent stroke following carotid endarterectomy [54, 55].
The most well-studied parts of the intracranial circulation are the MCAs and the vertebrobasilar system. In comparison, there is relatively little literature on the significance of ACA and PCA disease. This may be explained by the relatively low incidence of ACA stoke and the rarity of ACA atherosclerosis [56].
ICAD is also not a static disease. MRA has been used to define progression, demonstrating that symptomatic lesions progress in up to 29 % and regress in 15 % [57].
The clinical significance of intracranial arterial stenosis has been less well defined than that of carotid bifurcation stenosis. In part, this may be due to the difficulty of the detection of such small lesions. One early clinicopathological study [58] detected a relatively low rate of MCA atherosclerosis and attributed the primary cause to the proximal ICA. More recent studies have suggested higher rates of intracranial atherosclerosis [59] [60], and this has prompted recent commentators to suggest that this early underestimate established a precedent favouring the investigation of extracranial atherosclerosis [61].
Intracranial ICA stenosis has also been reported to have a higher incidence of borderzone infarction than extracranial ICA stenosis [62]. There has been one report that this type of pattern may be due to embolisation [63], a mechanism previously implicated in the pathophysiology of borderzone infarction [64]. However, neither pattern is specific; both patterns become more frequent as the degree of stenosis increases [65]. Another infarct pattern is the phenomenon of pure subcortical infarction (cortex sparing) in the context of MCA stenosis or occlusion [66], which if shown on structural imaging should prompt the review of vascular imaging.
MCA Atherosclerosis
Intracranial arterial stenosis has long been recognised as a risk factor of recurrent stroke [67] [68]. More recent studies have also established intracranial arterial stenosis as a risk factor for recurrent events after transient ischaemic attack (TIA) in both early (within 7 days) and late (90 days) phases [69] [70] (Fig. 6). This finding is not universal; the Trial of Cilostazol in Symptomatic Intracranial Arterial Stenosis (TOSS)-2 found instead that initial ischaemic lesion pattern was a better predictor than the presence of arterial stenosis [71]. However, the high-risk pattern of peripheral subcortical infarction may be a manifestation of severe stenosis, as turbulent blood flow may be more likely to cause plaque rupture and distal embolisation [72].
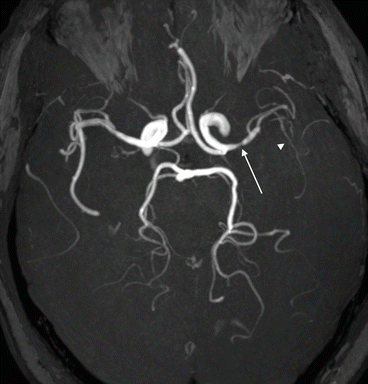

Fig. 6
MCA stenosis. (a) Axial thick-slab MIP projection of 3D TOF MRA. A severe stenosis of the left MCA (arrow) is present in this patient who presented recurrent “crescendo” left hemisphere TIAs. The more distal left MCA branches show reduced flow-related signal indicative of reduced flow (arrowhead)
However, the symptomatology of intracranial stenosis may be different to that of extracranial stenosis: MCA stenosis-related MCA-territory ischaemic events are reported to have lower NIHSS scores than ICA disease [73] [2]. The presence of MCA stenosis has been correlated with the presence of more “central”, lenticulostriate perforator territory infarction, which would not be unexpected, given the origin of these perforating branches from the M1 segment [74] (Fig. 7).
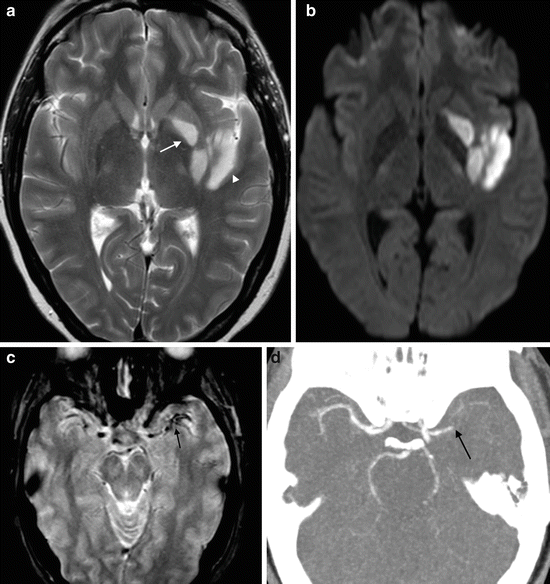

Fig. 7
MCA thrombosis. (a) Axial T2 image in a patient with acute right hemiparesis shows signal abnormality in the left putamen (arrow) and left insula cortex (arrowhead). (b) DWI shows hyperintensity in congruent regions, indicating acute infarction. (c) Axial T2* imaging shows hypointensity of the left M1 and M2 branches. Magnetic susceptibility due to deoxyhemoglobin in thrombus results in “blooming” and signal dropout. (d) CT angiogram confirms occlusion of the left M1
Vertebrobasilar Atherosclerosis
The vertebrobasilar system is also frequently affected by atherosclerosis, although large vessel disease is the major cause of stroke within the posterior circulation. The presence of basilar atherosclerosis is also correlated to more extensive large vessel disease and diffuse intracranial disease [75]. Atherosclerotic disease of the vertebral arteries is most commonly extracranial. However, intracranial VA disease (Fig. 8) is well recognised and can result in occlusion of medullary branches with subsequent infarction [76].
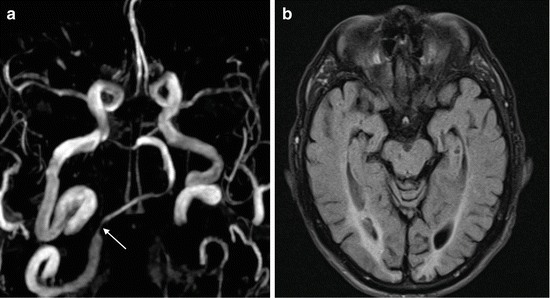

Fig. 8
Vertebral artery stenosis. (a) Oblique MIP image from TOF MRA shows severe stenosis of the right intracranial VA (arrow). The left VA (not shown) is hypoplastic. (b) Axial FLAIR image shows bilateral infarction of the medial occipital lobes
However, the branch vessels of the vertebrobasilar system, most importantly, the posterior inferior cerebellar arteries, superior cerebellar and posterior cerebral arteries, may also be affected by emboli. In the presence of atherosclerotic (both intra- and extracranial) disease, there may be artery-to-artery embolisation [77].
The mid segment of the basilar artery (BA) is a common site for atherosclerosis. Ischaemia may occur due to haemodynamic insufficiency, occlusion or distal embolisation. Basilar perforator branch occlusion is also a relatively common pattern of infarction. The imaging pattern in this case is of a lacunar infarct within the brainstem (often unilateral), commonly in the pons (Fig. 9). As is the case with VA disease, artery-to-artery embolisation is common, and distal emboli can be shown.
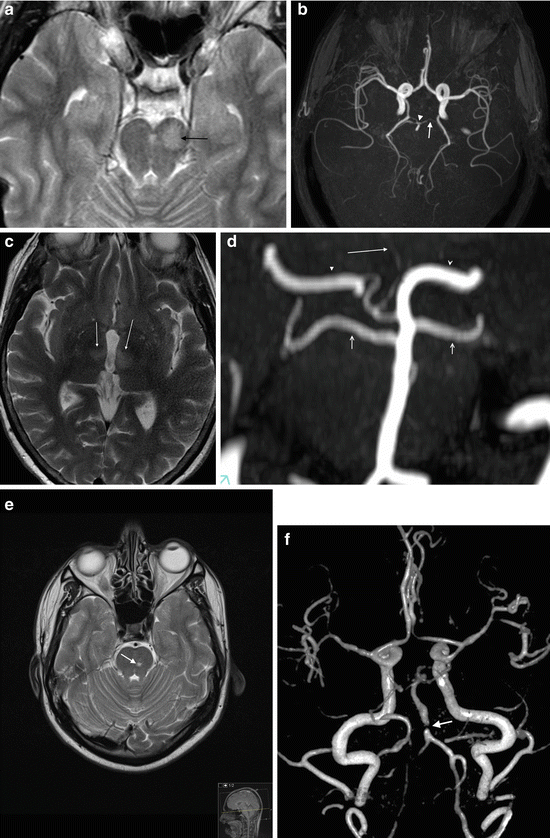

Fig. 9


Basilar perforator branch occlusion. (a) Axial T2 image showing acute infarct in the left of the midbrain (arrow). (b) Axial MIP of 3D TOF MRA shows a congenitally hypoplastic left P1 (arrow) and irregularity of the basilar tip. Perforator branches arise from the P1 segments and P2 segments. Embolisation to one of these vessels is thought to be the cause in this patient. (c) Axial T2 image in a different patient showing bilateral medial thalamic infarction, due to occlusion of a developmental variant of a PCA perforator branch (the artery of Percheron). (d) Coronal MIP of TOF MRA in a different patient shows the artery of Percheron arising from a single P1 (right) to supply both medial thalami (arrow). The right P2 segment (arrowhead) is shown with dominant supply from the posterior communicating artery. The left PCA is supplied primarily from the basilar (open arrowhead). The superior cerebellar arteries are shown arising from just below the basilar tip (open arrows). (e) Axial T2 image showing a small lacunar pontine infarct (arrow). (f) Volume-rendered/shaded image from TOF MRA showing mid basilar stenosis (arrow)
Stay updated, free articles. Join our Telegram channel

Full access? Get Clinical Tree


