Fig. 1
BOLD MRI of the brain showing activation in motor gyrus as response to a finger tapping task. BOLD imaging in this patient with a low grade glioma was performed preoperatively for surgical planning
Similar to neuronal tissue, skeletal muscles offer pronounced alterations of microvascular blood flow depending on the degree of resistance vessel vasodilatation (Boushel et al. 2000). During muscular activity, local arteriolar smooth muscle contraction is mainly reduced via local mediators such as pCO2, H+/lactate, K+, adenosine, NO, and recently discovered myokines such as IL-6, IL-8, and IL-15 (Sarelius and Pohl 2010; Pedersen et al. 2007). The first attempts to use these large functional variations of muscular perfusion in BOLD MR imaging were performed in the late 1990s.
In one study, an arterial occlusion paradigm (see Paradigms and related time courses) was applied to show that the T2* signal in a gradient echo sequence decreases during ischemia and shows a fast surge to a pronounced peak approximately 30 s after reactive hyperemia (Toussaint et al. 1996). Both effects were mainly attributed to the susceptibility effect of deoxyhemoglobin on protons in the vessel surrounding already known from BOLD studies of the human brain. This hypothesis was strengthened by the finding that mean ∆R2 correlated well with perfusion as measured indirectly by MR plethysmography during reactive hyperemia. Another study from this early muscle BOLD era further supported the fact that hemoglobin oxygenation is mainly responsible for the T2* signal since the desaturation of muscle myoglobin—as measured with MR spectroscopy—started later and slower when compared with the T2* signal dropout during ischemia (Lebon et al. 1998a). Given the strong functional relationship between neuronal activity and BOLD signal changes in the human brain, it is quite interesting that first comparable studies, investigating the physiological relationship between muscle contraction and T2* signal changes, were not undertaken until the beginning of the early 2000s. In a first report, specific transient T2* signal boosts were discovered in the calf after short 3 s lasting isometric muscle tension exercises with the gastrocnemius or soleus muscles (see Paradigms and related time courses) (Hennig et al. 2000). Interestingly, those muscular hemodynamic responses bared similar inherent time constants when compared with neuronal tissue, indicating a possible common coupling mechanism between oxygen demand and blood supply in both tissues. Another study using a comparable exercise paradigm with short muscle contractions demonstrated a good temporal correlation between stimulation induced BOLD signal surges and hemoglobin saturation as measured by near infrared spectrometry (NIRS) (Meyer et al. 2004). This correlation could even be clarified in a recent work by Towse et al. showing that hemoglobin oxygenation plays a major role in muscle BOLD signal changes, depending primarily on perfusion and blood volume (Towse et al. 2011). They proposed that—at least with regard to exercise paradigms—muscle activity induces an increase of blood volume in the local microcirculation that, depending on hemoglobin’s oxygenation status, lead to a positive (in case of an increase of the oxy- to deoxyhemoglobin ratio) or negative (in case of a decrease of the oxy- to deoxyhemoglobin ratio) BOLD response.
These major determinants of the BOLD effect in skeletal muscle, i.e., hemoglobin oxygenation, perfusion, and blood volume, have also been found to play a pivotal role with regard to arterial occlusion paradigms. The increase of muscle perfusion—as measured by arterial spin labeling (ASL)—has been shown to be strongly associated with BOLD signal peaking (Duteil et al. 2006). This effect was closely dependent from the venous filling state, with extensive venous filling producing a larger BOLD response. The muscular BOLD response has also been compared with standard clinical diagnostic tools for the assessment of tissue perfusion (i.e., laser Doppler flowmetry, LDF) and oxygenation (i.e., transcutaneous oxygen pressure measurement, TcPO2) (Ledermann et al. 2006a). Although LDF and TcPO2 measurements are limited to superficial skin layers and do not measure perfusion or oxygenation changes in the muscle tissue, the BOLD signal in the calf muscles was closely correlated with blood flow and oxygenati on during ischemia and reactive hyperemia.
In the case that perfusion and volume dependent hemoglobin oxygenation changes are the main source of the BOLD effect in skeletal muscle, one would expect that primarily intravascular relaxation effects are responsible for the measured T2* changes in muscle tissue. According to experimental data and numerical simulations from the last decade this is indeed the case (Meyer et al. 2004; Sanchez et al. 2010). Sanchez et al. were able to eliminate T2* changes induced by arterial occlusion using an inversion-recovery sequence to null the arterial signal, showing that a significant extravascular contribution to the bulk muscle BOLD contrast could be ruled out (Sanchez et al. 2010).
Taken together, the current evidence of skeletal muscle BOLD MRI supports a model, in which alterations of muscle perfusion lead to blood volume changes that—depending on the oxygenation status of hemoglobin—increase or decrease the T2* signal. Of course, further work will need to be done to fully understand the mechanisms yielding a BOLD response in muscle tissue. It has to be taken into account that the qualitative and especially the quantitative influence of each physiological parameter on the BOLD signal might change under different experimental conditions and imaging paradigms. However, as the skeletal muscle tissue represents the “end organ” of the peripheral vasculature, BOLD MRI is a promising and evolving imaging method for the functional evaluation of vascular diseases, such as peripheral arterial occlusive disease (PAOD), diabetes mellitus, compartment syndrome, and the majority of rheumatic diseases (Partovi et al. 2012b).
2.1.2 Technical Fundamentals of BOLD MRI
BOLD MRI of skeletal muscles is usually performed in whole body MRI scanners with magnetic field strengths ranging between 1.5 and 4 T. Consecutively, it is possible to analyze every muscle within the body, but—with regard to accessibility for cuff compression and typical clinical questions—usually arm or leg muscles are imaged. Regardless of the paradigm used, it is crucial to place the individual on the MR examiner couch for 10–15 min prior to the beginning of the examination to prevent extensive filling of venous vessels that will impact the results (Duteil et al. 2006).
As oxygenation changes appear in a short time frame, BOLD imaging needs high-speed acquisition methods. These are generally based on echo-planar imaging (EPI) (Howseman and Bowtell 1999). BOLD signal alterations of conventional single-shot EPI are sensitive to changes in T2* and T2—reflecting oxygenation—and initial BOLD signal intensity (S 0). S 0 is influenced by several confounding parameters such as blood inflow, changes in T1, and baseline drifts (Speck and Hennig 1998; Schulte et al. 2001). With Multi-echo gradient-echo EPI sequences it is possible to isolate oxygenation-related changes (T2*) from these other effects (Ledermann et al. 2006b; Schulte et al. 2008). With each excitation, images at different effective echo times usually ranging between 7 and 80 ms are acquired (Jacobi et al. 2012; Ledermann et al. 2006b; Kos et al. 2009). Acquisition parameters have to be adjusted to the short T2* (<20 ms) in skeletal muscle.
Several studies have shown that the magnetic field strength has a significant impact on the extent of R2* changes in skeletal muscle in both, arterial occlusion and exercise paradigms (Meyer et al. 2004; Lebon et al. 1998b; Partovi et al. 2012c). Partovi et al. directly analyzed the relation between ∆R2* and the magnetic field (B 0) strength using 1.5 and 3.0 T whole body scanners (Partovi et al. 2012c). This study showed a nearly proportional relationship between B 0 and ∆R2*, being in good concordance with previous studies evaluating this relationship in the human brain (Fig. 2) (Turner 1997; Gati et al. 1997; Van der Zwaag et al. 2009).
Fig. 2
∆R2*max values at 1.5 T (blue) and 3.0 T (red) BOLD MRI of soleus a and gastrocnemius b muscle in each of the eight examined volunteers. From Partovi et al. (2012c). This material is reproduced with permission of John Wiley and Sons, Inc
Spin echo sequences (T2) may also be applicable for BOLD imaging but offer a bad temporal resolution. Additionally, gradient echo sequences emphasize local magnetic field distortions induced by paramagnetic species such as deoxyhemoglobin. To facilitate and improve the placement of the ROIs on T2* maps calculated from the EPI data, T1-weighted images of the same layers should also be obtained. With regard to the placement of regions of interest (ROI) for extracting the T2* dataset, this enables avoidance of visible vessels from the BOLD measurement to minimize inflow artifacts (Fig. 3).
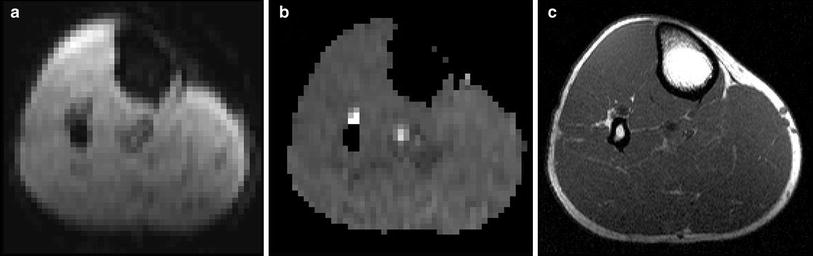
Fig. 3
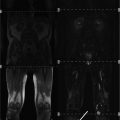
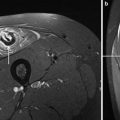
Echo-planar-imaging (a), T2* map (b) and T1 anatomical reference image (c) of a healthy 34-year-old volunteer showing the upper region of the left calf. Anatomical reference is used to map ROIs in the T2* maps and to exclude visible vessels which could influence the BOLD signal
2.1.3 Paradigms and Related Time Courses
BOLD imaging of skeletal muscles is based on the principle of temporal changes in the ratio between oxy- and deoxyhemoglobin inside skeletal muscle microvessels, that lead to an endogenous contrast in T2/T2* MR sequences. To provoke measurable BOLD signal alterations in skeletal muscles, different imaging paradigms have been developed. The most often applied paradigms are arterial occlusion (= cuff compression), muscle exercise, and oxygen inhalation.
Arterial occlusion is probably the most often applied imaging paradigm in skeletal muscle BOLD MRI. This may be due to its early implementation at the beginning of the evaluation of BOLD MRI in skeletal muscle tissue and several advantages when compared with other BOLD muscle MRI settings (Toussaint et al. 1996; Lebon et al. 1998a). Arterial occlusion contains a simple experimental setup, in which a standard air cuff is wrapped around the mid-thigh or upper arm of the examined extremity (Fig. 4). If the device consists of ferromagnetic parts, a safe distance from the magnet should be achieved by using an extended tube. Fast (automated) inflation of the air cuff to an occlusion pressure at least 50 mmHg above the individual systolic blood pressure is needed to induce complete ischemia and, on the other hand, minimize the discomfort of patients with vascular disease and reduce their risk of exacerbating critical limb ischemia. Medial calcific sclerosis (Mönckeberg’s arthrosclerosis) should be considered if higher cuff pressures are needed to achieve full ischemic conditions, especially in patients with diabetes. MR measurements are usually started during resting state (reflecting baseline), ischemia and during reactive hyperemia after cuff deflation till reaching baseline level. The most important advantage of this paradigm for skeletal muscle BOLD MRI is the induction of profound oxygenation changes and a consecutively excellent BOLD contrast. Furthermore, this paradigm is independent from patient compliance, it can be standardized in the clinical setting and motion artifacts—as known from BOLD imaging of the brain or exercise paradigms in muscle tissue—are reduced to a minimum. The BOLD signal time courses extracted from studies with arterial occlusion paradigms typically show a faster initial T2* signal decay at the beginning of ischemia followed by a slower decrease to a minimum ischemic value (MIV, T2* min) (Fig. 5). After cuff deflation, a fast surge of the BOLD signal is observed with peak values (HPV, T2* max) after approximately 30–60 s (Time to peak, TTP) and a subsequent decrease to a steady state value around baseline. A recent study performed with a lower limb phantom and healthy volunteers revealed that compressed oxygen from an air cuff can induce magnetic susceptibility changes leading to a fast decline of the T2* signal (Yeung et al. 2012). This T2* signal dropout proofed to be pressure-dependent and could also be localized in the contralateral leg of the examined volunteers, where the blood flow was not interrupted (Fig. 6). These interesting results call for a critical reevaluation of the described fast initial signal dropouts during the ischemia phase of arterial occlusion studies. Furthermore it has to be evaluated, if cuff position can be optimized or special inflation gases without effects on magnetic susceptibility, such as nitrogen, need to be used in this setting in the future.
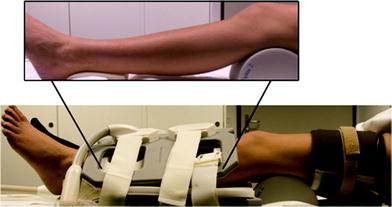
Fig. 4
Experimental setup of an arterial occlusion paradigm including two flexible array coils and sphygmomanometer wrapped around the thigh of the investigated leg. The cuff was additionally fixed with a velcro strap. The lower leg was supported at knee and foot level (insert) to prevent compression of the calf muscles. From Jacobi et al. (2012). This material is reproduced with permission of John Wiley and Sons, Inc
Fig. 5
Typical BOLD T2* time course extracted from a 30-year-old male healthy volunteer during an arterial occlusion paradigm showing the typical signal decrease during a 3 min lasting ischemia period and a T2* surge after cuff deflation with subsequent hyperemia peaking after approximately 40 s (TTP)
Fig. 6
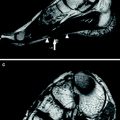
T2* dynamic images (upper panel) acquired from both legs of a healthy female volunteer with corresponding ROIs (left leg: blue; right leg: red). Ischemia was only induced at the left leg. An aberrant fast initial T2* signal drop could be detected in the left tibialis anterior muscle. The similar pattern was also detected in the non-occluded right leg. From Yeung et al. (2012). This material is reproduced with permission of John Wiley and Sons, Inc
Muscle exercise paradigms have also been applied in a variety of muscle BOLD studies. They take advantage of the physiological coupling between muscle contraction and local perfusion. It has been shown that brief isometric contractions of only 1 s are sufficient to evoke measurable BOLD responses (Hennig et al. 2000; Meyer et al. 2004). The peaking of such responses follows approximately 8 s after each contraction induced motion artifact and the baseline value is reached again after 10–15 s (Meyer et al. 2004). Those BOLD responses have been proven to be dependent on the muscle contraction intensity (Wigmore et al. 2004). Although being the most “physiological” of the usually applied paradigms in skeletal muscle BOLD imaging, voluntary muscle contractions are largely dependent on patient compliance. Thus, standardization in the clinical setting seems to be challenging. Motion artifacts are a further drawback and require the use of specific fixation devices.
Oxygen inhalation has been used to provoke a BOLD signal increase of skeletal muscle (O2-enhanced MRI) (Noseworthy et al. 1999, 2003). Prior to MR imaging, the individual breathes 100 % oxygen for several minutes to increase the amount of dissolved O2 of the blood. As arterial hemoglobin is nearly completely saturated with oxygen under normal conditions, it has been proposed that the BOLD response of muscle tissue in oxygen inhalation paradigms is primarily increased via an oxygen uptake by venous deoxyhemoglobin (Noseworthy et al. 2003). However, O2 itself is paramagnetic and leads to changes of T1, T2, and T2*. Studies using this paradigm should thus be analyzed with care regarding true BOLD effects that depend on hemoglobin oxygenation (Partovi et al. 2012b).
2.1.4 Important Parameters Influencing Muscle BOLD Signal
Different parameters have been shown to have a certain influence on the T2/T2* signal of skeletal muscles. The most prominent role among those factors play age, weight, physical activity, examined muscle fiber type, intake of vasoactive drugs, and Hb-content, some of which will be further discussed in this section. Regardless of performing skeletal muscle BOLD studies in a preclinical or clinical setting it is crucial to take these parameters into account since they may possibly confound the results.
Aging leads to specific structural and functional impairments of skeletal muscle vasculature that result in an increased vascular rigidity and decreased perfusion reserve (Muller-Delp 2006; Proctor et al. 2003). Those alterations might explain the BOLD T2* max and TTP reduction found in elderly volunteers (mean age 64.0 years ± 6.4, n = 11) after cuff induced reactive hyperemia when compared with younger subjects (mean age 30.3 years ± 6.5, n = 17) (Schulte et al. 2008). However, due to the missing correlation with methods enabling to investigate the relationship to blood volume, perfusion, or oxygenation, the authors could only speculate with regard to the noticeable elevated end value after 350 s of hyperemia in the older study collective (Fig. 7). During cuff induced ischemia, a significant reduction of T2* min and delay of the T2* decrease (Time to reach half ischemic minimum, THIM) has been described in the elderly (Kos et al. 2009). Interestingly, this ischemia BOLD pattern does not match the alterations found in patients with peripheral arterial occlusive disease (PAOD, see Clinical applications), indicating that further mechanisms beside atherosclerosis play a role in vascular aging.
Fig. 7
Mean BOLD responses of four investigated calf muscles during 360 s of reactive hyperemia in elderly healthy subjects (gray lines) and young healthy subjects (black lines). Note, the significantly lower T2* hyperemia peak value (P = 0.005) and significantly elevated T2* end value (P < 0.001) in the elderly group compared with the younger individuals. From Schulte et al. (2008). This material is reproduced with permission of Radiological Society of North America (RSNA)
Increased body weight is associated with vascular dysfunction and decreased vasodilatation reserve (Gu and Xu 2013). For this reason, it is not surprising that the BOLD response of skeletal muscle tissue is also compromised in obese patients when compared with lean people. However, this effect could only be detected at a level of significance in one of the examined muscles (extensor digitorum longus), at maximum voluntary contractions and a short TE of 6 ms, primarily reflecting blood volume changes (Sanchez et al. 2011).
Slow-twitch oxidative muscles (i.e., soleus, tibialis anterior) show a higher capillary density and myoglobin content than fast-twitch glycolytic muscles (i.e., gastrocnemius, extensor digitorum longus) (Noseworthy et al. 2003; Zierath and Hawley 2004). Consecutively, the largest BOLD responses are usually detected in slow-twitch muscles, whereas smaller changes are typically found in fast-twitch muscles (Ledermann et al. 2006b; Noseworthy et al. 2003; Donahue et al. 1998). Regarding the high oxygen sensitivity of BOLD MRI and the interindividual variation of absolute T2* values, the selection of the optimal muscle type to investigate is crucial to obtain significant results when assessing patient and control collectives.
With regard to the activity level, individuals reporting to participate in aerobic sports greater than 30 min per day for at least 5 days a week bear an up to threefold larger BOLD signal increase when compared with sedentary individuals reporting no regular physical activity (Towse et al. 2005, 2011). The relation of constant physical activity to the oxygenation status of skeletal muscle microcirculation may obviously be explained by vascular adaptations such as increased capillary density, collateral blood flow, and exercise-provoked vasodilation (Green et al. 2011, 2012). Thus, it will be helpful to control for the physical activity level in muscle BOLD studies, for example by using an adapted questionnaire. Furthermore, even brief exercising over several minutes prior to BOLD imaging induces a remarkable T2* increase in the exercised muscles and thus has to be avoided in clinical settings (Bulte et al. 2006).
Especially in (pre)clinical muscle BOLD studies with patient collectives suffering from vascular diseases, the intake of vasoactive drugs might be a problem which has to be taken into account. As the BOLD response has been shown to be primarily dependent on perfusion induced blood volume and oxygenation changes, drugs affecting the vasodilatation capacity will influence the measured BOLD signal changes. Indeed it has been demonstrated that drugs inducing vasodilatation significantly increased oxygen- and ischemia-induced BOLD responses, whereas vasoconstrictors significantly reduced ∆T2* (Bulte et al. 2006; Utz et al. 2005).
2.2 Clinical Applications of BOLD MRI
2.2.1 Peripheral Arterial Occlusive Disease
The morphological correlate of peripheral arterial occlusive disease (PAOD) is stenoses and occlusions in peripheral arteries leading to impaired blood supply to the end organs, such as the muscular system and the skin. Symptoms ranging from claudication to gangrene are the sequela of these morphological changes. Stenoses on the arterial level can be detected non-invasively with magnetic resonance angiography (Prince 1998; Rofsky and Adelman 2000) or color-encoded doppler ultrasonography (Leng et al. 1991). In a couple of studies muscle BOLD MRI proved to be useful for non-invasive assessment of PAOD. In one of the earlier studies BOLD MRI during the hyperemic phase using the arterial occlusion paradigm has been investigated in PAOD patients versus an age-matched healthy volunteer group. Despite inducing ischemia by cuff compression followed by hyperemia after pressure release, the paradigm was well tolerated with minor discomfort in the patient group. In comparison to the healthy volunteers the BOLD time course in PAOD patients showed a decreased T2* max and a delayed TTP (Fig. 8) (Ledermann et al. 2006b). The lower T2* max might be caused by a slower flow of blood through the muscle microvasculature resulting in efficient deoxygenation of hemoglobin and by a rarefaction of capillaries in the calf muscle as a result of the disease as it was found in previous studies (Hickey et al. 1992; Dawson and Hudlicka 1990). The delayed TTP might be based on impaired flow of oxygenated blood into the microcirculatory system of the calf muscle (Lebon et al. 1998a). Besides a relationship between TTP and the ankle brachial pressure index could be demonstrated; with some exceptions a lower ankle brachial pressure index was associated with a higher TTP (Ledermann et al. 2006b). Muscle BOLD MRI investigations during the ischemic phase in PAOD patients have been published as well. A significant altered T2* time course in comparison to an age-matched healthy volunteer group was found (Potthast et al. 2009). The T2* min was lower in the PAOD group versus the non-PAOD group (Fig. 9).
Fig. 8
BOLD T2* signal changes of a male PAOD patient (stage IIA) during reactive hyperemia is shown in green. For comparison, a normal T2* time course of a healthy 67-year-old female volunteer is shown in red. Pay attention to the profoundly decreased T2* recovery during reactive hyperemia with no obvious peak in the patient with PAOD
Fig. 9
T2* time course of a 36-year-old female PAOD patient (stage IIa, green line) with a marked reduction of T2* decline during ischemia. In red, a normal T2* time course of a healthy 52-year-old male is shown with a substantially lower MIV at the end of ischemia
The BOLD sequence as part of a multiparametric MR imaging protocol is highly interesting for therapy response evaluation. A study monitored PAOD patients longitudinally 1 day before and 6 weeks after percutaneous transluminal angioplasty (PTA) performing muscle BOLD MRI. The arterial occlusion paradigm was well tolerated in this PAOD patient population as well, proving the feasibility of the innovative technique (Huegli et al. 2009). The cuff compression paradigm is advantageous for clinical use as it does not require compliance and its standardization is easier than an exercise based approach (Berglund and Eklund 1981). It can be safely applied in PAOD patients with intermittent claudication. However, those with higher grade of the disease (critical limb ischemia or necrosis) were not enrolled in previously published studies because of a theoretical risk of exacerbation when ischemia is provoked in the early phase of the paradigm (Huegli et al. 2009). After PTA T2* max increased, whereas TTP and EV decreased but these changes in BOLD key parameters did not reach statistical significance. However, they demonstrated a trend resulting in reversal of the BOLD response towards a normal healthy course. Post PTA T2* max increase can be explained by improved blood supply and TTP decrease might be based on a more effective and faster flow through the re-opened superficial femoral arteries. Another reason for the higher T2* max is an improved vasodilatation reserve after percutaneous intervention. The decreased EV found in this study might be explained by a fast washout of oxygenated blood from the musculature.
A recently published study analyzed the reproducibility of imaging techniques for the assessment of the macro- and microcirculatory network in a PAOD patient collective in comparison to a healthy volunteer group. The evaluation of the microcirculation included dynamic BOLD imaging during the hyperemic phase performing the arterial occlusion paradigm. For BOLD imaging reproducibility was not demonstrated. In detail the key parameter relative T2* max revealed poor reproducibility, whereas TTP showed moderate reproducibility (Versluis et al. 2011). Further studies with a standardized paradigm and imaging parameters are warranted to improve the reliability of the BOLD response. A potential alternative to muscle BOLD MRI for assessment of PAOD is contrast-enhanced ultrasound. A recently published study on healthy volunteers used an arterial occlusion paradigm for muscle perfusion quantification performing contrast-enhanced ultrasound. The arterial occlusion paradigm can be applied in patient populations, such as in subjects with PAOD for the evaluation of skeletal muscle microperfusion (Krix et al. 2011). Another study also showed that contrast-enhanced ultrasound is able to diagnose PAOD by detecting skeletal muscle microperfusion and arterial perfusion reserve alterations (Amarteifio et al. 2011).
2.2.2 Rheumatic Disorders
The skeletal muscle tissue is the functional end organ of the peripheral vascular system. In patients with rheumatic disorders BOLD MRI has the potential to contribute to non-invasive evaluation of the clinically relevant microcirculatory system disorders. Furthermore, in those patients with symptoms of the musculoskeletal system muscle BOLD MRI may even elucidate the cause as subclinical microcirculatory alterations.
In a recently published case study a female patient with a history of granulomatosis with polyangiitis (also known as Wegener’s granulomatosis) presented with bilateral severe myalgia (Jacobi et al 2013). The patient had no signs of atherosclerotic disease and no associated risk factor for macrovascular compromise. Morphological MR with T2 weighted images did not reveal any signs of inflammation explaining the symptoms of the patient. However, BOLD MRI could demonstrate pronounced impairment of calf muscle microcirculation. In comparison to the BOLD signal time course of a matched healthy volunteer substantial differences in key parameters were shown: The T2* min was decreased and the declining slope during ischemia was increased in the patient. The lower MIV might be explained by small vessel vasculitis leading to a larger amount of oxygen consumption.
Investigations of the BOLD response in systemic sclerosis (SSc) patients generated interesting results. SSc is a disease with microangiopathy leading to insufficiency in a variety of tissues (Gabrielli et al. 2009). Up to one-third of patients have symptoms in the musculoskeletal system (Walker et al. 2007). In a study the microvasculature of SSc patients was analyzed performing BOLD imaging of the calf muscle with the arterial occlusion paradigm. Impaired muscle microcirculation was demonstrated by altered BOLD time courses in the patients compared to a healthy volunteer control group (Partovi et al. 2012d). Key parameters were significantly different with lower T2* max, T2* min, declining slope values and a prolonged TTP. Lower T2* min might be based on rarefaction of capillary or occlusion of the microcirculatory system. The hyperemia parameter differences might be the result of structural (capillary loss or obliteration) or functional (vasoconstrictor effect or decreased vasodilatation reserve) vasculopathy. BOLD response alterations have been found to be more pronounced in the gastrocnemius than the soleus muscle in this study. A further study with SSc patients tried to elucidate the origin of altered muscle BOLD MR time courses by means of correlation with transcutaneous oxygen pressure (TcPO2) measurements. TcPO2 is a technique utilizing the modified Clark electrodes and reflecting the tissue oxygenation status (Bunt and Holloway 1996; Slagsvold et al. 1992). A comparison with healthy volunteers was included in the analysis as well. Very strong cross correlations between both imaging techniques in the patient and healthy volunteer group were demonstrated for a time lag of approximately 40 s (Partovi et al 2013). This proves BOLD MRI as a valuable tool for the assessment of patients with SSc as it reveals oxygen deficits in this patient population. The origin of the T2* signal of BOLD MRI can be explained at least partially by tissue oxygenation alterations. When comparing the signal course of both modalities, the T2* decrease was more pronounced than the decrease of the TcPO2 signal during ischemia. From a pathophysiological standpoint this lower signal might be caused by the adaption of the microcirculatory system to chronic hypoxia leading to a pronounced capillary oxygen consumption. T2* max and the TcPO2 signal were lower in the patient population versus healthy volunteers which is based on either structural or functional vasculopathy as discussed above. In the future vasoactive drugs might help to further clarify whether the structural or the functional component contributed to the BOLD response or if both components impact the signal to a certain degree (Bulte et al. 2006). Furthermore muscle BOLD MRI correlations in SSc patients with laser Doppler flowmetry are of interest (Fagrell 1986; Ranft et al. 1986) (Fig. 10).
Fig. 10
BOLD time courses of a 53-year-old male SSc patient (blue) and a 26-year-old healthy female volunteer (red) showing a clear reduction of T2* min and T2* max in this rheumatic disorder
2.2.3 Diabetes Mellitus
It is well known from a clinical perspective that the microvasculature is impaired in patients with diabetes mellitus type I and type II (Picchi et al. 2010; Marcovecchio and Chiarelli 2011). Muscle BOLD MRI was assessed in patient with diabetes mellitus type I and II versus healthy controls conducting maximal isometric ankle dorsiflexion for 1 s (muscle exercise) as paradigm. The authors of this study also evaluated the distal macrovasculature with phase contract MR angiography. No significant differences in the BOLD response between patients and healthy controls could be found. There was also no different in the findings from phase contract MR angiography. This study could confirm the impact of age on the BOLD signal time course (Slade et al. 2011). Combining BOLD with a technique to assess macrovasculature is a promising approach towards functional musculoskeletal imaging.
For assessing the microvasculature of the skeletal muscle in patients with diabetes mellitus contrast-enhanced ultrasound could be an interesting imaging modality. Contrast-enhanced ultrasound in patients with diabetes mellitus type II performing the arterial occlusion paradigm revealed impaired skeletal muscle microperfusion in comparison to healthy volunteers (Amarteifio et al 2013).
2.2.4 Compartment Syndrome
For certain applications it was suggested to integrate muscle BOLD MRI and other advanced MR techniques in one imaging protocol. For instance BOLD MRI can be combined with diffusion tensor imaging which enables depiction of muscle tears. In the same publication BOLD MRI was demonstrated to be feasible for the detection of vascular insufficiency in compartment syndrome (Noseworthy et al. 2010).
3 Part 2 Arterial Spin Labeling MRI
3.1 General Principles of ASL
3.1.1 Origin of the ASL Signal
The principal underlying ASL is the selective visualization of fresh inflowing blood into a tissue of interest which can be imaged with this technique. This is achieved by magnetically labeling (or “tagging”) of inflowing arterial blood water proximal of the tissue of interest, generally through inversion or saturation of the longitudinal magnetization using specifically designed radiofrequency (RF) pulses (Detre et al. 1992).
The water molecules, acting as an endogenous contrast agents and carrying the labeled magnetization, travel through the vascular tree to a particular tissue where they are extracted from the microvascular bed and join the larger pool of tissue water distal of the tagging location. Once arriving in the tissue, after a duration termed arterial transit time, the tagged spins induce a measurable change in the apparent tissue T1 signal and in the tissue magnetization, which it is detected by a conventional MR sequence. To produce a control image, the experiment is then repeated without the labeling procedure. Consecutively, the image signals are subtracted in pairs to yield a difference of signal, which enables detection of tagged blood that was delivered to the imaging slice (Fig. 11). This signal directly reflects quantitative local perfusion which is calculated using modifications in the original Bloch equations.
Fig. 11
Principle of ASL MR perfusion imaging. a In ASL MRI, blood serves as intrinsic contrast agent. For this, blood is magnetically labeled by an inversion pulse outside the imaging slice and then flows, depending on the blood flow, into the imaging slice. b The difference between the MR image with and the MR image without labeled blood yields an image with signal only from inflowing blood, whereas background signal is suppressed. This image is the perfusion weighted ASL image. From Weber et al. (2007). This material is reproduced with permission of Springer
However, the tagging sequence produces additional static signals in the tissue to be imaged (a process termed magnetization transfer), and therefore the control sequence must produce an identical signal without labeling the inflowing blood. Provided that the off-resonance and magnetization transfer effects of the tagged and control pulses are equal, the ASL signal is simply proportional to the difference in longitudinal magnetization in the tissue due to the blood that entered the voxel during the defined time interval. The goal of all the ASL techniques is to produce a tagged image and a non-tagged control image in which the static tissue signals are the same.
The essential problem in quantifying the ASL signal is to estimate how much the magnetization of the tagged spins has decayed by the time of measurement, so that the measured ASL signal can be appropriately scaled to represent a quantity of blood delivered to the voxel (Buxton et al. 1998).
For each ASL method, a detailed model of the process combining kinetics and relaxation is needed in order to extract a quantitative measurement of perfusion. Although all of these models rely on the same theoretical background one should take into account that each ASL technique uses different types of parameter values. These parameters include: the degree of arterial spin inversion, transit time from the labeling slice to the imaging slice, T1 of blood and tissue, equilibrium magnetization of arterial blood, clearance of magnetization by venous flow, blood-tissue partition coefficient for water, duration of the labeling pulse, and the amount of blood water extracted by the tissue. These parameters are subsequently used in equations describing perfusion which are derived from the modified Bloch equation.
It should be considered that the ASL calculation of perfusion is not derived from dynamic datasets and does not require deconvolution processing. The ASL signal is directly and linearly proportional to perfusion.
3.1.2 Advantages and Disadvantages of ASL
The main advantage of ASL lies in its complete non-invasive assessment of perfusion and microcirculation. This permits serial measurements without the need for administration of contrast agents. ASL is quantitative in absolute terms and evaluates the actual tissue microperfusion as opposed to blood flow to an organ. The information derived from BOLD imaging can be acquired partially when applying the ASL technique (Duteil et al. 2006; Carlier et al. 2006). Additionally, ASL exhibits relatively high spatial and high temporal resolution. Finally, ASL may be used to conduct non-invasive MR angiography (Katoh et al. 2008; Rehwald et al. 2004; Wheaton and Miyazaki 2012).
The greatest disadvantage of ASL is the intrinsic low signal-to-noise ratio (SNR). The difference in signal between the two images is approximately 1 %, thus multiple images are acquired (consisting of repeats of tag minus control image) which are then averaged. This process is time consuming and makes low perfusion states (such as muscle perfusion at rest) more difficult to quantify, although not impossible.
Since its first demonstration by Detre et al. (1992) and Kwong et al. (1992), ASL has been applied extensively to studies of the brain (Detre et al. 1999; Chalela et al. 2000; Alsop et al. 2000), the heart (Troalen et al. 2013; Kober et al. 2004; Zhang et al. 2005) as well as other organs (such as the kidneys and lungs) (Robson et al 2012; Mai and Berr 1999) including the skeletal muscle (see section below and Fig. 12).
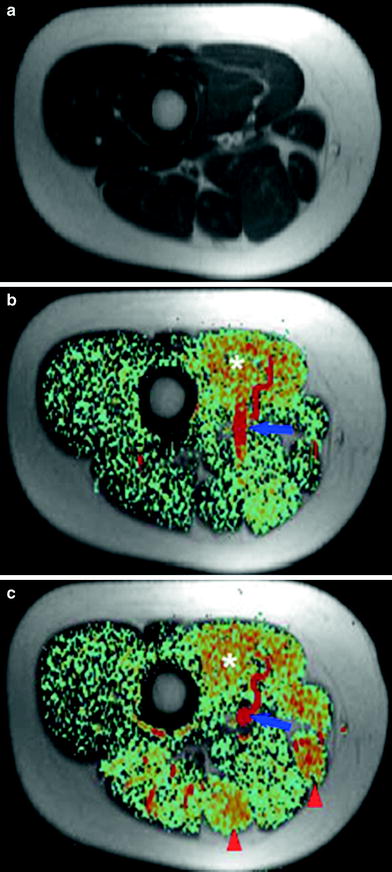
Fig. 12
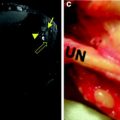
Anatomic T1-weighted image (a) and color-coded perfusion weighted ASL image (b) of the right mid-thigh of a 24-year-old woman at rest on a 1.5-T whole body scanner (PICORE tagging scheme, 10-mm slice thickness, TR = 3,500 ms, TE = 30 ms, inflow time TI = 600 ms, 256–128 matrix, 25 averages, acquisition time TA = 3 min). After knee flexion exercise against a 3-kg weight for 5 min significant hyper-perfusion in all thigh-flexor muscles can be observed (arrowheads), while the adductor muscles (asterisk) already have elevated perfusion at rest-resulting from a preceding exercise test (c). The blue arrow indicates the femoral vessels, which have the highest signal on ASL images. As expected, no perfusion signal appears in bones and subcutaneous fat tissue. From Weber et al. (2007). This material is reproduced with permission of Springer
3.1.3 Sources of Error and Artifacts Associated with ASL
Motion Artifacts: Due to the lengthy acquisitions to achieve adequate SNR, as well as the fact that ASL perfusion imaging involves the subtraction of two images with an intensity almost 100 times larger than the difference between them, ASL scans are susceptible to motion artifacts. Recent technical advances offer several solutions to the problem (Norris and Schwarzbauer 1999; Wong et al. 2006; Frouin et al. 2006; Garcia et al. 2005; Ye et al. 2000; Blamire and Styles 2000; Duyn et al. 2001).
Magnetization Transfer (Discussed Above): Magnetization transfer effects can be a significant source of error in ASL measurements. They can be particularly problematic in skeletal muscle, where magnetization transfer rates are relatively high (Niemi et al. 1992) and can change significantly and rapidly during exercise (Mattila et al. 1993; Zhu et al. 1992).
Post Labeling Transit Time Delay: The exact duration of the transit time is challenging to determine as it is not uniform across a slice or between slices. The artifact results from intravascular labeling that has not yet reached capillaries and tissue by the time the image the acquisition is carried out. As a consequence perfusion might be underestimated.
Alsop and Detre reduced the sensitivity of the continuous ASL techniques to transit time heterogeneity by inserting a postlabeling delay (PLD) (Alsop and Detre 1996). However, this approach still requires a good estimation of the transit time since the optimal delay time equals the transit time. This makes the approach difficult to implement in skeletal muscle where arterial flow velocities can be expected to change considerably between rest and exercise (Wu et al. 2008).
Contribution of Labeled Water in Large Vessels: Intravascular tagged blood flowing through the slice creates large focal intensities, which are unrelated to tissue perfusion. In practice, the signal from large arteries is typically destroyed in the course of the echo-planar imaging acquisition without the need of additional bipolar gradients (Buxton et al. 1998). To further reduce this artifact another possibility is to carefully exclude voxels containing vessels or lipids (which cause large focal intensities as well).
Incomplete Inversion of the Arterial Blood (Labeling Efficiency): In the skeletal muscle blood flow velocity can range from very low to very high levels, potentially resulting in different labeling efficiencies.
Venous Outflow Effect: An implicit assumption in most existing quantitative perfusion models is that the tagged blood does not leave the tissue prior to data acquisition. In situations involving high flow rate this might not hold true. It is particularly important to consider this in investigations in the skeletal muscle, where fast flow rates are encountered as well as conditions associated with low hematocrit levels such as anemia (Wu et al. 2008). Insufficient consideration of these artifacts will result in perfusion estimation errors.
3.2 Technical Principles
According to the tagging scheme, ASL can be divided into four categories: continuous ASL (CASL), pulsed ASL (PASL), pseudo-continuous ASL (pCASL), and alternative labeling schemes.
3.2.1 Continuous ASL
With CASL techniques, the blood is continuously labeled. A spatially localized RF field, positioned through the feeding arteries of the tissue of interest, inverts the longitudinal magnetization of the protons in the blood as they flow through a thin slice. This technique uses long RF pulses. The original scheme proposed only allows quantification of perfusion in a single slice (Detre et al. 1992). This problem was overcome when a new CASL techniques was developed in order to quantify regional cerebral blood flow in multiple slices with a single coil (Alsop and Detre 1998; Talagala et al. 1998).
3.2.2 Pulsed ASL
As opposed to labeling blood as it flows through a plane, PASL relies on the instantaneous labeling of a thick slice (large blood volume) with a short RF pulse (~10–20 ms). PASL sequences are based on a scheme originally referred to as flow-sensitive alternating inversion recovery (FAIR) sequences (Kwong et al. 1995; Kim 1995; Schwarzbauer et al. 1996). In FAIR, an inversion-recovery sequence is performed twice—a labeled one with slice-selective inversion and a control one with nonselective inversion. Following each inversion imaging is performed. The inversion-recovery image with the slice-selective inversion pulse is then subtracted from the image with the nonselective inversion pulse (Fig. 13).
Fig. 13
Principal of FAIR (flow-sensitive alternating inversion recovery). During the tagging phase all the spins in the tagging slice are inverted. Following this, only the spins in the imaging slice are inverted (white box). The difference between the intensity of the imaging slice at both these times delivers the signal, which is used to calculate the blood flow. From Weber et al. (2004). This material is reproduced with permission of Springer
3.2.3 Pseudo-Continuous ASL Techniques
pCASL is a novel labeling scheme that combines the advantages of PASL and CASL (Silva and Kim 1999). The advantages of pCASL include an increase of 50 % in SNR as compared to PASL and a higher tagging efficiency than CASL (Wu et al. 2007). pCASL measurement sequences are available on MR systems of all three major vendors.
3.2.4 PASL versus CASL
Whereas pCASL and PASL can be implemented with standard MR-systems, CASL requires a dedicated coil with a capacity for generating continuous RF pulses (Wu et al. 2011). PASL is performed with shorter repetition times and thus leads to superior temporal resolution (Wong et al. 1998). PASL is also less sensitive to variations in the assumed or measured values of the tissue parameters. BOLD data can be acquired simultaneously with PASL. PASL exhibits lower influence of magnetization transfer (Boss et al. 2006) and inversion efficiency is higher and thus essentially flow-velocity independent.
For PASL, the inherent SNR is lower than that of CASL. However, when tagging efficiency and coil configuration are considered, the SNR is comparable between PASL and CASL and is highest with pCASL (Wu et al. 2011). In addition, CASL techniques are less susceptible to motion interferences (Wong et al. 1998; Frank et al. 1999; Richardson et al. 2001).
3.2.5 Skeletal Muscle ASL
The first ASL measurements of muscle perfusion date back to 1996 (Toussaint et al. 1996). The authors used a CASL-NMR model originally developed by Detre et al. (1992). for the brain, to measure perfusion in the calf muscle of human volunteers during rest, ischemia, and reactive hyperemia. The authors correlated the results successfully with NMR plethysmography and were able to observe significantly different perfusion rates in the various muscle groups.
Flow-Driven Arterial Water Stimulation with Elimination of Tissue Signal
FAWSETS was the first ASL sequence introduced to specifically quantify muscle perfusion (Marro 1997; Marro et al. 2005a). FAWSETS, a CASL technique, differs from other CASL techniques in that the label consists of flow-driven adiabatic excitation rather than saturation or inversion of the arterial water. The technique offers several advantages: It eliminates the need to compensate for magnetization transfer and also for arterial transit time effects. Furthermore, it provides an improvement in time resolution in the range of factor 2. Alas, FAWSETS can only eliminate arterial transit times in a single slice. FAWSTES was conducted in several studies to investigate perfusion in the hind limb of rats (Marro et al. 2005a, b), combining FAWSTES with 31P MR spectroscopy (though not simultaneously) in order to investigate local perfusion and metabolic demand.
Another manuscript presented a further CASL sequence designed to specifically quantify muscle perfusion (Frank et al. 1999) using a standard 1.5-T clinical imaging system fitted with a local gradient self-designed knee coil. The authors applied a modified version of continuous ASL to demonstrate spatially and temporally resolved perfusion images of exercising human skeletal muscle (Alsop and Detre 1996). They were able to demonstrate the spatial heterogeneity of perfusion values within the various muscle groups of the lower leg and perfusion sensitivity to muscle workload. In this manuscript a method for eliminating the most serious sources of error in the measurement of muscle perfusion with ASL was demonstrated as well (Alsop and Detre 1996). This technique was combined later with 31P chemical shift (CSI) imaging to compare metabolic demand and perfusion response to exercise (Richardson et al. 2001).
Saturation Inversion Recovery
The first PASL sequence for the purpose of specifically quantifying muscle perfusion was SATIR (Raynaud et al. 2001). SATIR offers the following advantages: The calculation of perfusion using SATIR is independent of possible T2 variations, which are known to increase in exercising muscles, and of T2* making it insensitive to the BOLD effect. SATIR is highly temporal efficient, displaying a high perfusion contrast per unit of time. The new sequence was utilized to conduct multiple experiments in various setups, combining multiple interleaved additional measurements (termed multiparametric functional-NMR) to study muscle physiology both at rest and at activity (Duteil et al. 2004, 2006; Gerontol et al. 2009; Baligand et al. 2011; Bertoldi et al. 2006; Ménard et al. 2010).
3.2.6 Comparison of ASL and BOLD MRI for Muscle Perfusion
Superiority of ASL
1.
BOLD contrast is of a multifactorial nature. While ASL provides a direct absolute measurement of perfusion changes, T2* weighted BOLD MRI measures the local increases in oxygenation. This should be taken into account when interpreting BOLD information.
2.
The vascular network architecture in skeletal muscle, with a preferential alignment along fibers, may induce an angular dependence of BOLD relative to the Bo field.
3.
ASL is less susceptible to artifacts arising from large draining veins.
4.
The exercising muscle induces an intrinsic T2 increase which can be a confounding effect in BOLD signal interpretation.
6.
ASL perfusion contrast is based on longitudinal magnetization, and as such it is insensitive to bulk susceptibility effects which may impact BOLD studies (Detre and Alsop 1999).
7.
In conditions where angiogenesis is stimulated, associated changes in tissue vascular fractional volume could affect BOLD response to a greater extent than vasodilation itself, thus obscuring the evaluation of the skeletal muscle vasodilatory capacity (Carlier et al. 2006).
Superiority of BOLD
1.
The major advantage that BOLD has over ASL is that while a typical BOLD signal is 2 % of the raw image intensity, a typical baseline ALS signal (control-tag) is only 1 % of the raw image intensity. Although the change in ASL signal can be relatively high, this still represents only 1 % of the raw image intensity. Signal averaging can compensate for this drawback of ASL but requires an increase in scan time which limits spatial and/or temporal resolution (Lebon et al. 1998c).
2.
 of Skeletal Muscle in Neuromuscular Disease: A Clinical Perspective
 of Skeletal Muscle Anatomy to MRI and US Findings
 MRI for Evaluation of the Entire Muscular System
 Spectroscopy and Spectroscopic Imaging for Evaluation of Skeletal Muscle Metabolism: Basics and Applications in Metabolic Diseases
 in Muscle Tumors and Tumors of Fasciae and Tendon Sheaths
 of Muscle Injuries


ASL temporal resolution is limited by the need to obtain two images (tag and control). Additionally, because of the time required to allow for tagged blood to flow into the imaging slice, even multislice ASL is limited in its maximum rate of image acquisition relative to BOLD.
Related posts:
of Skeletal Muscle in Neuromuscular Disease: A Clinical Perspective
of Skeletal Muscle Anatomy to MRI and US Findings
MRI for Evaluation of the Entire Muscular System
Spectroscopy and Spectroscopic Imaging for Evaluation of Skeletal Muscle Metabolism: Basics and Applications in Metabolic Diseases
in Muscle Tumors and Tumors of Fasciae and Tendon Sheaths
of Muscle Injuries
Stay updated, free articles. Join our Telegram channel
Full access? Get Clinical Tree
