2 The Imaging Techniques
2.1 Sono-Elastography (Quasi-Static Elastography)
This technique uses operator induced stress or endogenous stress to create strain in the tissue under the US probe. Since the amount of stress is unknown, only the resulting tissue strain is recorded. Different varieties of this method are the most frequently applied elastography module on most high-end commercial US scanners. The method is based on different autocorrelation algorithms and requires variable amounts of force or amplitude of repetitive stress. These methods also induce variable strain artifacts hampering the elasticity assessment.
Presentation: This strain is imaged, frequently superimposed on the B-mode image, as a colour map or as a grey scale map. Changing the Elasticity dynamic range allows focus on smaller or larger elasticity contrasts in the tissue and may alter the colour map.
Quantification: If both lesion and reference tissue is imaged, a strain ratio may be calculated between the lesion and reference tissue and may be used for quantification. A strain indicator on the screen provides feedback to the operator if there is adequate strain in the region of interest. This method relies on a focal stress source being the probe or a source out of the imaging plane. The strain attenuates with increasing distance to this source. Also, as the stress is transmitted through the inhomogeneities of biological tissues, this attenuation of stress will be different in different parts of the ROI.
2.2 Shear wave imaging
There are a number of commercialised methods making use of this relation between the shear wave speed and the Shear modulus, G. The density, ρ of soft biological is close to 1. Some methods give up the shear wave speed directly; others approximate the Shear modulus in KPa by measuring the shear wave speed.
2.2.1 Transient Elastography
The Fibroscan® (Echosense, Paris), is a dedicated instrument for measuring liver tissue stiffness (Castera et al. 2005; Talwalkar et al. 2007; Rockey 2008). A patented US transducer equipped with a small piston creates a shear wave induced from the skin surface intercostally over the right liver lobe.
Presentation: This scanner does not provide a B-mode US image or a strain map. It has a simple A-mode like US image for providing quality assurance for the strain measurements. A strict algorithm requiring ten repeated liver tissue measurements of shear wave speed, within limited variation ensures quantitative measurements of good quality.
Quantification: This method provides quantitative measurements of liver tissue stiffness, but it is not an imaging method as there is no B-mode US image or strain image. The apparatus is easy to learn to use and no knowledge of US scanning is necessary. It has limitations for use in very obese patients or patients who have developed ascites.
2.2.2 Acoustic Radiation Force Imaging
This method uses acoustic energy in order to create shear waves and then US is used to map the shear wave speed within a small ROI (Palmeri et al. 2005; Friedrich-Rust et al. 2009).
Presentation and quantification: The user selects an area of interest and the shear wave velocity is recorded in this space and presented in metres per second. This modality is used together with a qualitative strain imaging map covering a larger area, superimposed on the B-mode image. The shear waves are released transiently, and the observer must allow some time for the transducer too cool down after each release.
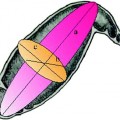
2.2.3 Supersonic Shear Imaging
This imaging of tissue elasticity is made possible by parallel US wave transmission and receiving, and very powerful data processing allowing a frame rate of 5000 frames or more per second. Combined with the tissue stress induced by several columns of circular shear waves parallel to the scanning plane forming parallel acoustic “cones” in the region of interest (Bercoff et al. 2004; Muller et al. 2009).
Presentation and quantification: The shear waves can be tracked due to the high frame rate of the scanner and local differences in shear wave speed can be mapped and tissue elasticity approximated into KPa. This technique is able to image a larger plane with quantitative elastography, as the acoustic signals create shear waves from multiple cones and thus strain attenuation have a more limited influence on the results. The elasticity image is presented as a colour-coded image, and a quantitative KPa result can be obtained from any area containing strain signal. The recording of nonlinear propagation of shear waves made possible with this technique may also be useful in describing the viscosity characteristics of soft tissues, which has not been possible before.
2.3 Strain Rate Imaging
Local tissue velocities can be estimated by using Doppler methods in an attempt to obtain information about GI wall motility (Grubb et al. 1995; Heimdal 2005). To enable differentiation between actively contracting and passively following tissue, a Doppler method based on strain rate imaging (SRI) and estimation of relative strain was developed (Heimdal 2005).
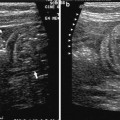
Presentation: The Doppler strain data is displayed as a colour map superimposed on a B-mode image. A ROI is selected and video-clips are analysed to calculate the relative strain of the smooth muscle contraction (Fig. 1).
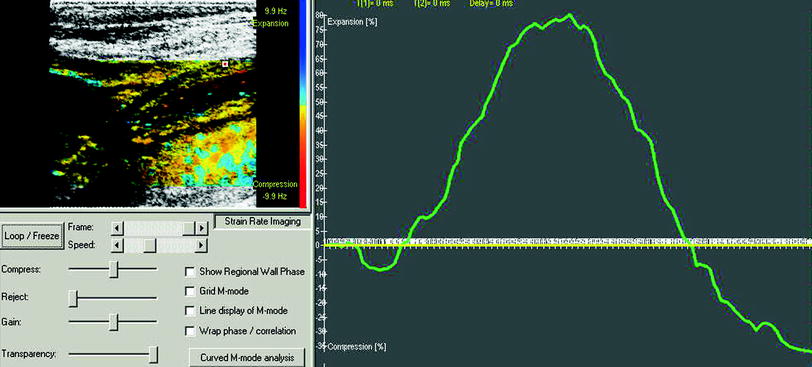
Fig. 1
Stomach: Strain rate imaging of the gastric antrum showing colour-coded doppler signals in the left panel superimposed onto the B-mode image with the measurement cursor located in the muscle layer. In the right panel, the relative strain curve shows 80 % expansion during the gastric relaxation phase
Quantification: The calculation of strain by SRI is based on the relative elongation or contraction of the moving target. The accuracy of SRI was evaluated in vitro using a silicone strip phantom mimicking slowly moving tissue (Matre et al. 2003) and in measuring strain in the porcine antral wall in vitro (Ahmed et al. 2006). SRI demonstrated accurate measurement of radial strain of the antral wall and low intra- and inter-observer variation.
3 Pathological Conditions
External US application:
3.1 Liver Tissue Stiffness
Measuring liver fibrosis without repeated liver biopsies is of relevance in the follow-up of patients with chronic viral hepatitis C/B, alcoholic or autoimmune hepatitis. This may be useful in order to predict disease progression and may be of value in planning for a liver transplantation. Transient elastography has in many publications shown its value for the identification of fibrosis > Metavir score 2 or higher (Fraquelli et al. 2007; Friedrich-Rust et al. 2008) and has become the reference standard for new elasticity imaging methods of liver tissue. Also ARFI (Sporea et al. 2011) and SSI have been successfully been used for this purpose (Gennisson et al. 2009; Bavu et al. 2011). The latter methods may be even more useful in patients with advanced liver disease who also have developed ascites, which is limiting the use of transient elastography. Elasticity imaging of patients at risk of liver disease may also be of value, e.g. for screening patients in general practice or i.v. drug users. This may contribute to earlier diagnosis and treatment (Gennisson et al. 2009; Moessner et al. 2011; Roulot et al. 2011).
Endoscopic US applications: Until date, only one producer of US scanners and EUS endoscopes offer elastography as part of their software. This is Hitachi Medical Corp. in co-operation with Pentax. The EUS elastography reported here is thus based on this system.
3.2 Evaluation of Lymph Nodes in the Mediastinum
Lymph nodes in the mediastinum may be enlarged in a number of diseases. For patients with malignant disease, particularly tumours in lung and breast, the finding of metastatic lymph nodes in the mediastinum leads to adjuvant chemo- or radiotherapy and may limit futile surgery by providing a more accurate N-staging. The oesophagus and the bronchial tree are excellent ways of getting access to this area. Endoscopic ultrasonographic criteria for lymph node evaluation are based on echogenicity, size, border, architecture and short- and long-diameter. Generally, enlarged, rounded, hypoechoic lymph nodes raise the suspicion of metastatic engagement, but B-mode criteria alone overlap with findings caused by benign conditions such as sarcoidosis, tuberculosis and several other inflammatory states. Endoscopic ultrasonography (EUS) combined with sonoelastography has been used in order to evaluate the nature of mediastinal lymph nodes (Fig. 2). Saftoui et al. found a sensitivity of 86.4 % and a specificity of 91.9 % for predicting malignancy when using a mean colour hue cut-off at 166 in 256 colour hues. Janssen et al. found an accuracy of 84.6–86.4 % among three observers using a visual evaluation of predominantly low strain (blue colour) as a sign of malignancy. The conclusion is that the results are good for a non-invasive method, but it is still inferior to the EUS-fine needle aspiration technique, which provides tissue samples.
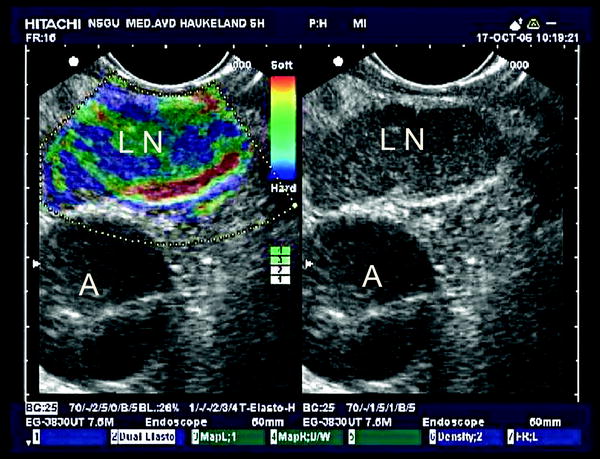
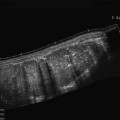
Fig. 2
Metastatic mediastinal lymph node: In the right panel the B-mode image of a mediastinal lymph node (LN) close to the aorta (A). The left panel shows an elastogram with blue and green areas indicating inhomogeneous elasticity with reproducible low-strain areas indicating harder tissue. An EUS guided FNA confirmed metastasis from a non-small cell lung carcinoma
3.3 Evaluation of Solid Focal Lesions in the Pancreas
Focal lesions in the pancreas are being described more frequently as the image quality of CT and MRI has improved. These lesions may represent malignant or benign lesions, and patients may have no symptoms at the time of diagnosis. In some cases, external elastography of the pancreas is possible attempting to evaluate tumour characteristics (Fig. 3). However, in most cases EUS is the method of choice to perform elastography. EUS elastography may improve the preoperative diagnosis of solid focal pancreatic lesions. Cystic lesions in the pancreas usually provide a characteristic artefact consisting of a blue, green, red-layered structure or no signal. Strain is not measurable in a serous fluid, however, D’Onofrio et al. have demonstrated that ARFI can be used to non-invasively differentiate between mucinous and serous cyst fluid (D’Onofrio et al. 2011). This distinction is useful because only the mucinous cysts are considered to have a malignancy potential, while serous cysts and pseudocysts do not. For solid pancreatic lesions, several studies have considered this method prospectively for the distinction between malignant and benign lesions (Figs. 4 and 5). Most studies have used visual categorical scores (Janssen et al. 2007; Hirche et al. 2008; Giovannini et al. 2009). These studies have an accuracy of 45–89 % for diagnosing malignancies. In a multicentre study including 13 European centres, Saftoiu et al. used an automated colour-hue cut-off measuring the mean colour hue in the lesion of interest over several image frames in a cine-loop. This resulted in a sensitivity of 93.4 % and a specificity of 66.0 % (Saftoiu et al. 2011). Generally, all studies end up with an acceptable sensitivity, but with a lower specificity. Cases of focal pancreatitis or microcystic adenomas may sometimes produce elastography images with low strain resembling malignant lesions, and thus make a clear cut-off between malignancies and benign lesions difficult in vivo.
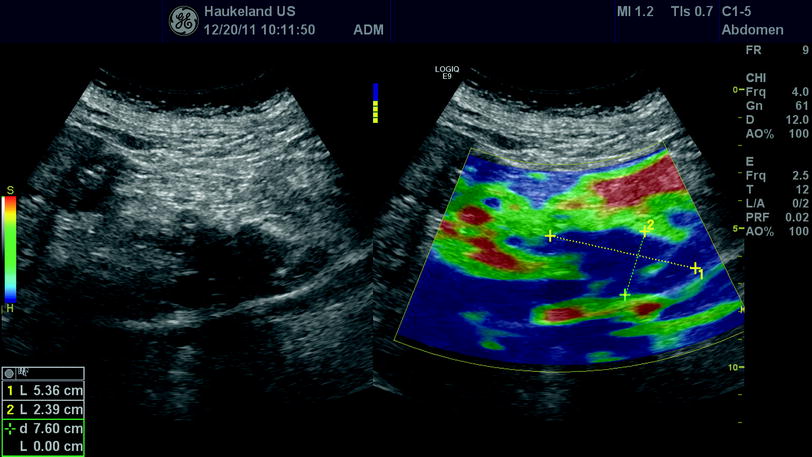


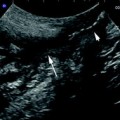
Fig. 3
Pancreas: In the left panel, a B-mode ultrasonogram of a hypoechoic pancreatic tumour is shown in a sagittal section of the epigastrium. In the right panel, colour-coded elastography is applied showing that the tumour is blue (hard) compared with the surrounding tissue in front and above
Related posts:

Stay updated, free articles. Join our Telegram channel
Full access? Get Clinical Tree
